

fig4
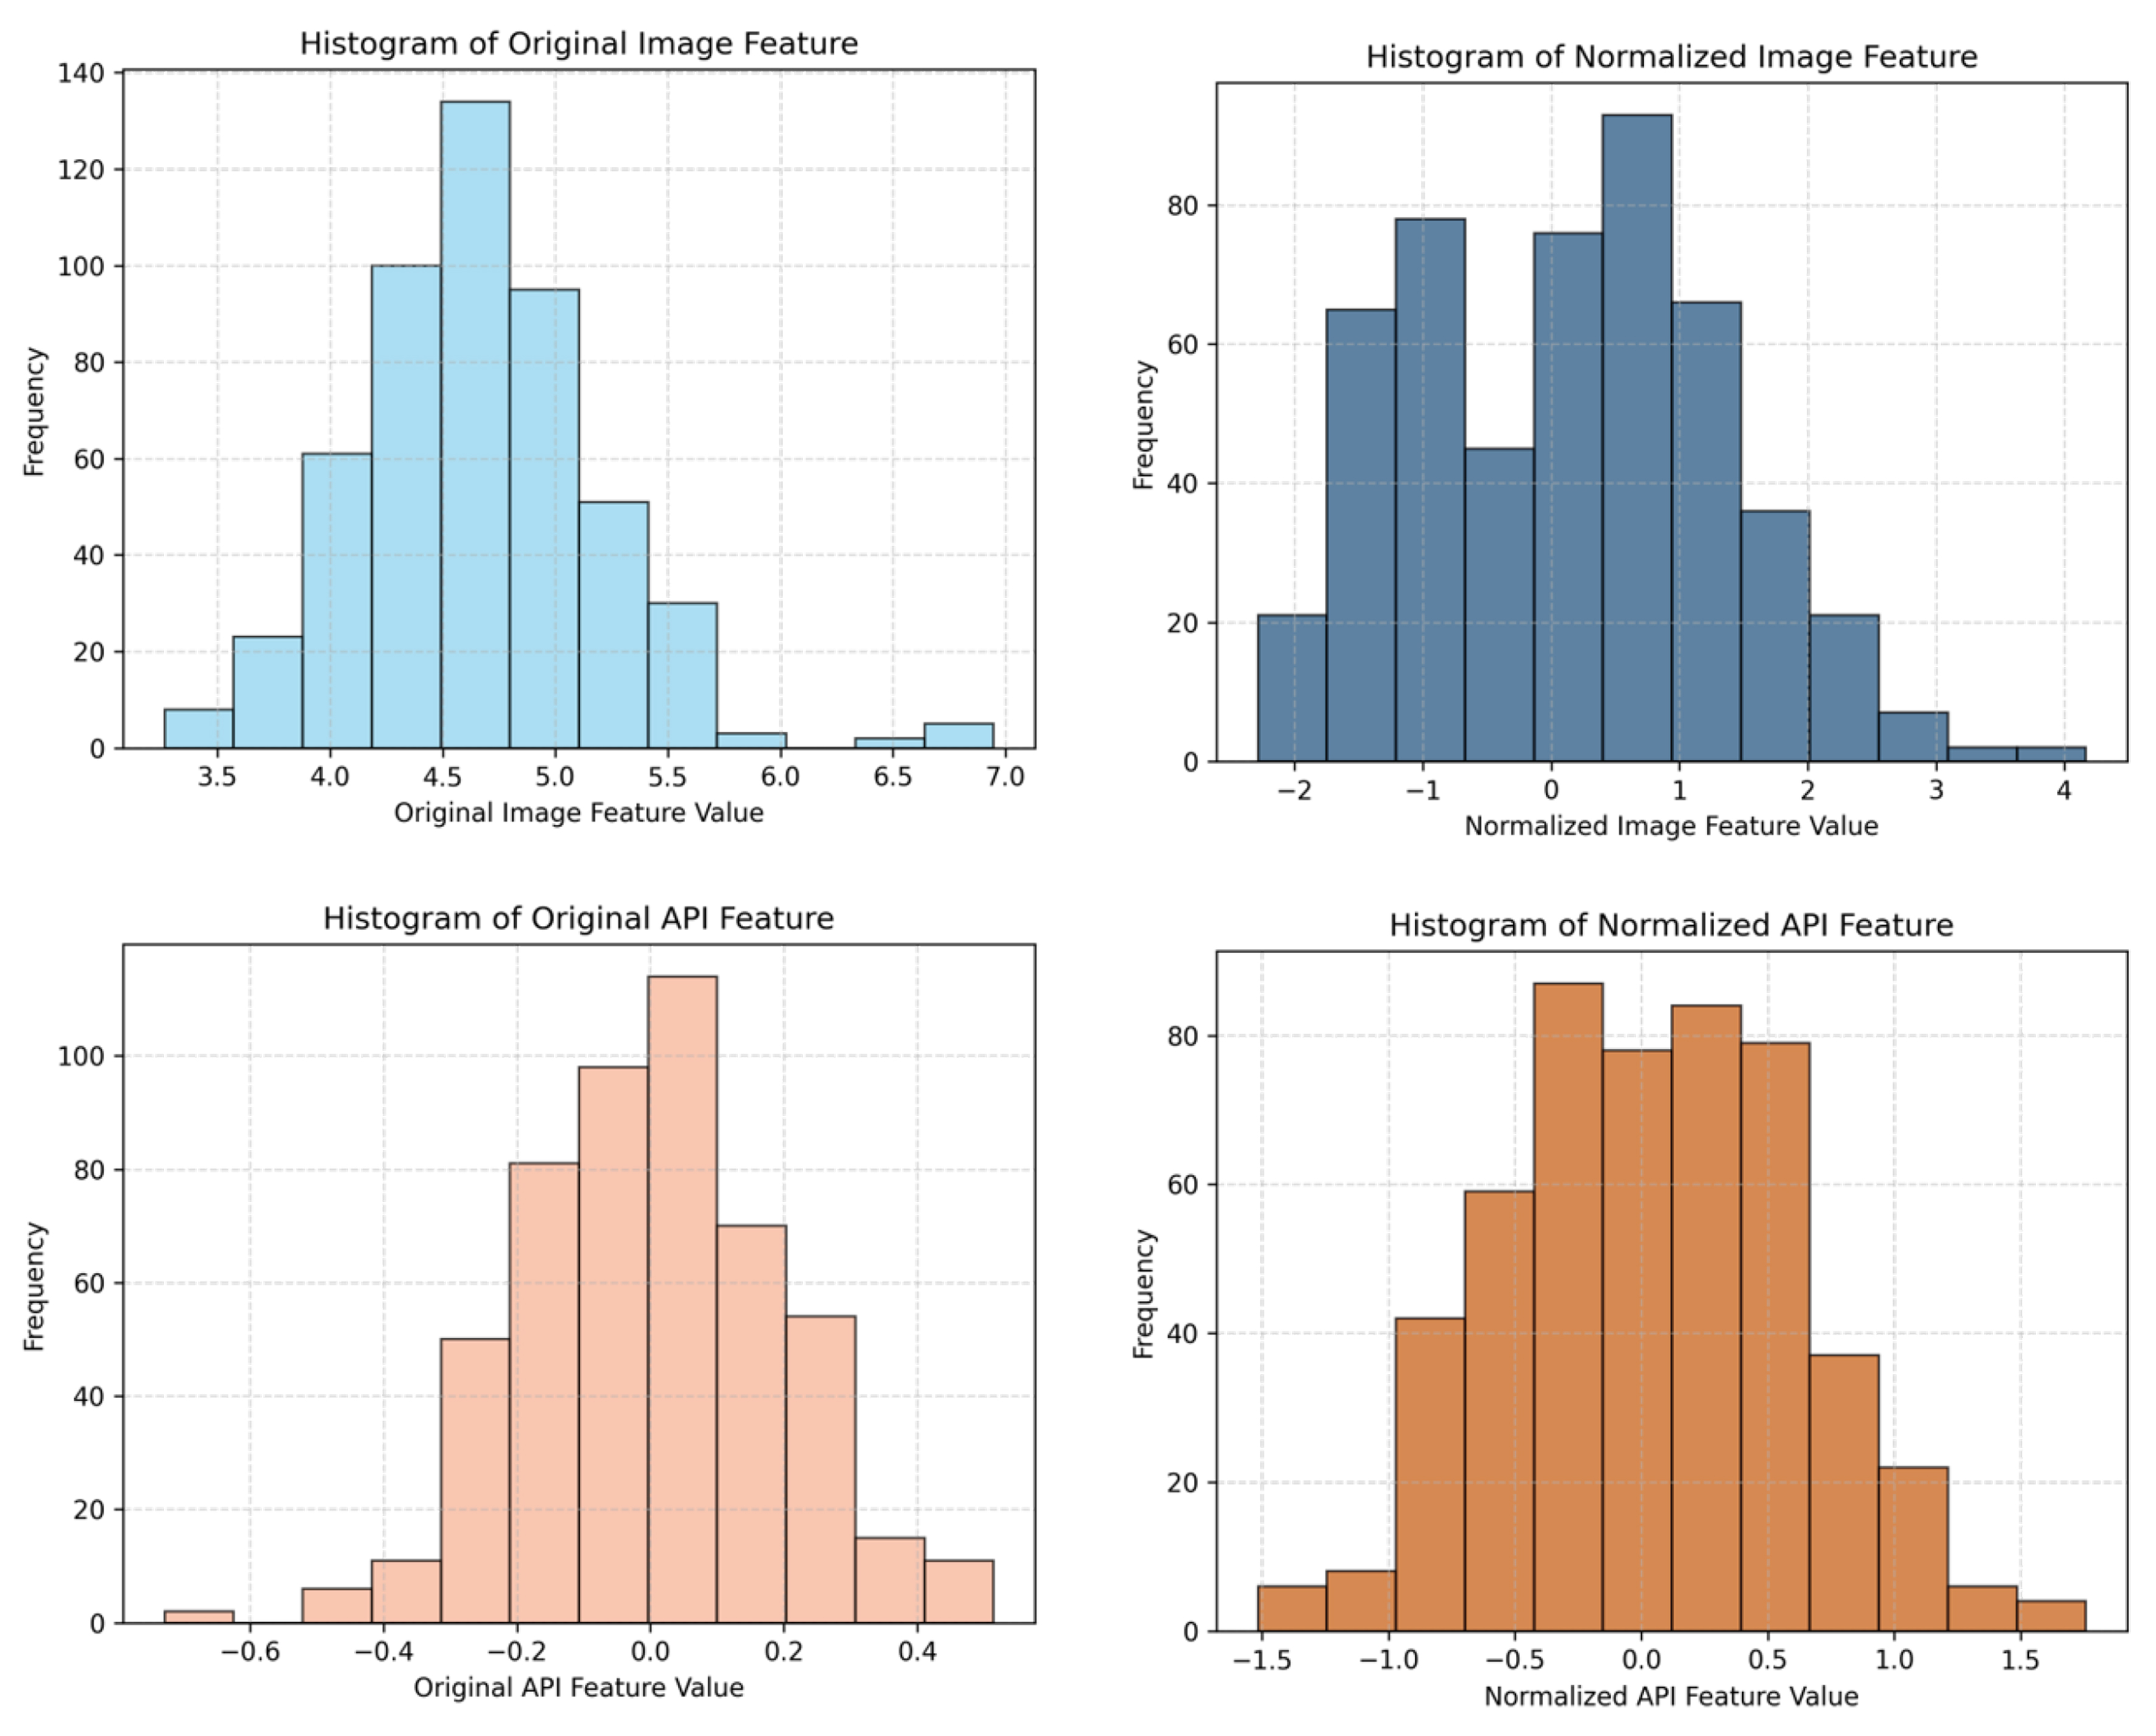
Figure 4. Comparison of value distribution before and after normalization of Image features and API sequence features. The histograms are computed from 1,000 randomly sampled feature vectors from the VirusShare-M validation set, showing the distribution shift after applying the proposed modality-specific normalization. API: Application programming interface.


