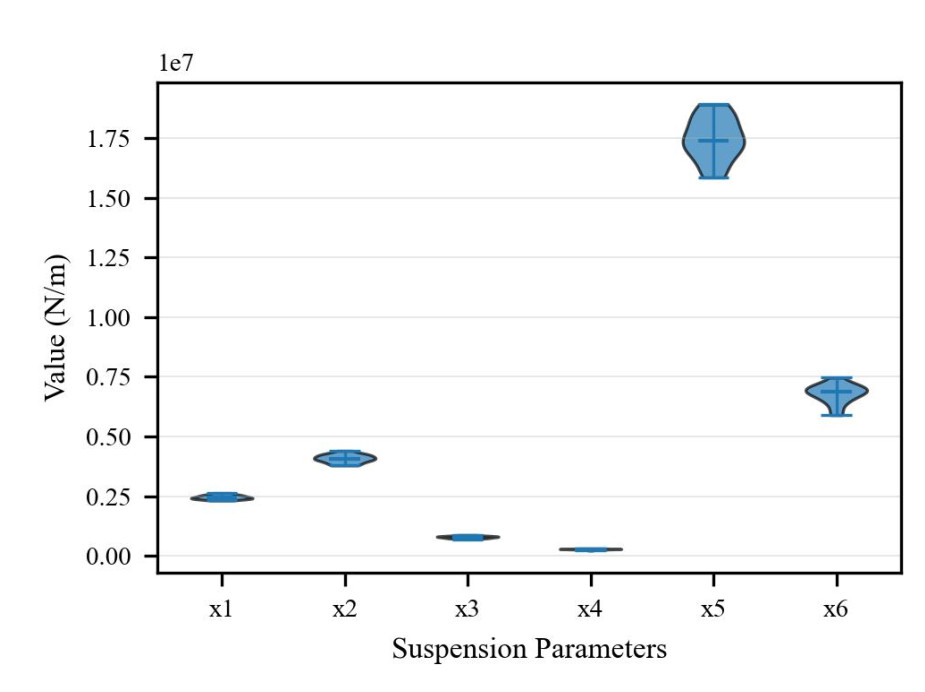
Figure 7. Distributions of the identified suspension parameters $$ x_1 $$ – $$ x_6 $$ across 20 independent trials (units: N/m). Each violin plot illustrates the range, density, and clustering of parameter values, indicating consistent convergence across different surrogate retraining instances.