


fig9
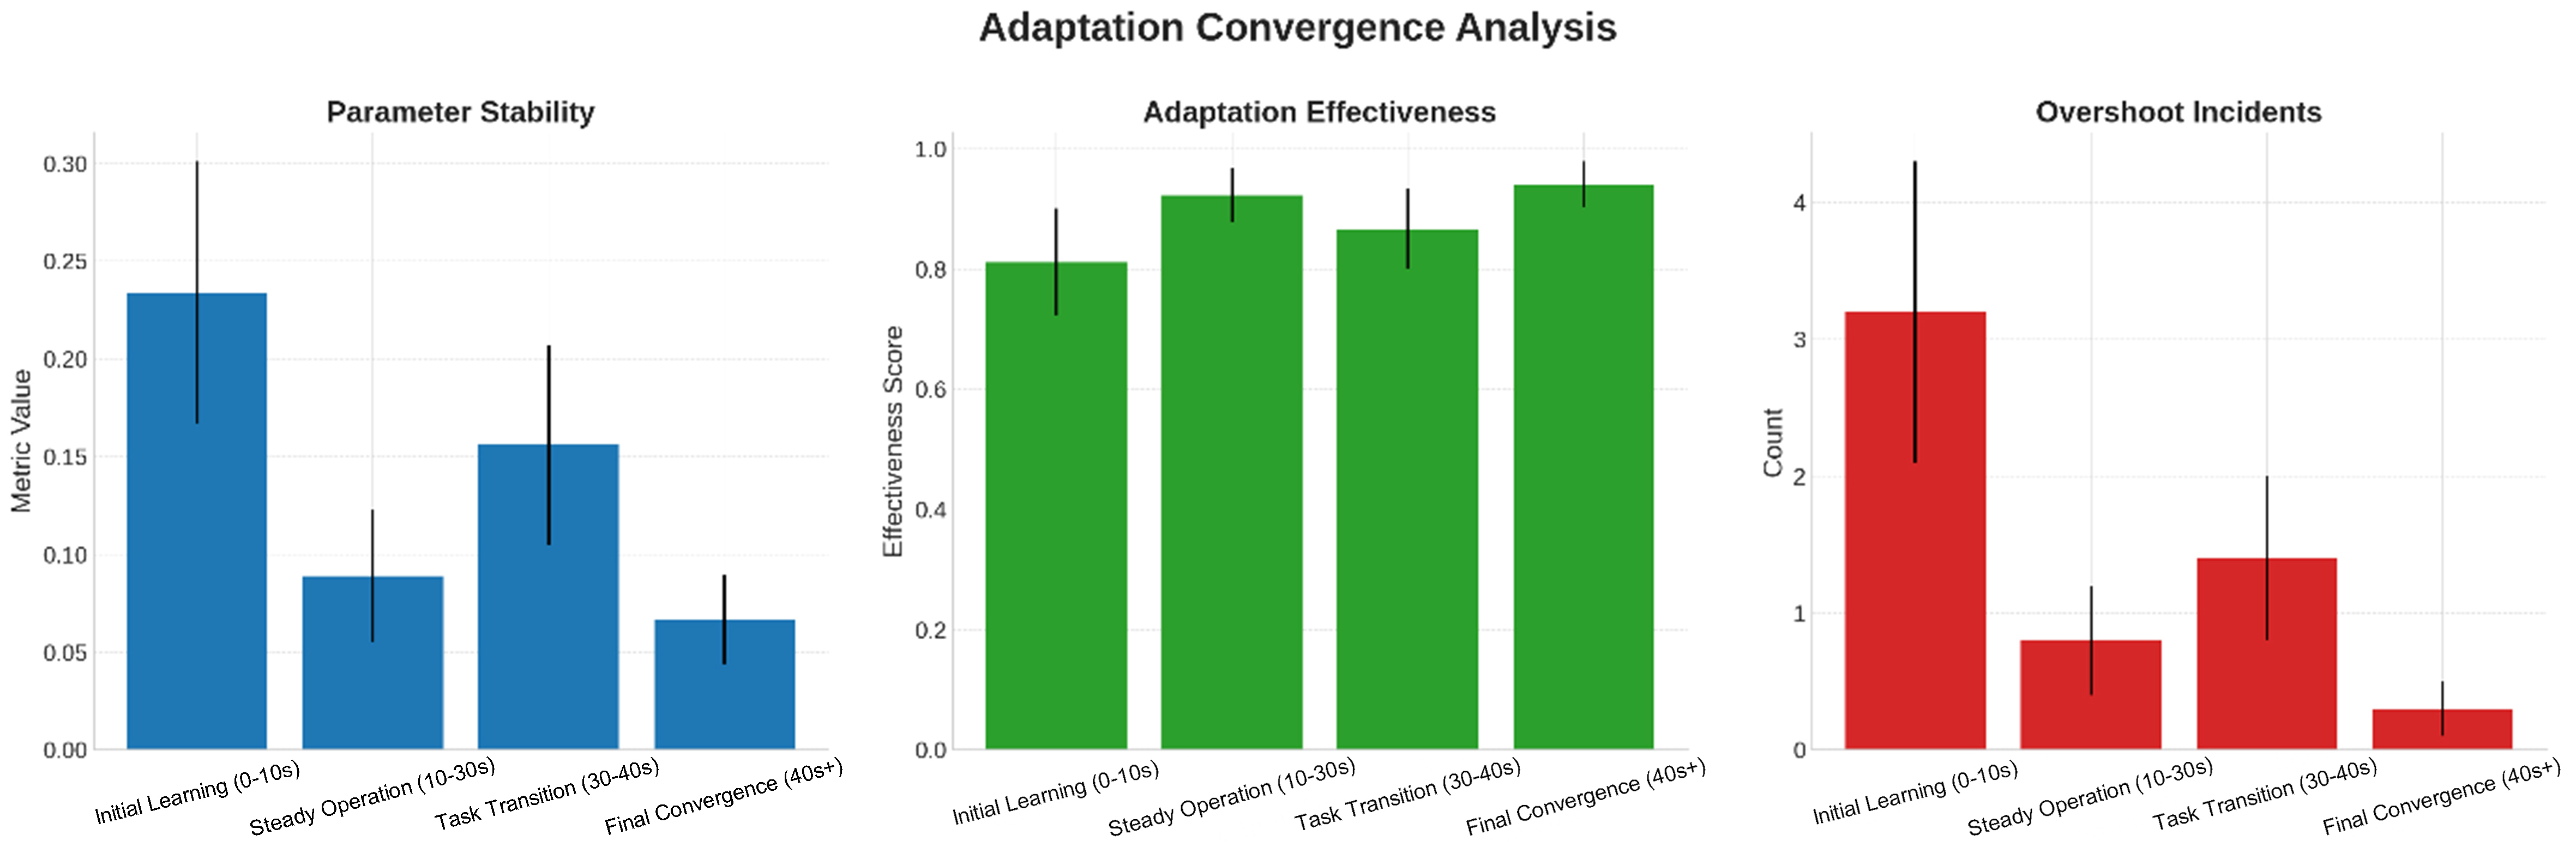
Figure 9. Adaptation convergence analysis. The error bars in the bar chart represent the achieved result points and indicate the standard deviation.
Figure 9. Adaptation convergence analysis. The error bars in the bar chart represent the achieved result points and indicate the standard deviation.


All published articles are preserved here permanently:
https://www.portico.org/publishers/oae/


