


Comparison of methods for isolation of extracellular vesicles from bronchoalveolar lavage fluid
 0
0 
Abstract
Aim: Extracellular vesicles (EVs) have been described and isolated from a variety of biological samples, including bronchoalveolar lavage (BAL). While EVs have been isolated from BAL by various methods, there has not been a comparative study to determine optimal EV isolation methods for this complex and unique biologically derived fluid.
Methods: Membrane affinity binding (exoEasy by Qiagen), ultracentrifugation (UC), and size-exclusion chromatography (SEC) EV isolation methods were compared to determine the best utilization of each method when isolating EVs from BAL.
Results: Both SEC and UC were able to isolate significant EV populations reliably, with UC yielding higher apparent yields by western blotting and Nanosight particle tracking. However, transmission electron microscopy, total protein assays, and proteomic analysis suggested this was due to free protein and protein aggregate contamination. The exoEasy kit demonstrated inconsistent yields and protein measurements that were frequently higher than unprocessed BAL samples. Furthermore, ExoEasy preps contained many unique proteins and higher lipoproteins compared to SEC and UC. This may indicate false signal as a result of the EV isolation process making analysis and downstream applications unreliable without an additional buffer exchange step. Most of the protein in BAL was found in the non-EV fractions. In contrast, virtually all the nucleic acids, both RNA and dsDNA, found in BAL were in the protected environment of EVs.
Conclusion: SEC fractions containing EVs, when concentrated using 30 kDa centrifugal filters, yielded the lowest contaminating free protein and the highest nucleic acid content. This, coupled with good yield and preservation of EV structure and function for downstream use, makes it the ideal EV isolation protocol from BAL.
Keywords
INTRODUCTION
Extracellular vesicle (EV) research has been a rapidly growing field over the past two decades. Through this period, the International Society for Extracellular Vesicles was established and has since regularly produced guidelines for how to isolate and analyze EVs, titled “Minimal Information for Studies of Extracellular Vesicles” (MISEV)[1]. This guide summarizes EV characteristics and isolation from various sample types, including bacteria, blood, urine, cerebral spinal fluid, saliva, synovial fluid, milk, and solid tissue. Less common fluids, such as bronchoalveolar lavage (BAL), have been shown to contain EVs of varying clinical significance[2], but there is no specific literature exists on how to optimize EV isolation from this unique fluid.
Direct analysis of BAL is important when trying to assess pulmonary immune and inflammatory responses. Numerous studies have highlighted that blood immune and inflammatory measurements are poor surrogates for what is occurring in the alveolar milieu[3]. However, analyzing BAL fluid presents several challenges, including the fact it requires an invasive procedure. BAL is a technique performed during fiberoptic bronchoscopy to isolate fluid and cellular contents of the alveolar space for microbial and cellular analysis. It provides both clinicians and scientists the opportunity to assess the inflammatory milieu of the alveolar space. When measuring pulmonary responses, one is technically evaluating the epithelial lining fluid (ELF) coating the alveolar surface. To obtain ELF, BAL is performed, which entails injecting normal saline into the lung followed by gentle aspiration to recover fluid[4]. This results in dilution of the ELF, typically by 33-
Substantial literature exists on EV isolation techniques from other biological samples, including a review article that describes different methods of EV isolation from BAL[9]. There has been no published attempt at optimization of the method for isolating EVs from BAL to maximize EV recovery and minimize contaminants that may influence or confound downstream assays.
Given the inherent dilution and variable nature of clinical samples, isolating EVs consistently and quantitatively from BAL can be challenging. In this work, we compared three published methods of EV isolation [ultracentrifugation (UC), size exclusion chromatography, and exoEasy (EE)] to determine the optimal protocol yielding consistent, quantifiable, and concentrated EVs from BAL with minimal free protein or cell debris contamination. We chose to study UC because many investigators consider this the gold standard for EV isolation[10]. EE was chosen as a representative of affinity column techniques. Size exclusion chromatography (SEC) was chosen because we hypothesized this isolation method would have the least effect on EV ultrastructure and have less contaminated contaminated by free protein aggregates.
METHODS
Specimen source and preparation
Two sources of frozen BAL were used for this study. The major source of BALs were from the Indiana University CLIA-approved Clinical BAL lab (n = 37), which performs cellular analysis for physicians to assist in diagnostic testing for various interstitial and alveolar lung diseases. The lab has Institutional Review Board (IRB) approval to utilize de-identified residual material for research purposes (IRB 1011003397). We intentionally chose to examine BALs with different inflammatory milieus (lymphocytic predominant, neutrophilic predominant, normal BAL differential) to improve the generalizability of the results. The second source of BAL samples came from prior National Institutes of Health-supported studies on healthy HIV-infected subjects on antiretroviral therapy and normal volunteers at Indiana University (n = 4). A summary of the BAL characteristics from both sources is shown in Supplementary Table 1. Importantly, while this represents a variety of clinical and research samples with differences in the inflammatory milieu between individual BALs, all subjects had BAL EV isolation using all three methods under study and thus served as their own controls. BAL samples are obtained and transported on ice to the BAL lab for processing and analysis[11]. Briefly, after running the sample through a 100 μm filter to remove large debris and mucus, BAL is centrifuged at 500 g for 10 min to obtain a cell pellet and acellular BAL supernatant. A cell differential is performed on a cytospin of the cell pellet for the referring physician. The acellular BAL fluid is stored at -80 °C and served as the material for EV isolation in this study. For experiments exploring dose response to isolation methods, 4, 2, and 1 mL of acellular BAL were used. For all other experiments, 1-2 mL of acellular BAL was used. Prior to EV isolation, stored acellular BAL samples were thawed and further clarified comparing two methods: filtration through a
Top 25 proteins in extracellular vesicles obtained by size exclusion chromatography, UC, and EE
| Protein | SEC | UC | EE |
| Albumin | X | X | X |
| Alpha-1 antitrypsin | X | X | X |
| Complement C3 | X | X | X |
| Ubiquitin 60S ribosomal protein | X | X | X |
| Pulmonary surfactant-associated protein A2 | X | X | X |
| Actin, cytoplasmic 1 | X | X | X |
| Immunoglobulin heavy constant 1 | X | X | X |
| Deleted in malignant brain tumors 1 protein | X | X | X |
| Immunoglobulin heavy constant gamma 3 | X | X | X |
| Immunoglobulin kappa variable 3-20 | X | X | X |
| Polymeric immunoglobulin receptor | X | X | X |
| Immunoglobulin heavy constant gamma 1 | X | X | X |
| Serotransferrin | X | X | X |
| Pulmonary surfactant protein D | X | X | X |
| Complement C4-B | X | X | X |
| Beta-2 glycoprotein 1 | X | X | |
| Immunoglobulin J chain | X | X | |
| Immunoglobulin lambda constant 3 | X | X | |
| Immunoglobulin kappa constant | X | X | |
| Immunoglobulin heavy constant gamma 2 | X | X | |
| Alpha-2 macroglobulin | X | X | |
| Galectin-3 binding protein | X | X | |
| Annexin A2 | X | ||
| Growth factor receptor bound protein 2 | X | ||
| Haptoglobin | X | ||
| Histidine rich glycoprotein | X | ||
| Pulmonary surfactant-associated protein B | X | ||
| BPI fold containing family B member 1 | X | X | |
| Apolipoprotein A-I | X | ||
| Uteroglobin | X | ||
| CD 44 antigen | X | ||
| Calmodulin | X | ||
| Transthyretin | X | ||
| Plasma protease C1 inhibitor | X | ||
| Protein AMBP | X | ||
| Kinogen-1 | X | ||
| Inter-alpha-trypsin inhibitor heavy chain A2 | X |
UC protocol
Filtered acellular BAL samples were centrifuged at 43,000 rpm on Beckman SW55Ti rotor (minimum~125,572 g and maximum 224,089 g in swinging bucket rotor), supernatants were discarded and Gibco Dulbecco’s phosphate buffered saline(DPBS) was added to wash pellets followed by an additional 43,000 rpm centrifugation. Supernatants were again discarded with EV containing pellet resuspended in appropriate amount of DPBS.
EE protocol
Filtered and concentrated acellular BAL was processed using Qiagen EE Maxi kit according to manufacturer’s provided protocol: Equivalent volume of provided buffer XBP was added to sample and gently mixed by inverting tube 5 times and allowing the sample/XBP solution to come to room temperature. This solution was then added to the provided EE spin column and centrifuged at 500 × g for 1 min at room temperature with flow through discarded. The spin column containing bound EVs was then washed with 10 mL provided buffer XWP and centrifuged at 5,000 × g for 5 min at room temperature two times with flow through discarded after each centrifugation. The spin column was then transferred to new provided collection tube with 250 µL provided buffer XE (elution buffer) added and incubated for 1 min at room temperature prior to centrifugation at 500 × g for 5 min at room temperature. The eluate was then reapplied to the column and incubated at room temperature for 1 min and then centrifuged at 5,000 × g for 5 min at room temperature to maximize column yield as indicated in provided kit instructions.
Size exclusion chromatography
Filtered and concentrated acellular BAL was loaded into Izon 70 nm qEV Original gen 2 SEC columns. Eluted fractions were collected utilizing Izon Automated Fraction Collector with settings of Buffer Volume 2.7 mL and Fraction Volume 0.4 mL. Up to 30 fractions were collected. Fractions 1-6 contain EVs and were pooled for further analysis. Fractions 7 and higher were considered “non-EV containing” fractions.
Size exclusion chromatography fraction concentration
Eluted EV fractions 1-6 were too dilute and needed to be concentrated for further studies. To determine the optimal concentration method, equal volumes of pooled fraction 1-6 were concentrated by multiple methods: uc at 43,000 rpm on a Beckman SW55Ti rotor (as described above); exoEasy per the manufacturer’s protocol; and Amicon centrifugal filters with molecular weight cutoffs of 100, 50, 30, and 10 kDa.
Protein concentration assay
Samples were measured for total protein using ThermoFisher Pierce bicinchoninic acid (BCA) Assay on microplate protocol the manufacturer's protocol (Cat No 23225).
Nucleic acid analysis
Samples were treated with 0.1% Triton X-100 and incubated at room temperature for 30 min prior to analysis. RNA was quantified by ultraviolet (UV) spectrophotometry utilizing Thermo Scientific NanoDrop One Microvolume UV-Vis Spectrophotometer (ND-ONE-W), utilizing 0.1% Triton X-100 as a blank as a blank to account for possible background from lysis buffer. EV nucleic acid content for RNA and dsDNA was also measured using an InvitrogenTM Quant-iTTM RNA Assay Kit (cat no. Q33140) and InvitrogenTM Quant-iTTM PicoGreenTM dsDNA Assay Kits (cat no. P7589).
Optimization of EV content quantification
Since EVs have both membrane-bound and intravesicular contents, we performed studies to determien whether various solubilization methods imrpoved. Acellular filtered BAL samples were collected via size exclusion chromatography as described above and then concentrated by 30 kDa Amicon centrifugal filters. Samples were then lysed using either Triton-x 100 0.1% (cat no A16046.AE), Cell Lysis Buffer from Cell Signaling Technology (cat no 9803S), or RIPA Buffer from Thermo Fisher Scientific (cat no 89900) and assessed for protein via BCA Assay and nucleic acid content by UV spectrophotometry.
Western blots
Samples were prepared with Invitrogen Bolt 4 × Sample Loading Buffer (cat no B0007) and 10 × Bolt Sample Reducing Agent (cat no B0009) according to manufacturer’s protocol. Samples were then loaded onto 1.0 mm neutral polyacrylamide gel electrophoresis (NuPAGE) Bis-Tris Mini Protein Gels 4%-12% (cat no NP0321-4BOX) and run according to manufacturer’s protocol. Protein from the gel was then transferred to Bio-Rad Immun-Blot polyvinylidene difluoride (PVDF) membrane (cat no 1620177) using Bio-Rad Trans-Blot Turbo Transfer System. Western Blotting then was completed according to Bio-Rad Western Blotting Protocol utilizing Bio-Rad 10 × tris-buffered saline (TBS) (cat no 1701706435), Tween 20 (Sigma Aldrich cat no P1379-100 mL), and Blotto, non-fat dry milk (ChemCruz cat no sc-2324 250 g) to create the 5% Milk-TBST utilized in Blocking steps. EV transmembrane primary antibodies were obtained from Cell Signaling: Syntenin-1/melenoma differentiation associated gene-9 (MDA9) (E2I9L) Rabbit mAb (cat no 27964S, lot 1), cluster of differentiation (CD81) (D3N2D) Rabbit mAb (cat no 56039S, Lot 2), CD63 (E1W3T) Rabbit mAb (cat no 52090S, Lot 1), and CD9 (D3H4P) Rabbit mAb (cat no 13403S, lot 5). The EV intracellular protein tumor susceptibility gene (TSG101) rabbit mAb was obtained from Invitrogen (cat no PA5-31260). Invitrogen was the source of goat anti-rabbit secondary Ab (cat no 31460, Lot ZA387781) and Super Signal West Femto Maximum Sensitivity Substrate (34096, lot ZG394565). Images were obtained and processed using Bio-Rad ChemiDoc Touch Imaging System.
Nanosight particle tracking
Nanosight LM-10 by Malvern Panalytical along with nanoparticle tracking analysis (NTA) 3.3 software was utilized to quantify particles according to manufacturer's instructions[12,13].
Transmission electron microscopy
Transmission electron microscopy was performed as previously described[14]. Briefly, a few microliters of large extracellular vesicle (LEVs) and small extracellular vesicle (SEVs) were suspended in phosphate buffered saline (PBS), adsorbed on the carbon-coated copper grid by floatation for 20 min, and washed with deionized water six times followed by 1% uranyl acetate staining to enhance the contrast. For the IZON SEC samples, the sample was used directly without any dilution and floatation was performed for 2 min followed by washing and staining. The images were acquired using transmission electron microscopy at 100 kV emission (JEM-1400, Jeol, USA). Images were then analyzed for particle size and morphology using Image J software with scales set appropriately. The diameter of each particle was manually measured. Spherical cupped shaped particles were considered EVs. Smaller non-EV particles, appearing as dark circles without central clearing particles were also measured and all particles measured < 30 nm were considered non-EV contaminants. Between 3 and 5 random fields of viewed at 1,000 × were analyzed for each sample to generate total particle counts, and between 6 and 12,3000 × and 10,000 × images were analyzed for discrete particle size measurement and confirmation of morphology for each 1,000 × field analyzed.
Proteomics
Sample preparation, mass spectrometry analysis, bioinformatics, and data evaluation for quantitative proteomics experiments were performed in collaboration with the Indiana University School of Medicine Center for Proteome Analysis similarly to several previously published protocols[15,16]. Briefly, EV preparations obtained by SEC, UC, and EE from BAL from two subjects were lysed in 8 M Urea and digested with Trypsin Gold/LysC (Promega) and mass spectrometry was performed utilizing an EASY-nLC 1200 high-performance liquid chromatography (HPLC) system coupled to Exploris 480TM mass spectrometer with FAIMSpro interface (Thermo Fisher Scientific). Data were analyzed using Proteome Discoverer 2.5.0.400 (Thermo Fisher Scientific). A Homo sapiens reviewed proteome database (UniProtKB; 20292 sequences downloaded 05132022), plus common laboratory contaminants (73 sequences including streptavidin) was searched using SEQUEST HT. Percolator false discovery rate (FDR) filtration of 1% was applied to both the peptide-spectrum match and protein levels. In the consensus workflow, the precursor ion intensity of unique and razor peptides was used for protein quantification with summed abundances. Only proteins with greater than 2 unique peptides identified were used for various downstream comparisons and pathway analyses. Protein-protein association networks and functional enrichment analyses were performed using the STRING database[17].
RESULTS
Sample preparation prior to EV isolation
The two most common methods of removing large particles from EVs prior to UC, SEC, or EE are using sterile syringe filters (0.65 micron) or a 40 min high speed centrifugation at 10,000 g. We directly compared these two methods, and found that EV particle yields and tetraspanin concentrations were identical [Supplementary Figure 1]. We chose use of the 0.65 um filter for three reasons. First, it is significantly easier and requires less time. Second, we were attempting to include microvesicles and larger exosome populations which might be lost during centrifugation in our preparation. Thirdly, use of a filter is less likely to cause structural damage to EVs compared to high speed centrifugation[18].
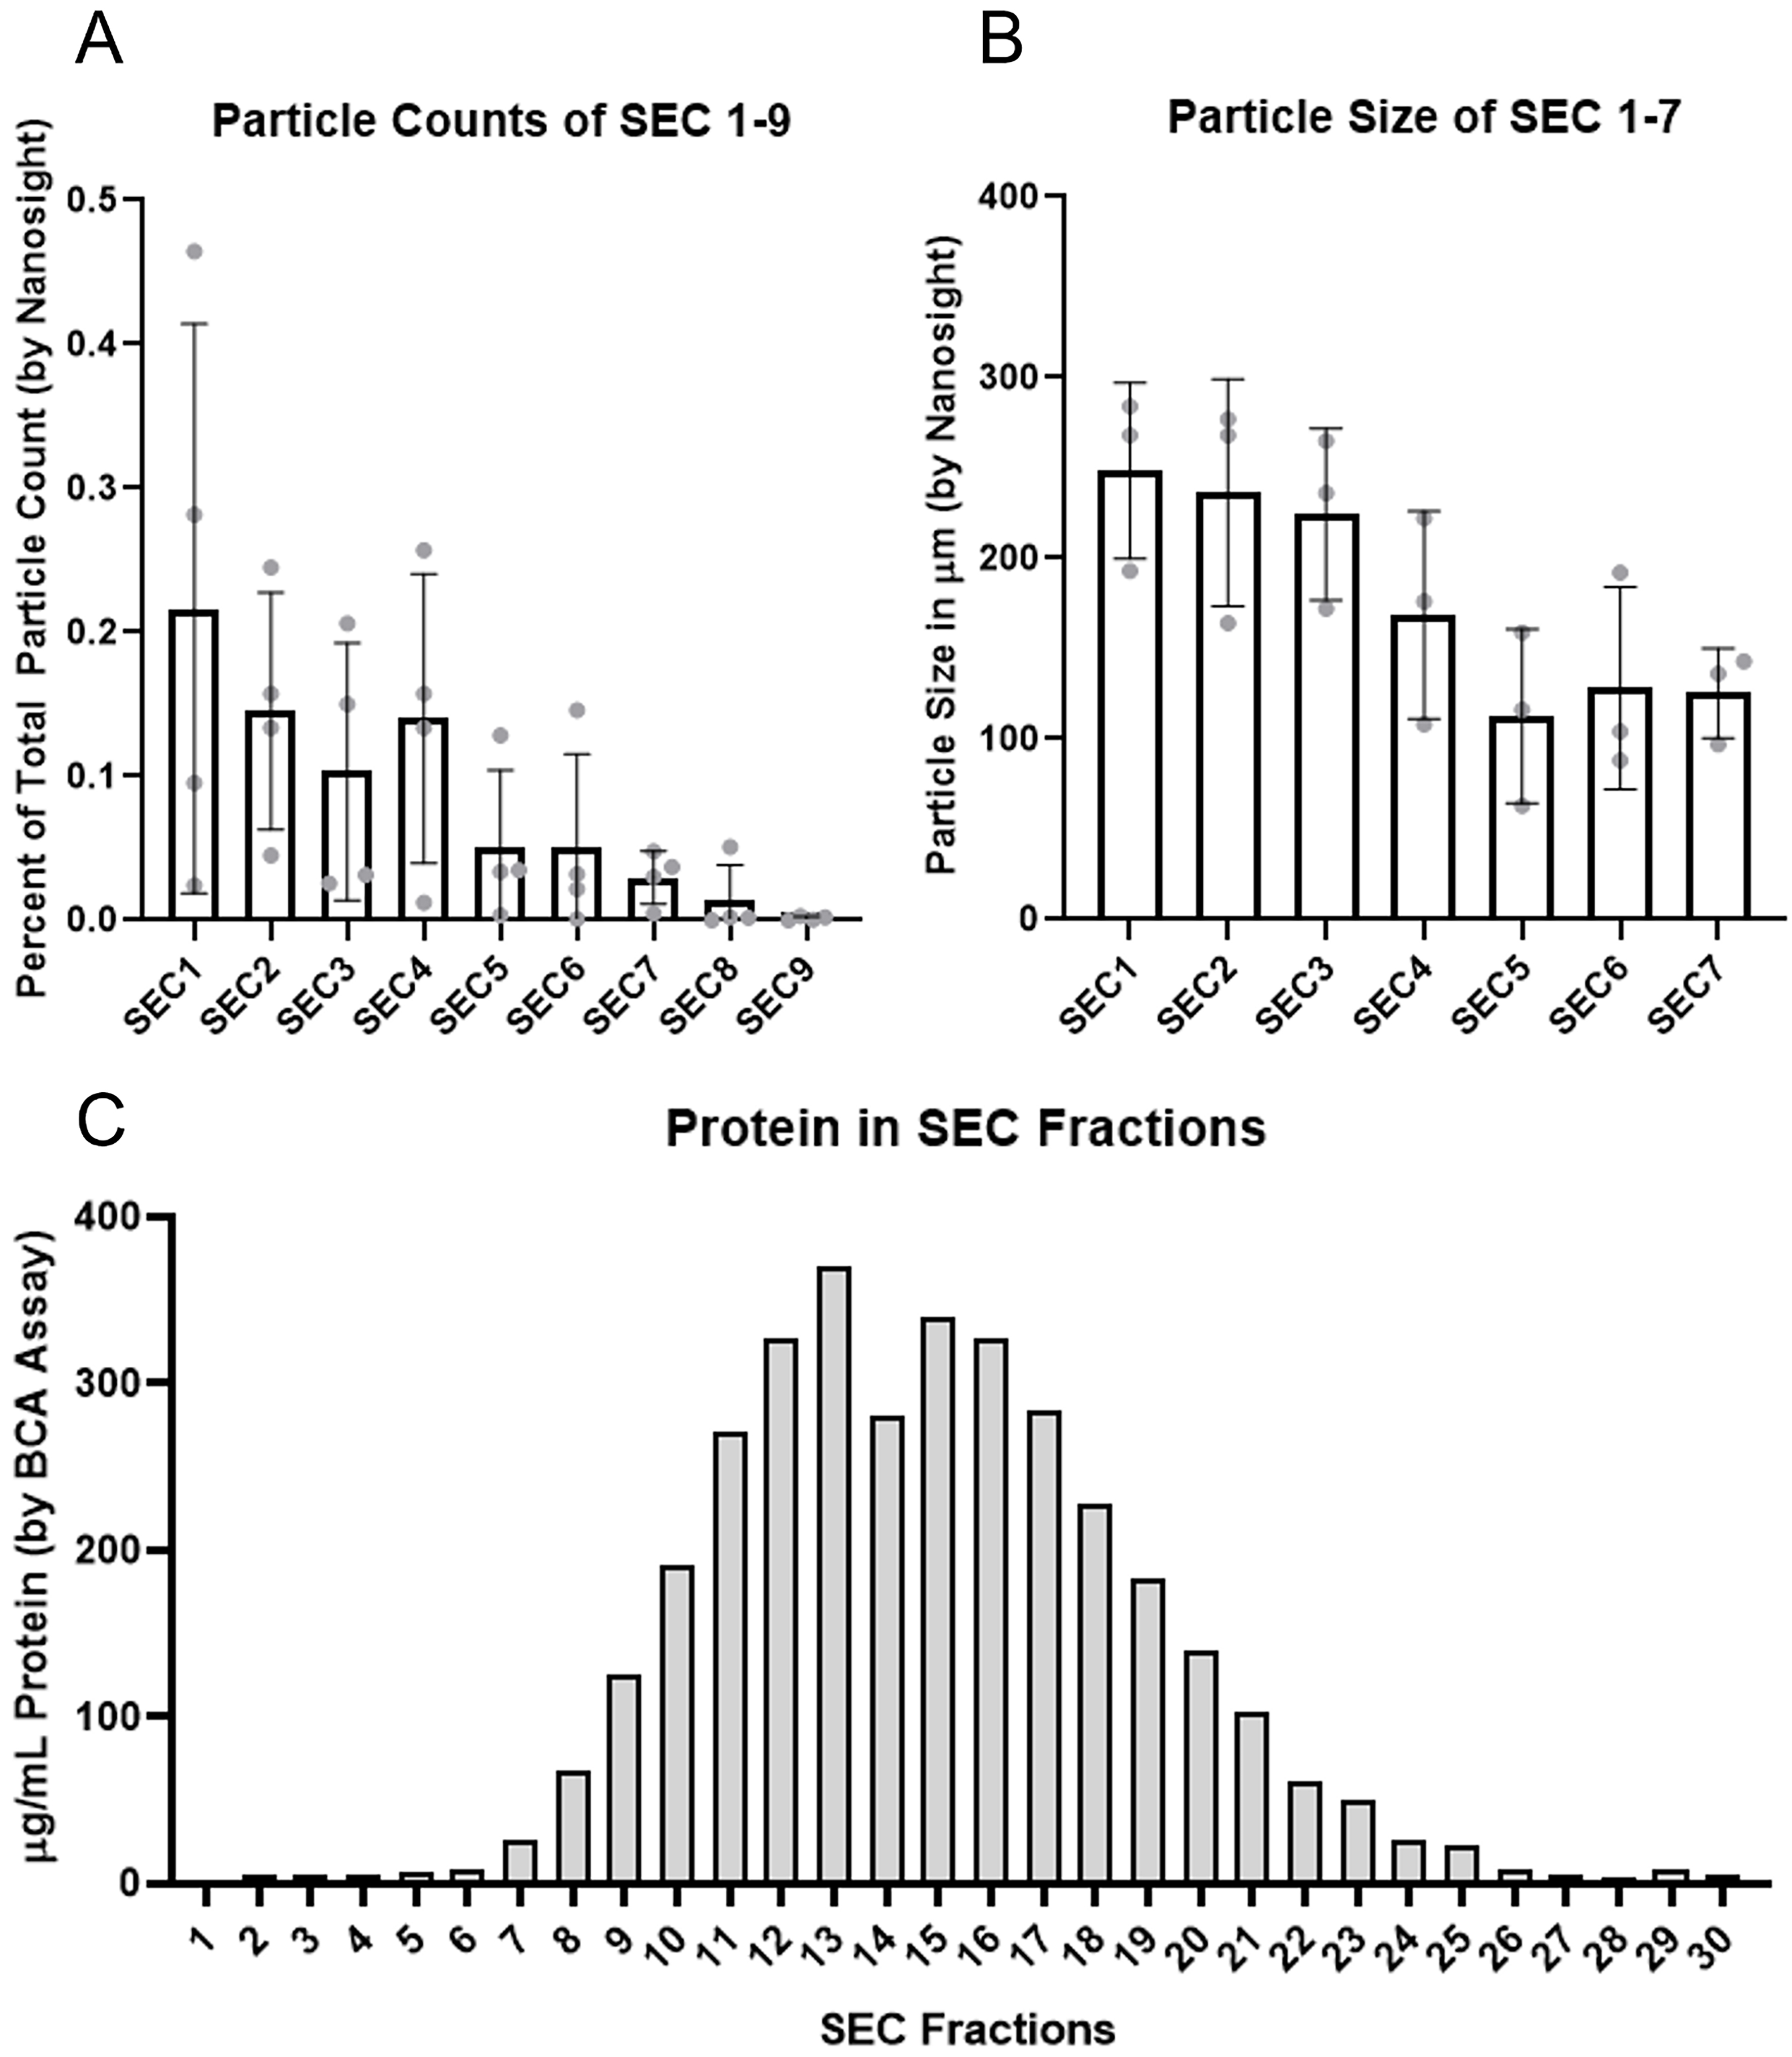
Figure 1. Size exclusion chromatography fraction particle counts, size, and protein content. (A) Particle counts represented as a fraction of total sample particle count as determined by Nanosight LM-10 of SEC Fractions 1-9 demonstrating decrease in particle counts in later fractions until being below the limit of detection by Nanosight in SEC fraction 9, n = 4 subjects, error bars represent standard deviation; (B) Particle size of particles contained within SEC fractions 1-7 demonstrating decrease in particle size with increase in SEC fractions, n = 3 subjects, error bars represent standard deviation; (C) Total protein count in SEC fractions 1-30 demonstrating minimal protein in SEC fractions 1-6 with increase in protein concentration in fractions 7-25 with a peak in fraction 13, n = 1 subject. SEC: Size exclusion chromatography; LM-10: Nanosight LM-10 particle analysis system; SD: standard deviation.
Optimization of size exclusion chromatography
Initial investigations focused on determining which fractions to collect after discarding the buffer volume. Fractions 1-7 yielded particles/frame that were able to be accurately quantified by Nanosight with 88.7% of measured particle contained within fractions 1-6 [Figure 1A]. In addition, there was a predicted gradual reduction in average particle size with each subsequent fraction [Figure 1B]. Assessment of total protein concentrations revealed fractions 1-6 had minimal protein relative to the other fractions and measurable protein started to increase at fraction 7 with a peak at fraction 13 [Figure 1C].
SEC introduces large buffer volumes to the samples during fractionation, which dilutes the sample significantly. To be useful in downstream applications, the fractions collected require a concentration step. Concentration of pooled SEC fractions 1-6 was compared using Amicon filters (10, 30, 50, and 100 kDa), UC, and EE kits. The 30 kDa Amicon filter had the best yield when concentrating samples after SEC using Nanosight particle tracking [Figure 2A]. The superior yield compared to larger kDa filters may reflect smaller EVs passing through or getting stuck on the surface of the filter. Note that concentrating SEC fractions 1-6 using a 30 kDa Amicon centrifuge filter yielded equally high EV particles compared to concentration using a 10 kDa centrifuge filter but with significantly lower free protein contamination [Figure 2B]. EV enrichment was confirmed by western blotting for Syntenin-1 and the tetraspanins CD9, CD63, and CD81 [Figure 2C]. The darker bands observed with the 10 kDa filter and ultracentrifugation further highlight free protein contamination, as particle counts were similar across methods.
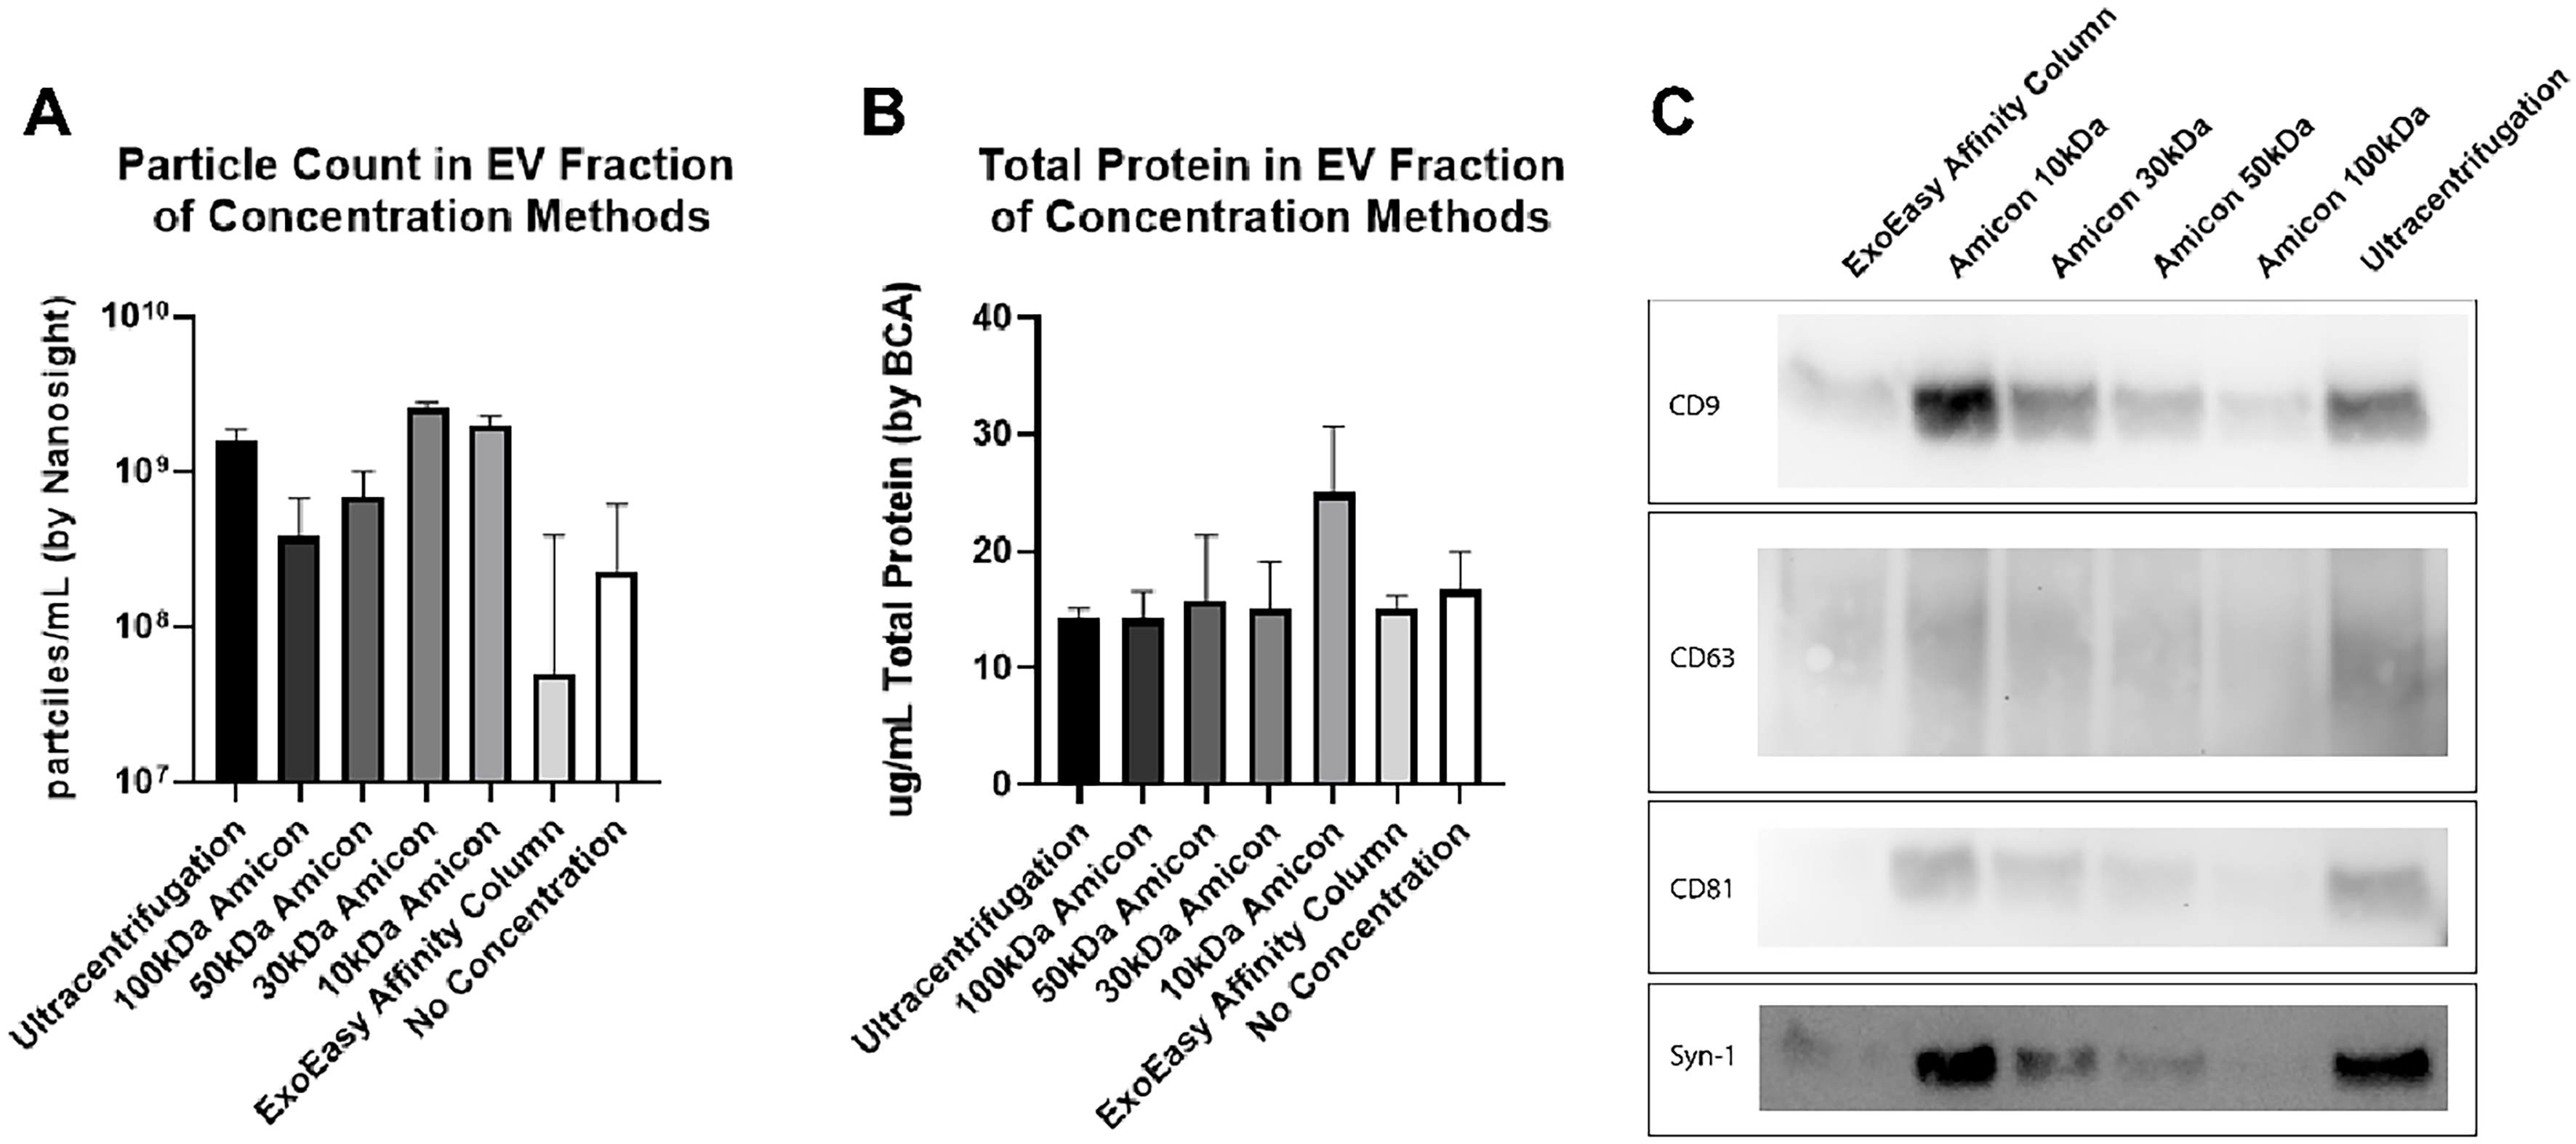
Figure 2. Characterization of BAL EVs isolated by SEC and concentrated by various methods. Particle count as determined by Nanosight (A) and total protein by BCA (B) in each concentration method. Concentrating SEC fractions 1-6 using a 30 kDa Amicon centrifuge filter yielded equally high EV particles compared to concentration using 10 kDa centrifuge filter with lower free protein contamination. n = 1 subject run three times to demonstrate technique reproducibility. Error bars represent SEM as determined by NTA 3.3 software from Malvern Paranalytical; (C) Western Blot of Tetraspannins CD9, CD63, CD81, and Syn-1 of EVs isolated by SEC and concentrated by either Amicon centrifuge filters, EE kit, or ultracentrifugation. BAL: Bronchoalveolar lavage; EVs: extracellular vesicles; SEC: size exclusion chromatography; BCA: bicinchoninic acid; kDa: kilodalton; SEM: standard error of the mean; NTA: nanoparticle tracking analysis.
Direct comparison of the three EV isolation methods
For these experiments, equal amounts of BAL (4, 2, and 1 mL) were processed using each of the isolation methods and particle counts and protein concentrations were measured [Figure 3A]. Using Nanosight particle tracking, EE and UC yielded higher particle counts compared to SEC. However, there was not an appropriate gradient based on the amount of BAL processed using EE despite being loaded with material far below the columns upper threshold as indicated in the published protocol. In contrast, both SEC and UC gave nice dose responses to different amounts of BAL being processed. UC yielded on average one log higher particle count by Nanosight compared to SEC. Analysis of protein concentrations in the EV preparations also showed the highest amounts when EE columns were used [Figure 3B], suggesting contamination of EV preps by proteins from the column or protein aggregates. The SEC method yielded the least total protein overall and changed proportionally to the amount of BAL processed. Furthermore, when compared to UC, SEC demonstrated far less sample-to-sample variability as evidenced by the very narrow error bars.
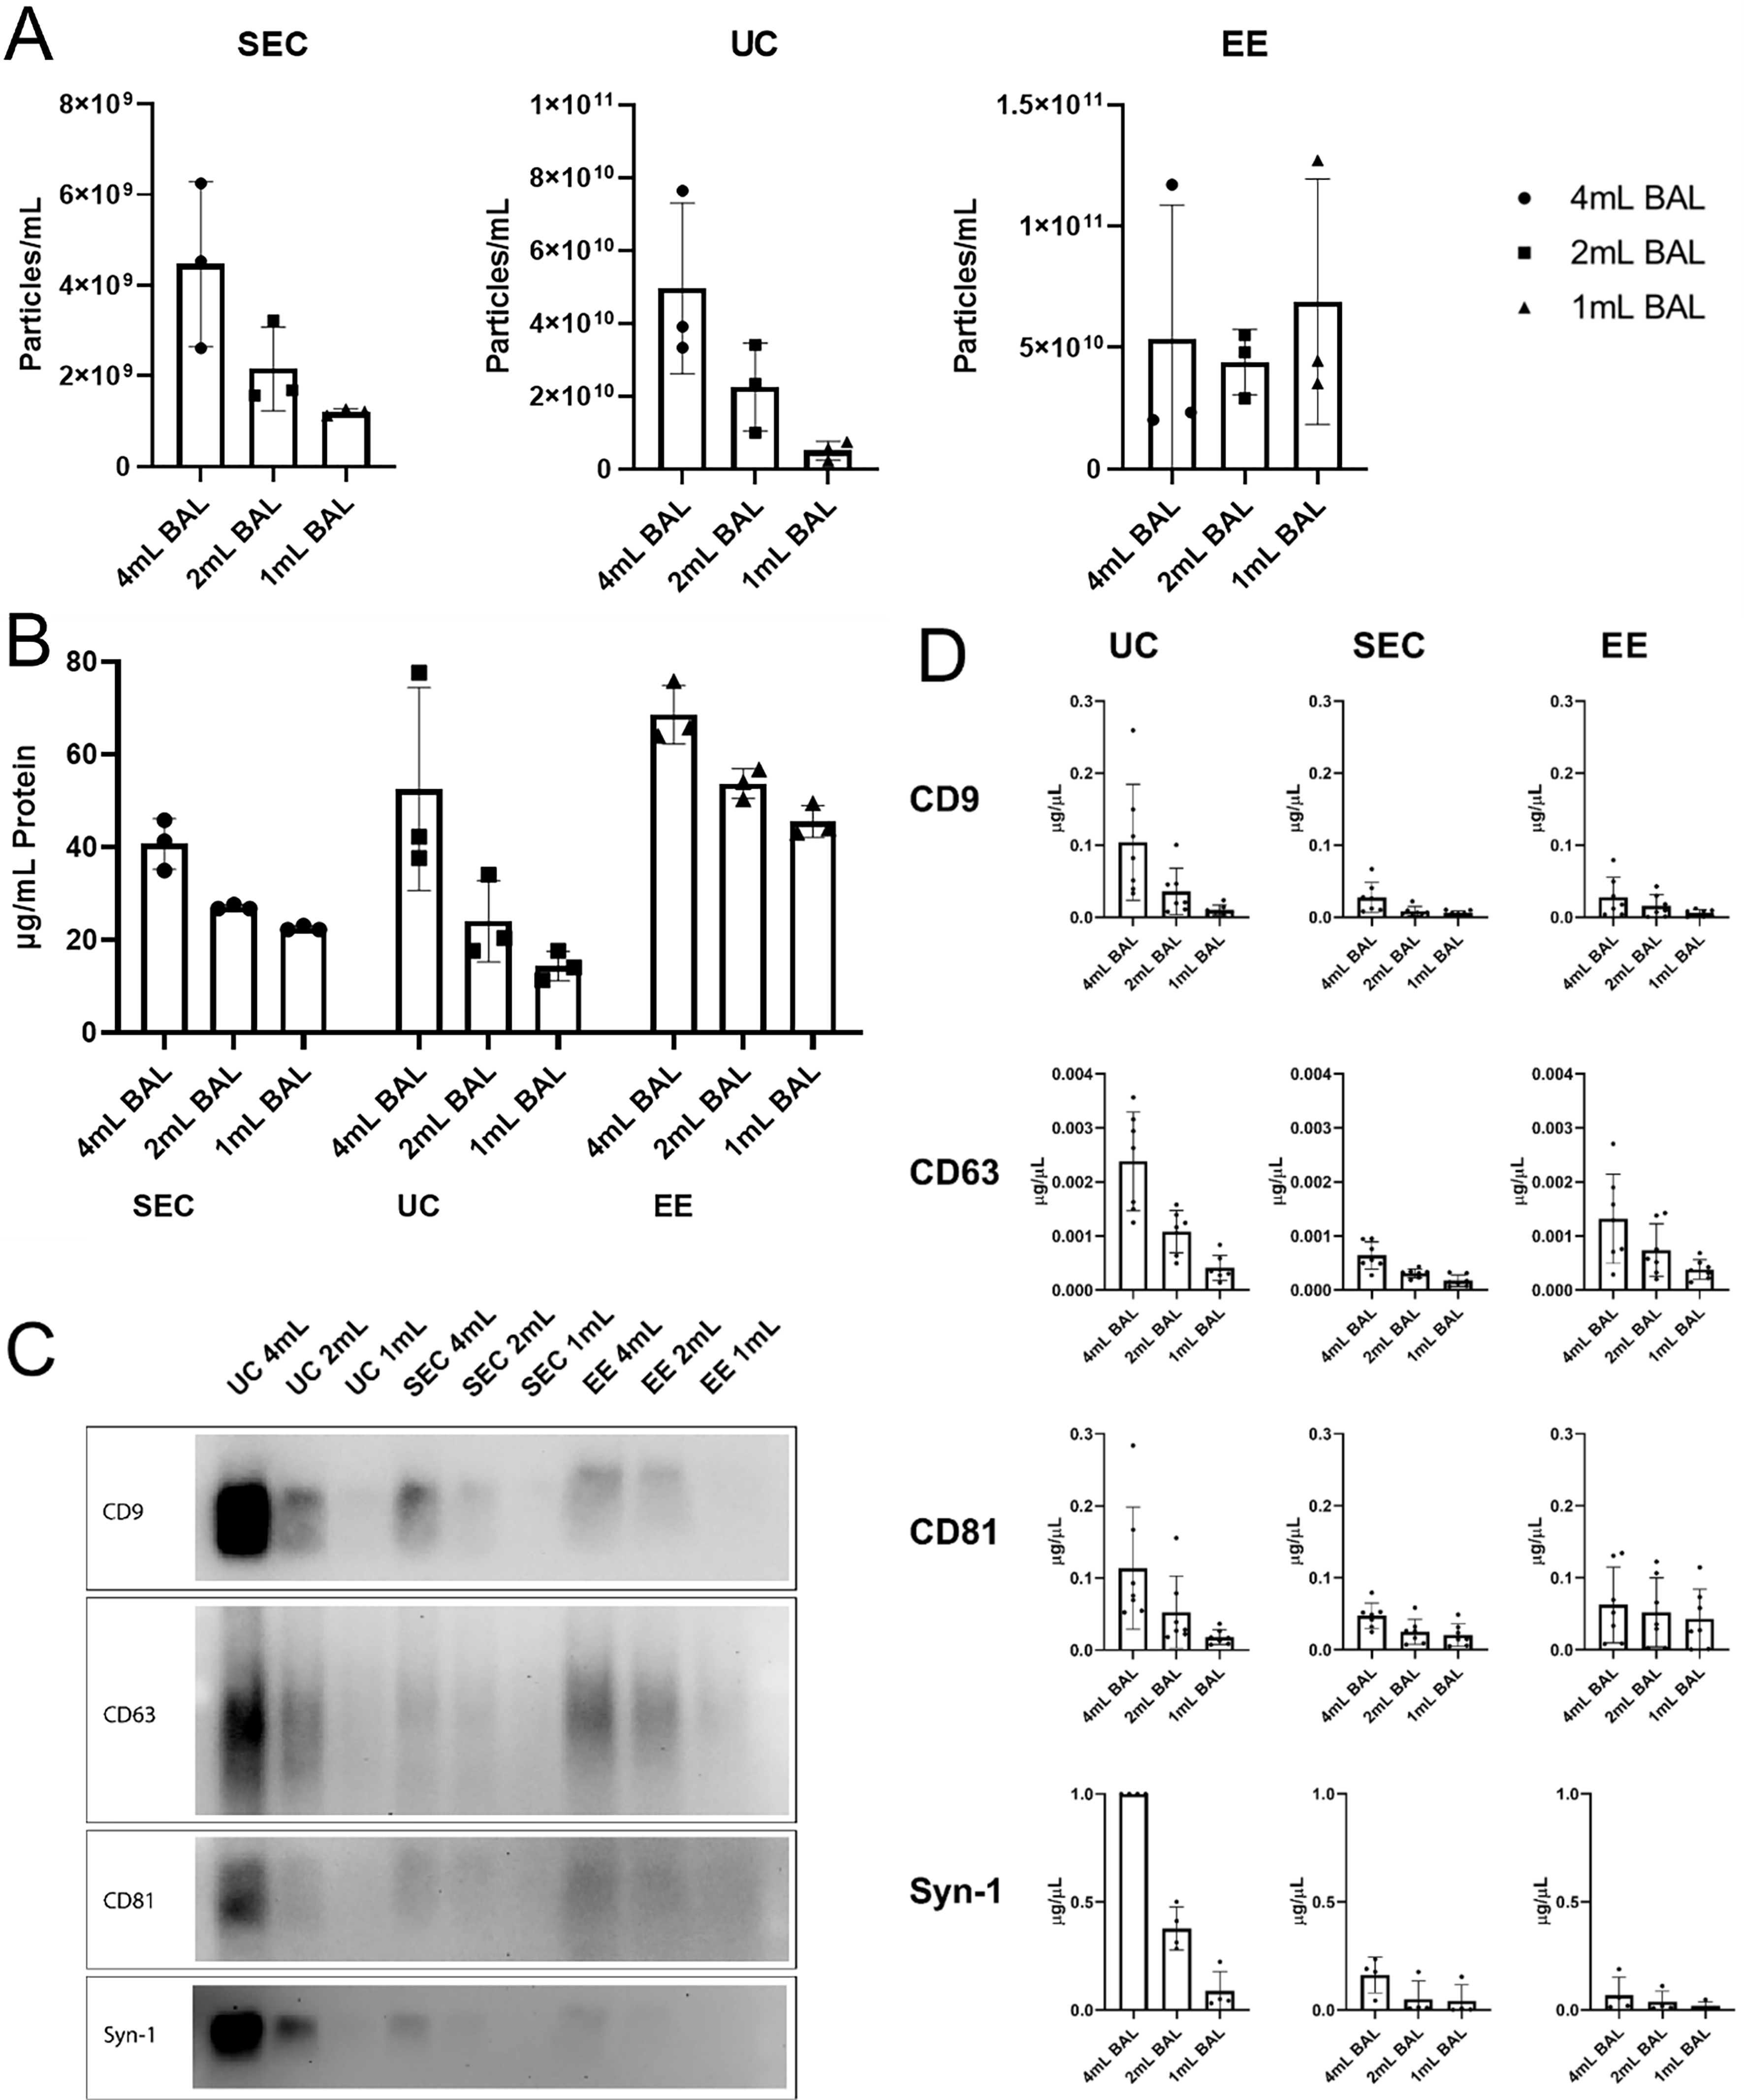
Figure 3. Quantification of EVs isolated by ultracentrifugation, size exclusion chromatography, or EE affinity column. EVs were isolated from 4, 2, and 1 mL of acellular BAL by SEC, UC, and EE. Preparations were then analyzed for (A) particle yield by Nanosight (n = 3 subjects); (B) protein concentration (n = 3 subjects); (C) assessment of EV transmembrane proteins tetraspanin and syntenin-1 by western blotting; (D) Quantitation of western blot bands (n = 3 subjects); (E) Further confirmation of EV isolation was performed by detection of the intracellular EV protein TSG101. EVs: Extracellular vesicles; BAL: bronchoalveolar lavage; SEC: size exclusion chromatography; UC: ultracentrifugation; EE: exoEasy; CD: cluster of differentiation; Syn-1: syntenin-1; TSG101: tumor susceptibility gene 101.
Western blotting for EV transmembrane proteins Syntenin-1 and tetraspanins was performed to confirm the presence of EVs in the preparations. Interestingly, despite having the most EVs by particle tracking, EE preparations contained only small amounts of detectable Syntenin-1 and the tetraspanins CD9, CD63, and CD81 [Figure 3C and D]. UC yielded the largest amount of these proteins on western blotting [Figure 3C and D]. Further confirmation of EV isolation was demonstrated by detection of the intracellular EV protein TSG101 [Figure 3E]. Given concerns about protein contamination with UC, transmission electron microscopy was performed on UC and SEC EV preparations [Figure 4A]. Quantitative analysis demonstrated that SEC yielded more true EVs compared to UC regardless of whether the starting material was corrected for starting volume or the number of EVs as determined by Nanosight [Figure 4B]. These experiments demonstrated that there were not only notably more EVs seen in SEC samples, but there was also less non-EV material present.
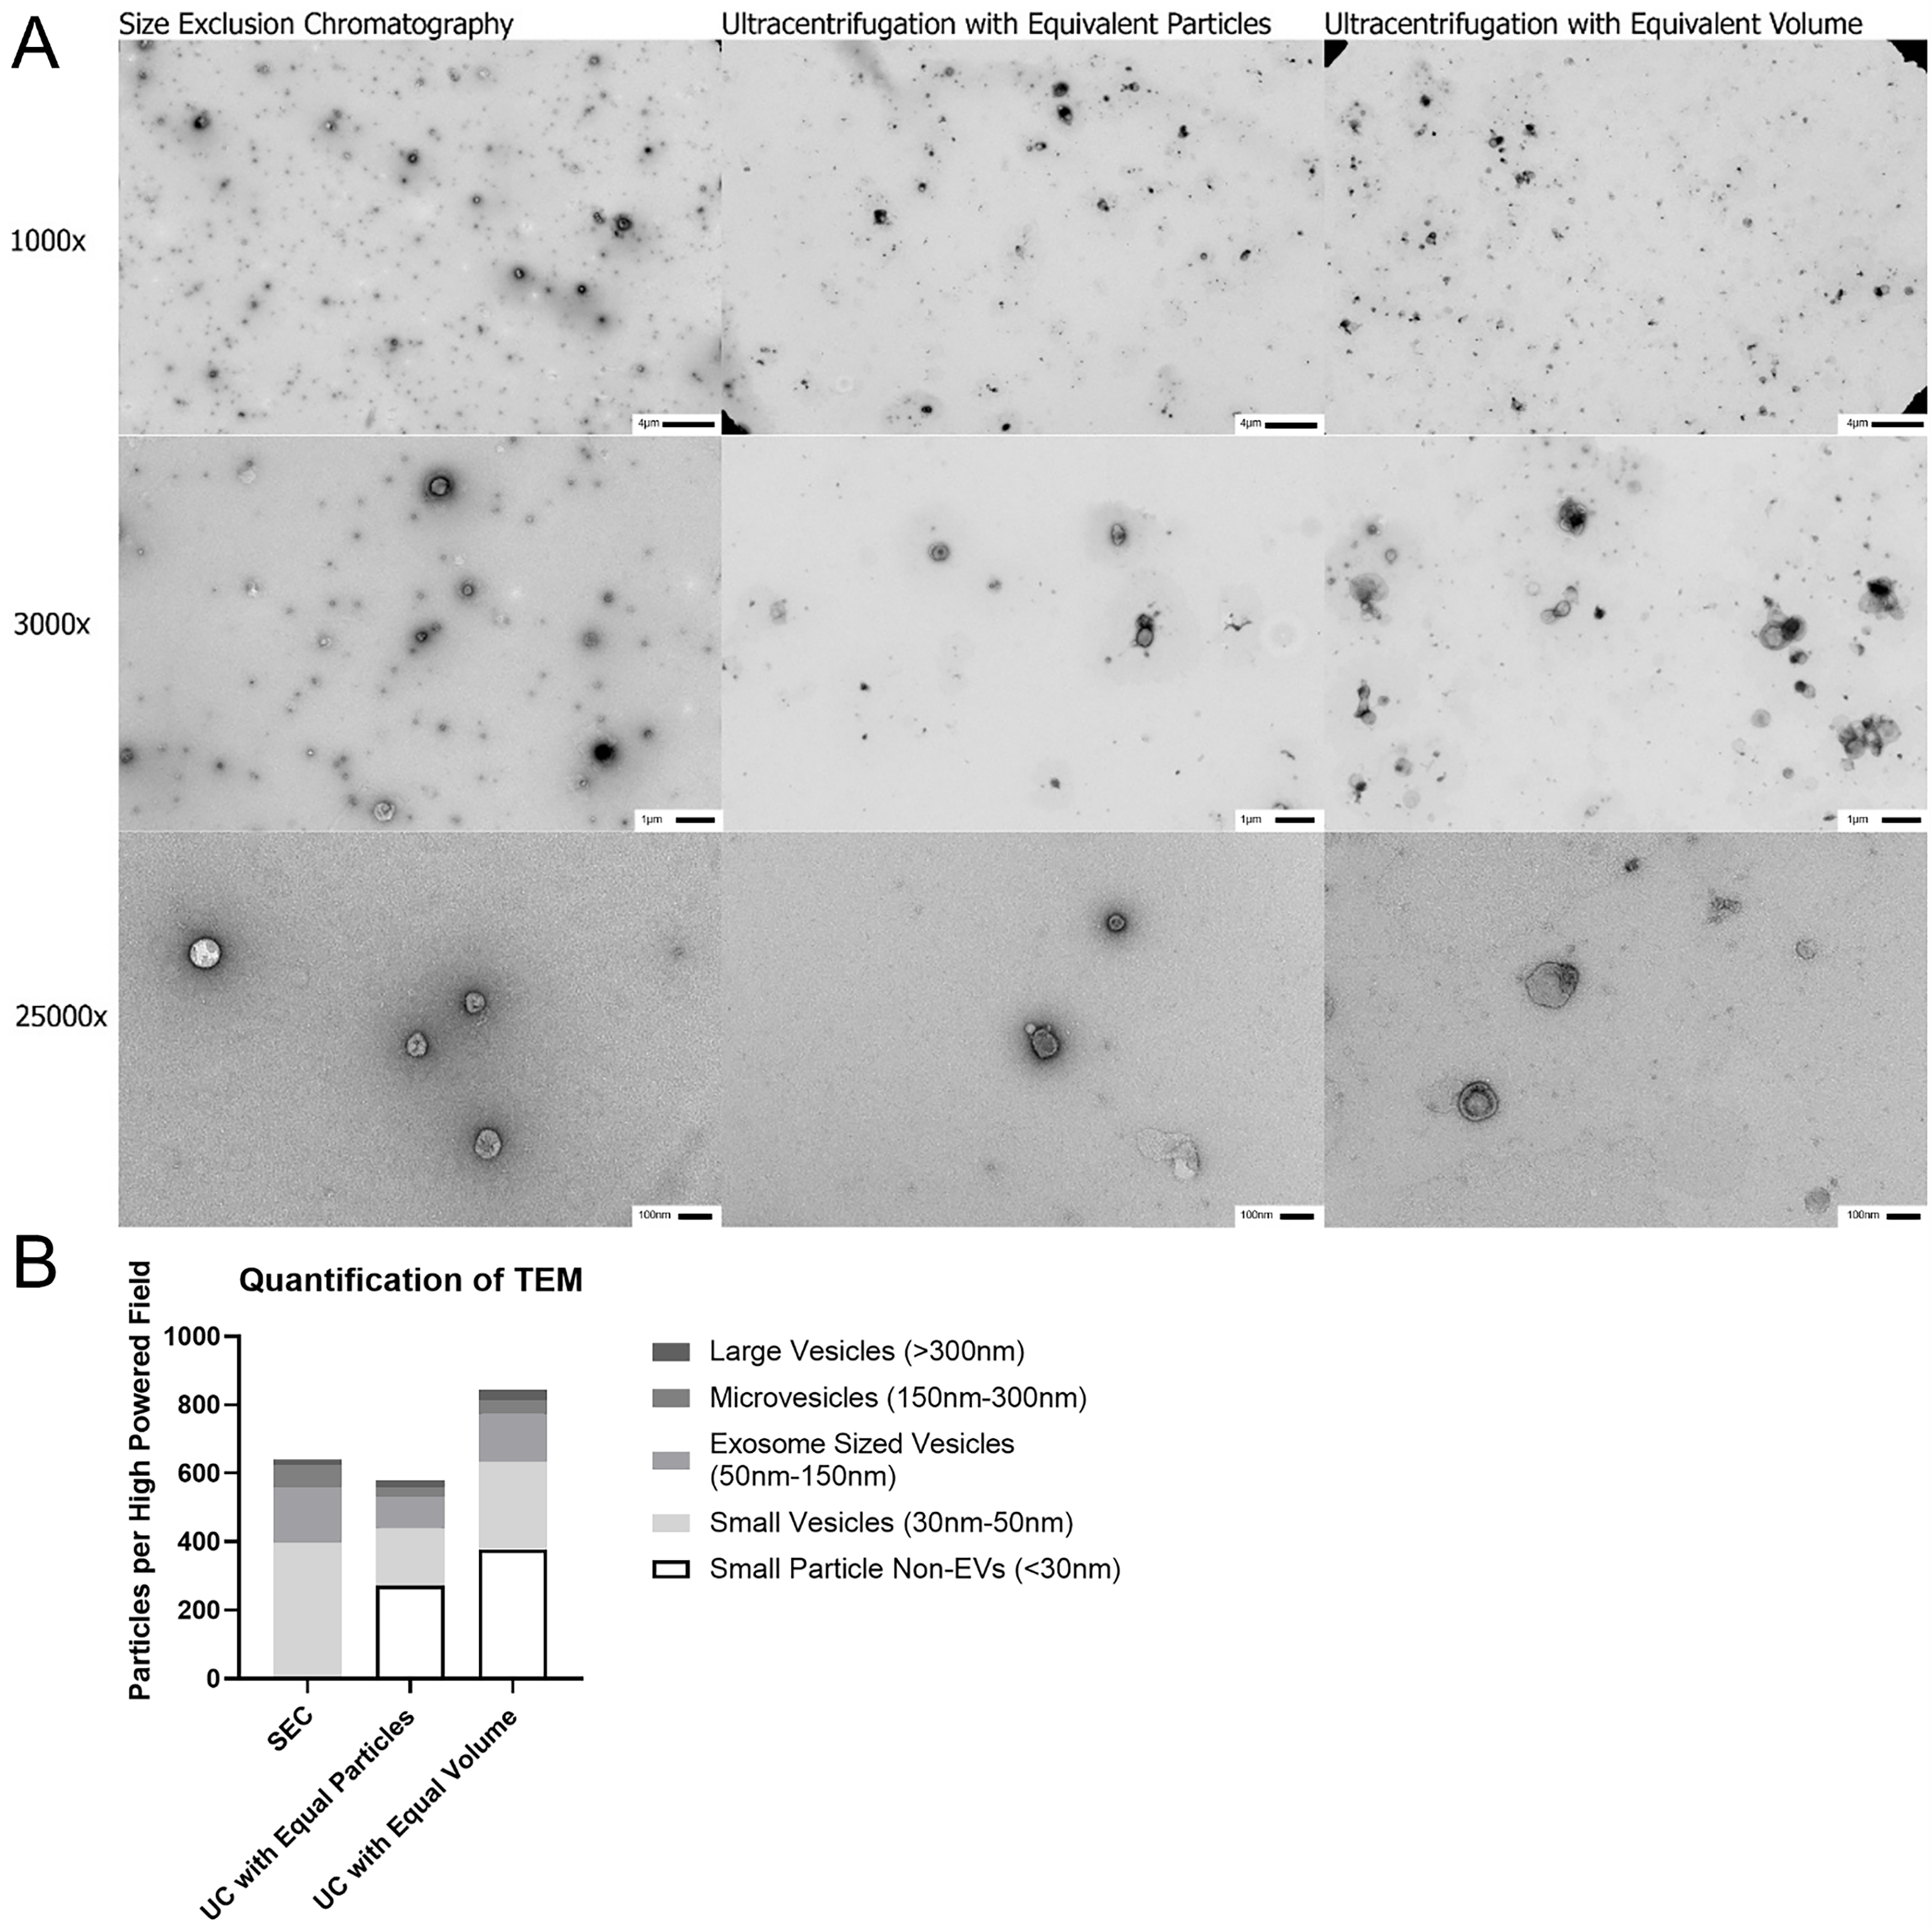
Figure 4. Transmission electron microscopy of EVs isolated from BAL by SEC and UC. (A) EVs were isolated by SEC and UC and preparations imaged using both equivalent particle counts by Nanosight LM-10 and equal volume from original acellular BAL to visualize EV yield, 1,000 ×, 3,000 ×, and 25,000 × magnifications are shown. All samples imaged demonstrate typical cupping that is characteristic of EVs, but the SEC sample shows higher density of identifiable EVs per High Powered Field; (B) 1,000 × images were used to quantify number of particles with 3,000 × and 25,000 × magnifications utilized to clarify size and nature of particles. Non-EV particles were not included in the counts as determined by lack of central cupping on higher magnification images. SEC demonstrated significantly higher quantities of small particles EVs and the Exosome population compared to both UC preparations. n = 3-5 HPF for 1,000 × and 5-9 HPF for 3,000 × and 25,000 × magnifications. EVs: Extracellular vesicles; BAL: bronchoalveolar lavage; SEC: size exclusion chromatography; UC: ultracentrifugation; TEM: transmission electron microscopy; HPF: high power field.
Analysis of EV and non-EV content
Next, we wished to further characterize the contents of EV and non-EV fractions obtained by SEC. SEC fractions 1-6 were concentrated using a 30 kDa Amicon filter. Fractions 7 and above were also pooled and concentrated. As expected from Figure 1C, the majority of protein detected in BAL by BCA assay (95.9%) is in the non-EV fraction [Figure 5A]. All three EV isolation methods similarly removed the majority of free protein from bronchoalveolar lavage [Supplementary Figure 2]. In contrast, using NanoDrop spectrophotometry, we found that 89.2% of nucleic acids are contained within EV fraction [Figure 5B]. We also tested whether treating EVs with various detergents to lyse membranes would increase protein content. Supplementary Figure 3 demonstrates that treating EVs with various membrane lysis agents increased expression of syntenin-1 and all the tetraspanins. This figure also demonstrates that EVs were only contained in SEC fractions 1-6, as all the remaining pooled and concentrated SEC fractions (7-30) demonstrated no syntenin-1 and tetraspanin signaling on western blotting.
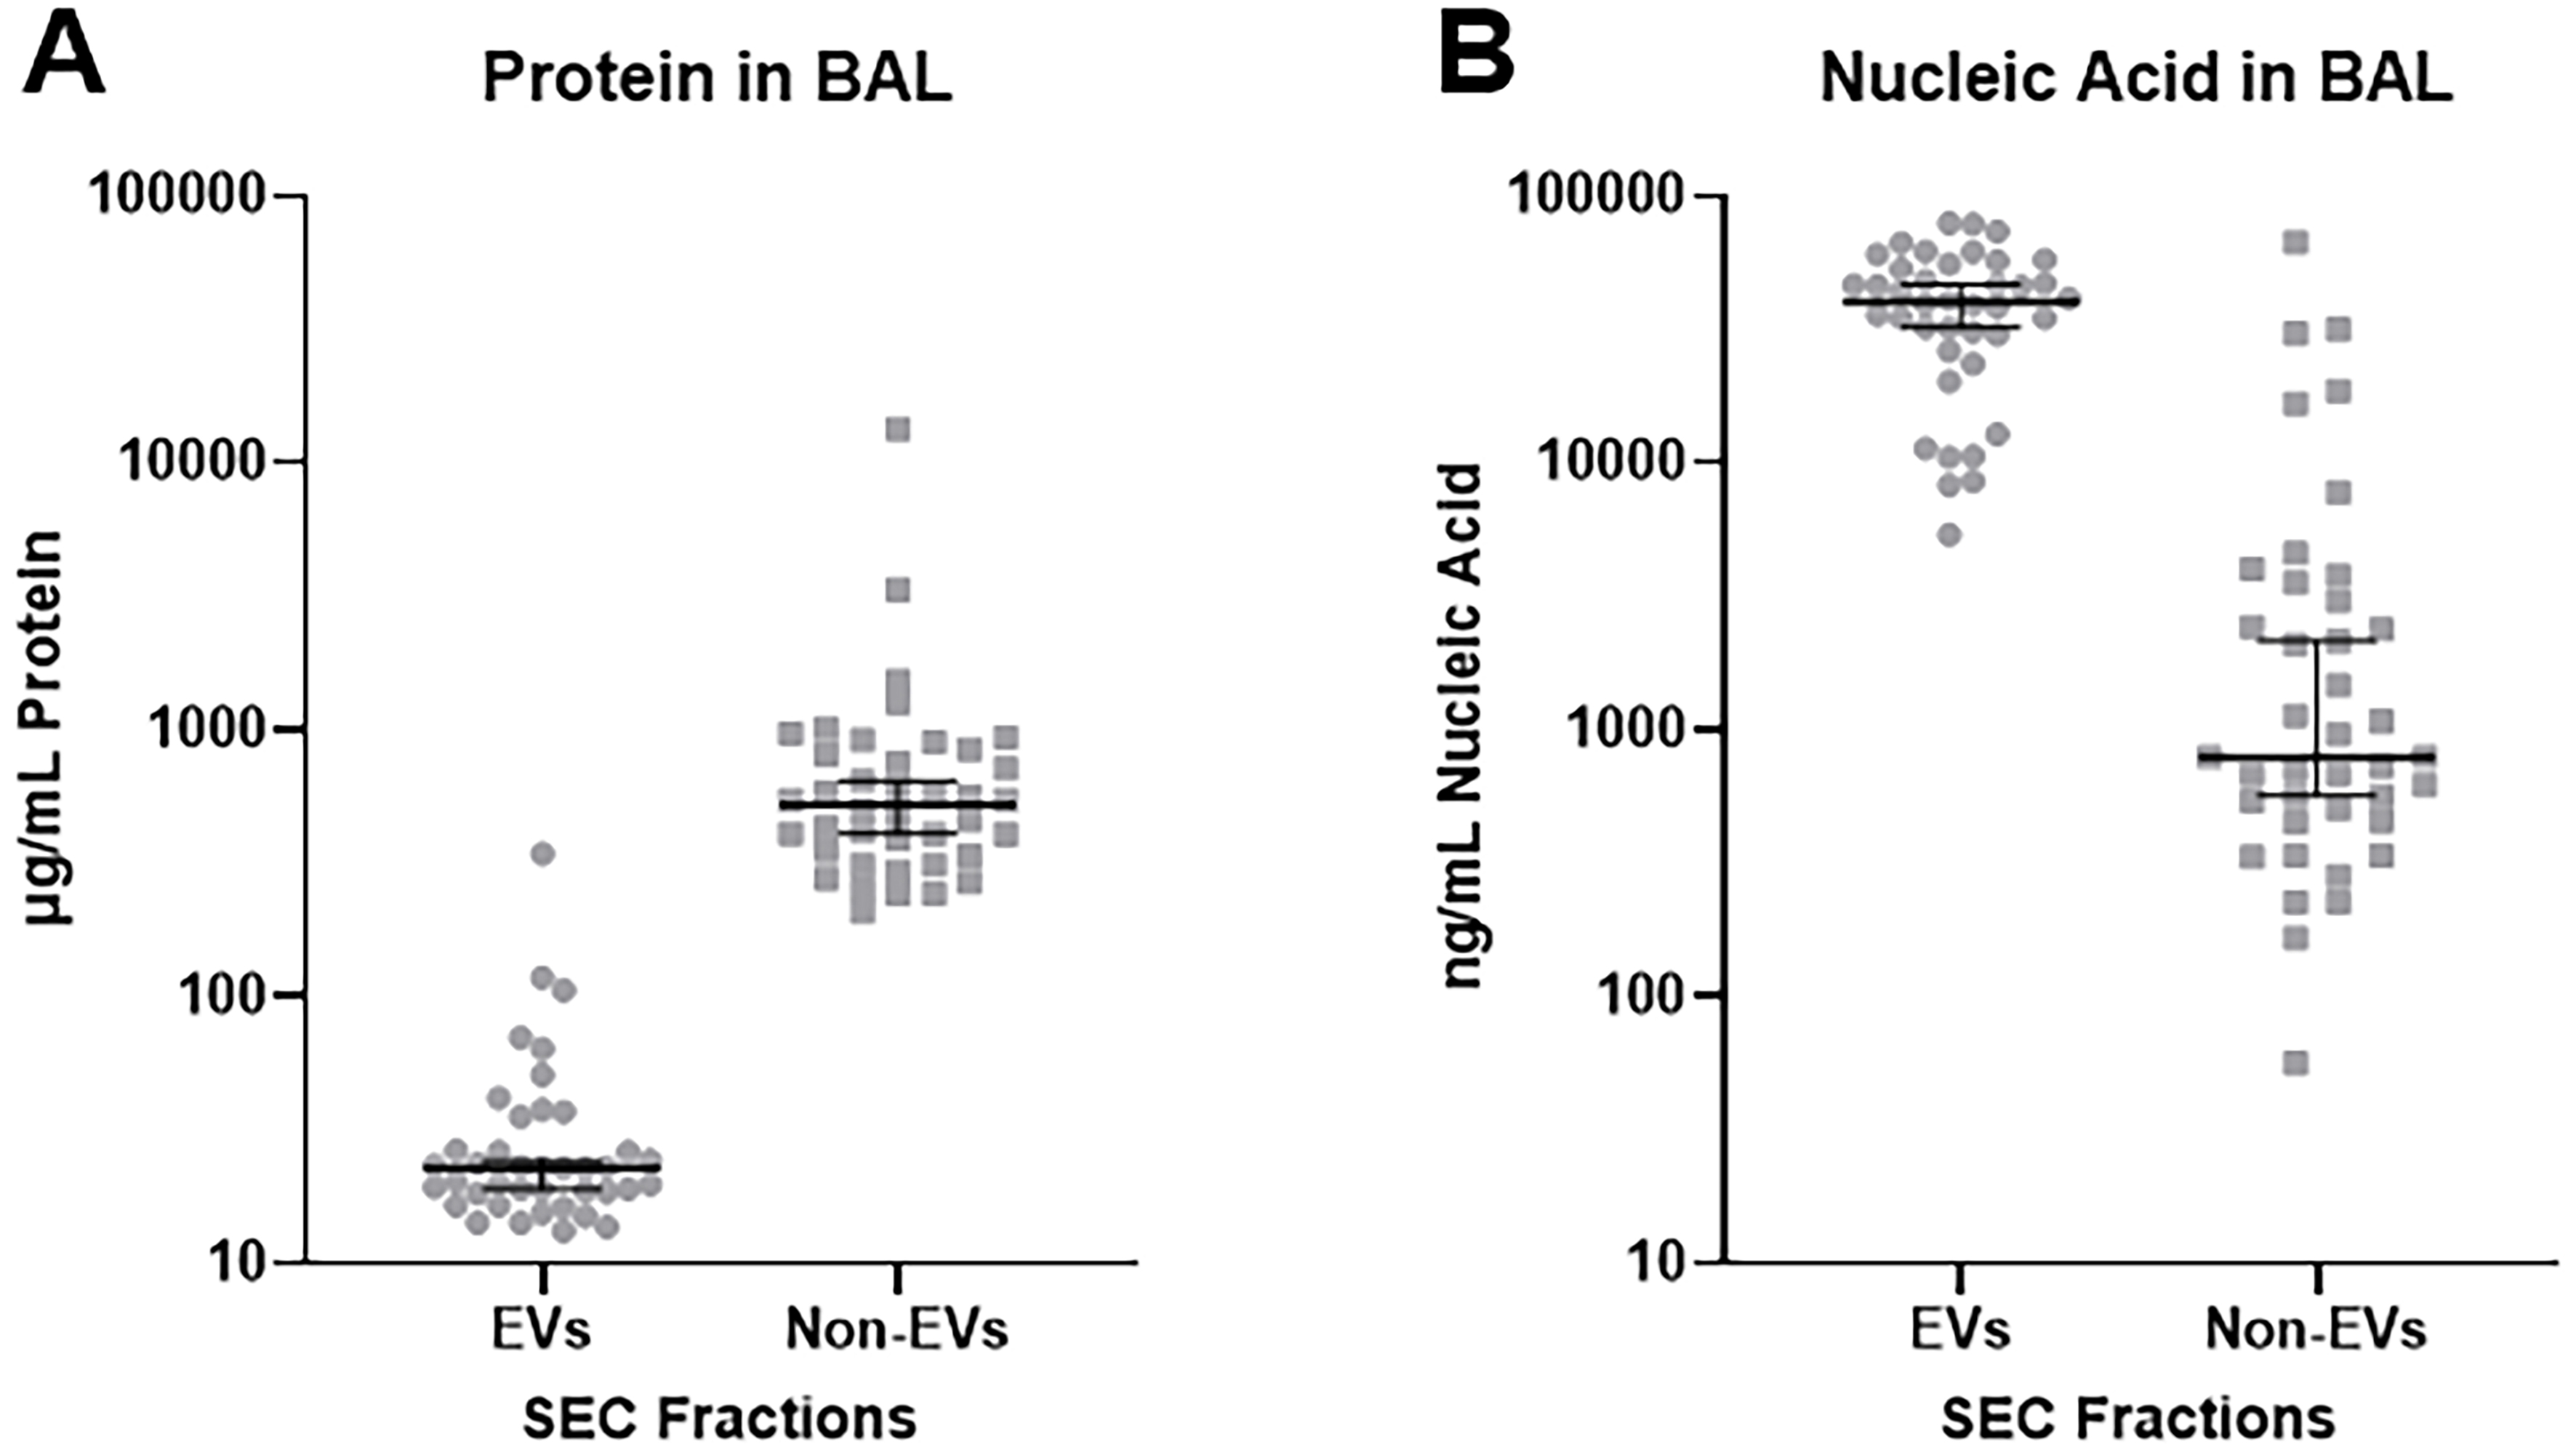
Figure 5. Total protein and nucleic acid in EV and non-EV fractions collected from SEC as determined by BCA assay and NanoDrop. (A) EVs isolated from acellular BAL contain significantly less protein than the non-EV fraction (P = 0.0009); (B) EVs isolated from acellular BAL contain significantly more nucleic acid material than the non-EV fraction (P < 0.0001). n = 40 subjects. Analysis performed using unpaired two-tailed t-test assuming equal variance. EVs: Extracellular vesicles; SEC: size exclusion chromatography; BAL: bronchoalveolar lavage; BCA: bicinchoninic acid.
Comparison of protein and nucleic acid content in EV preparations using all three isolation methods
Finally, we determined if different EV isolation methods resulted in different types of proteins and nucleic acids found in the preparations. First, we used mass spectrometry based proteomic approaches to compare proteins found in EV preparations from all three methods. The Venn diagram in Figure 6 shows that 595 proteins were identified in SEC EV preps, 730 proteins were identified in UC EV preps, and 908 proteins were identified in EE EV preps. A total of 515 proteins were found in all three preparations. Note very few proteins were uniquely found in the SEC EV prep, while many proteins were identified only in the EE prep. Table 1 shows the top 25 most abundant proteins in each preparation based on summed protein ion abundance. There is good agreement between the SEC and UC EV preparations. The EE preparation had numerous unique proteins identified which were not seen in the other two EV preps.
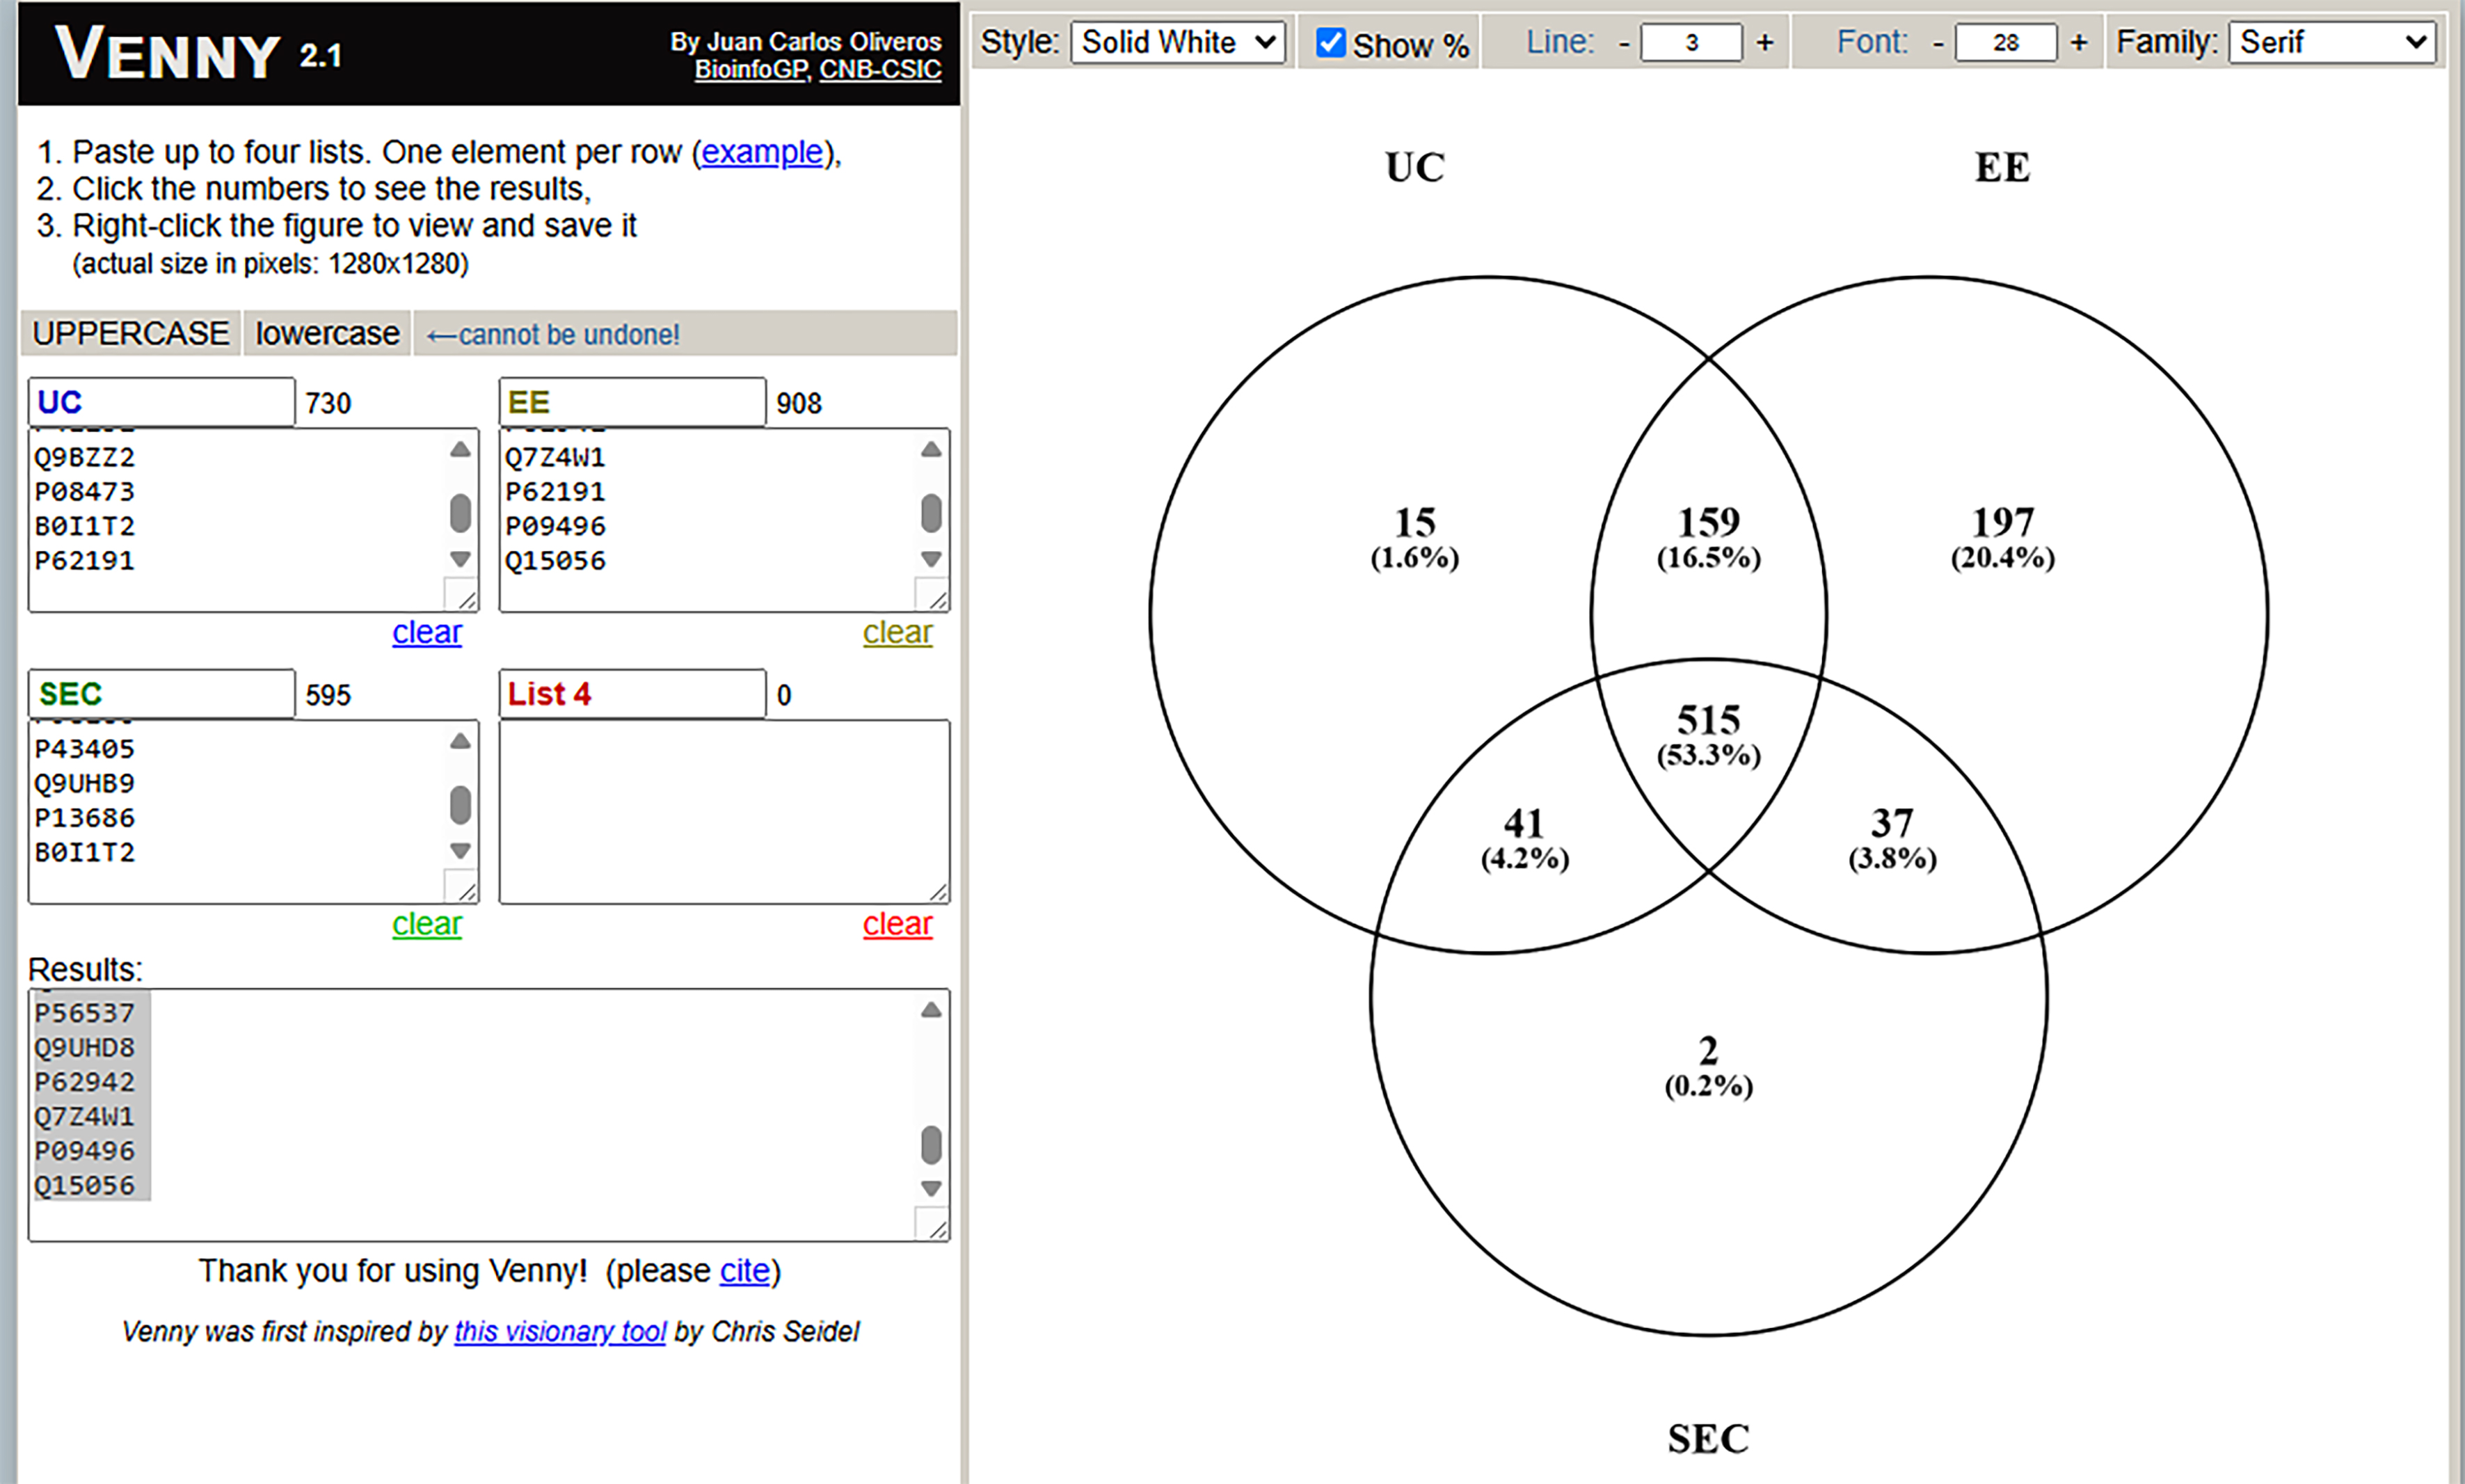
Figure 6. Venn diagram demonstrating the number of unique and overlapping proteins found in different extracellular vesicle preparations. EV preparations obtained from BAL by SEC, UC and EE from two subjects underwent bottom up label free mass spectrometry and proteins identified with high confidence and with greater than 2 unique peptides were compared across the preparations mass spectrometry. EVs: Extracellular vesicles; BAL: bronchoalveolar lavage; SEC: size exclusion chromatography; UC: ultracentrifugation; EE: exoEasy.
We also performed pathway enrichment analysis of the 515 proteins found in all three EV preparations using the STRING database 12.0 [Figure 7A]. These proteins were strongly slanted towards immunologic and inflammatory responses. This likely reflects that our cohort was made up of BALs from either HIV-infected subjects or subjects undergoing a clinical BAL to evaluate potential lung inflammation. Interestingly, pathway analysis of the 197 proteins found exclusively in the EE EV preparation [Figure 7B] were more aligned with intracellular processes like protein folding, supramolecular fiber integration, protein metabolic process, protein folding in endoplasmic reticulum (ER), regulation of cytoskeleton, and regulation of apoptotic signaling pathway. This suggests that intracellular debris and apoptotic bodies were being recovered in EE EV preparations.
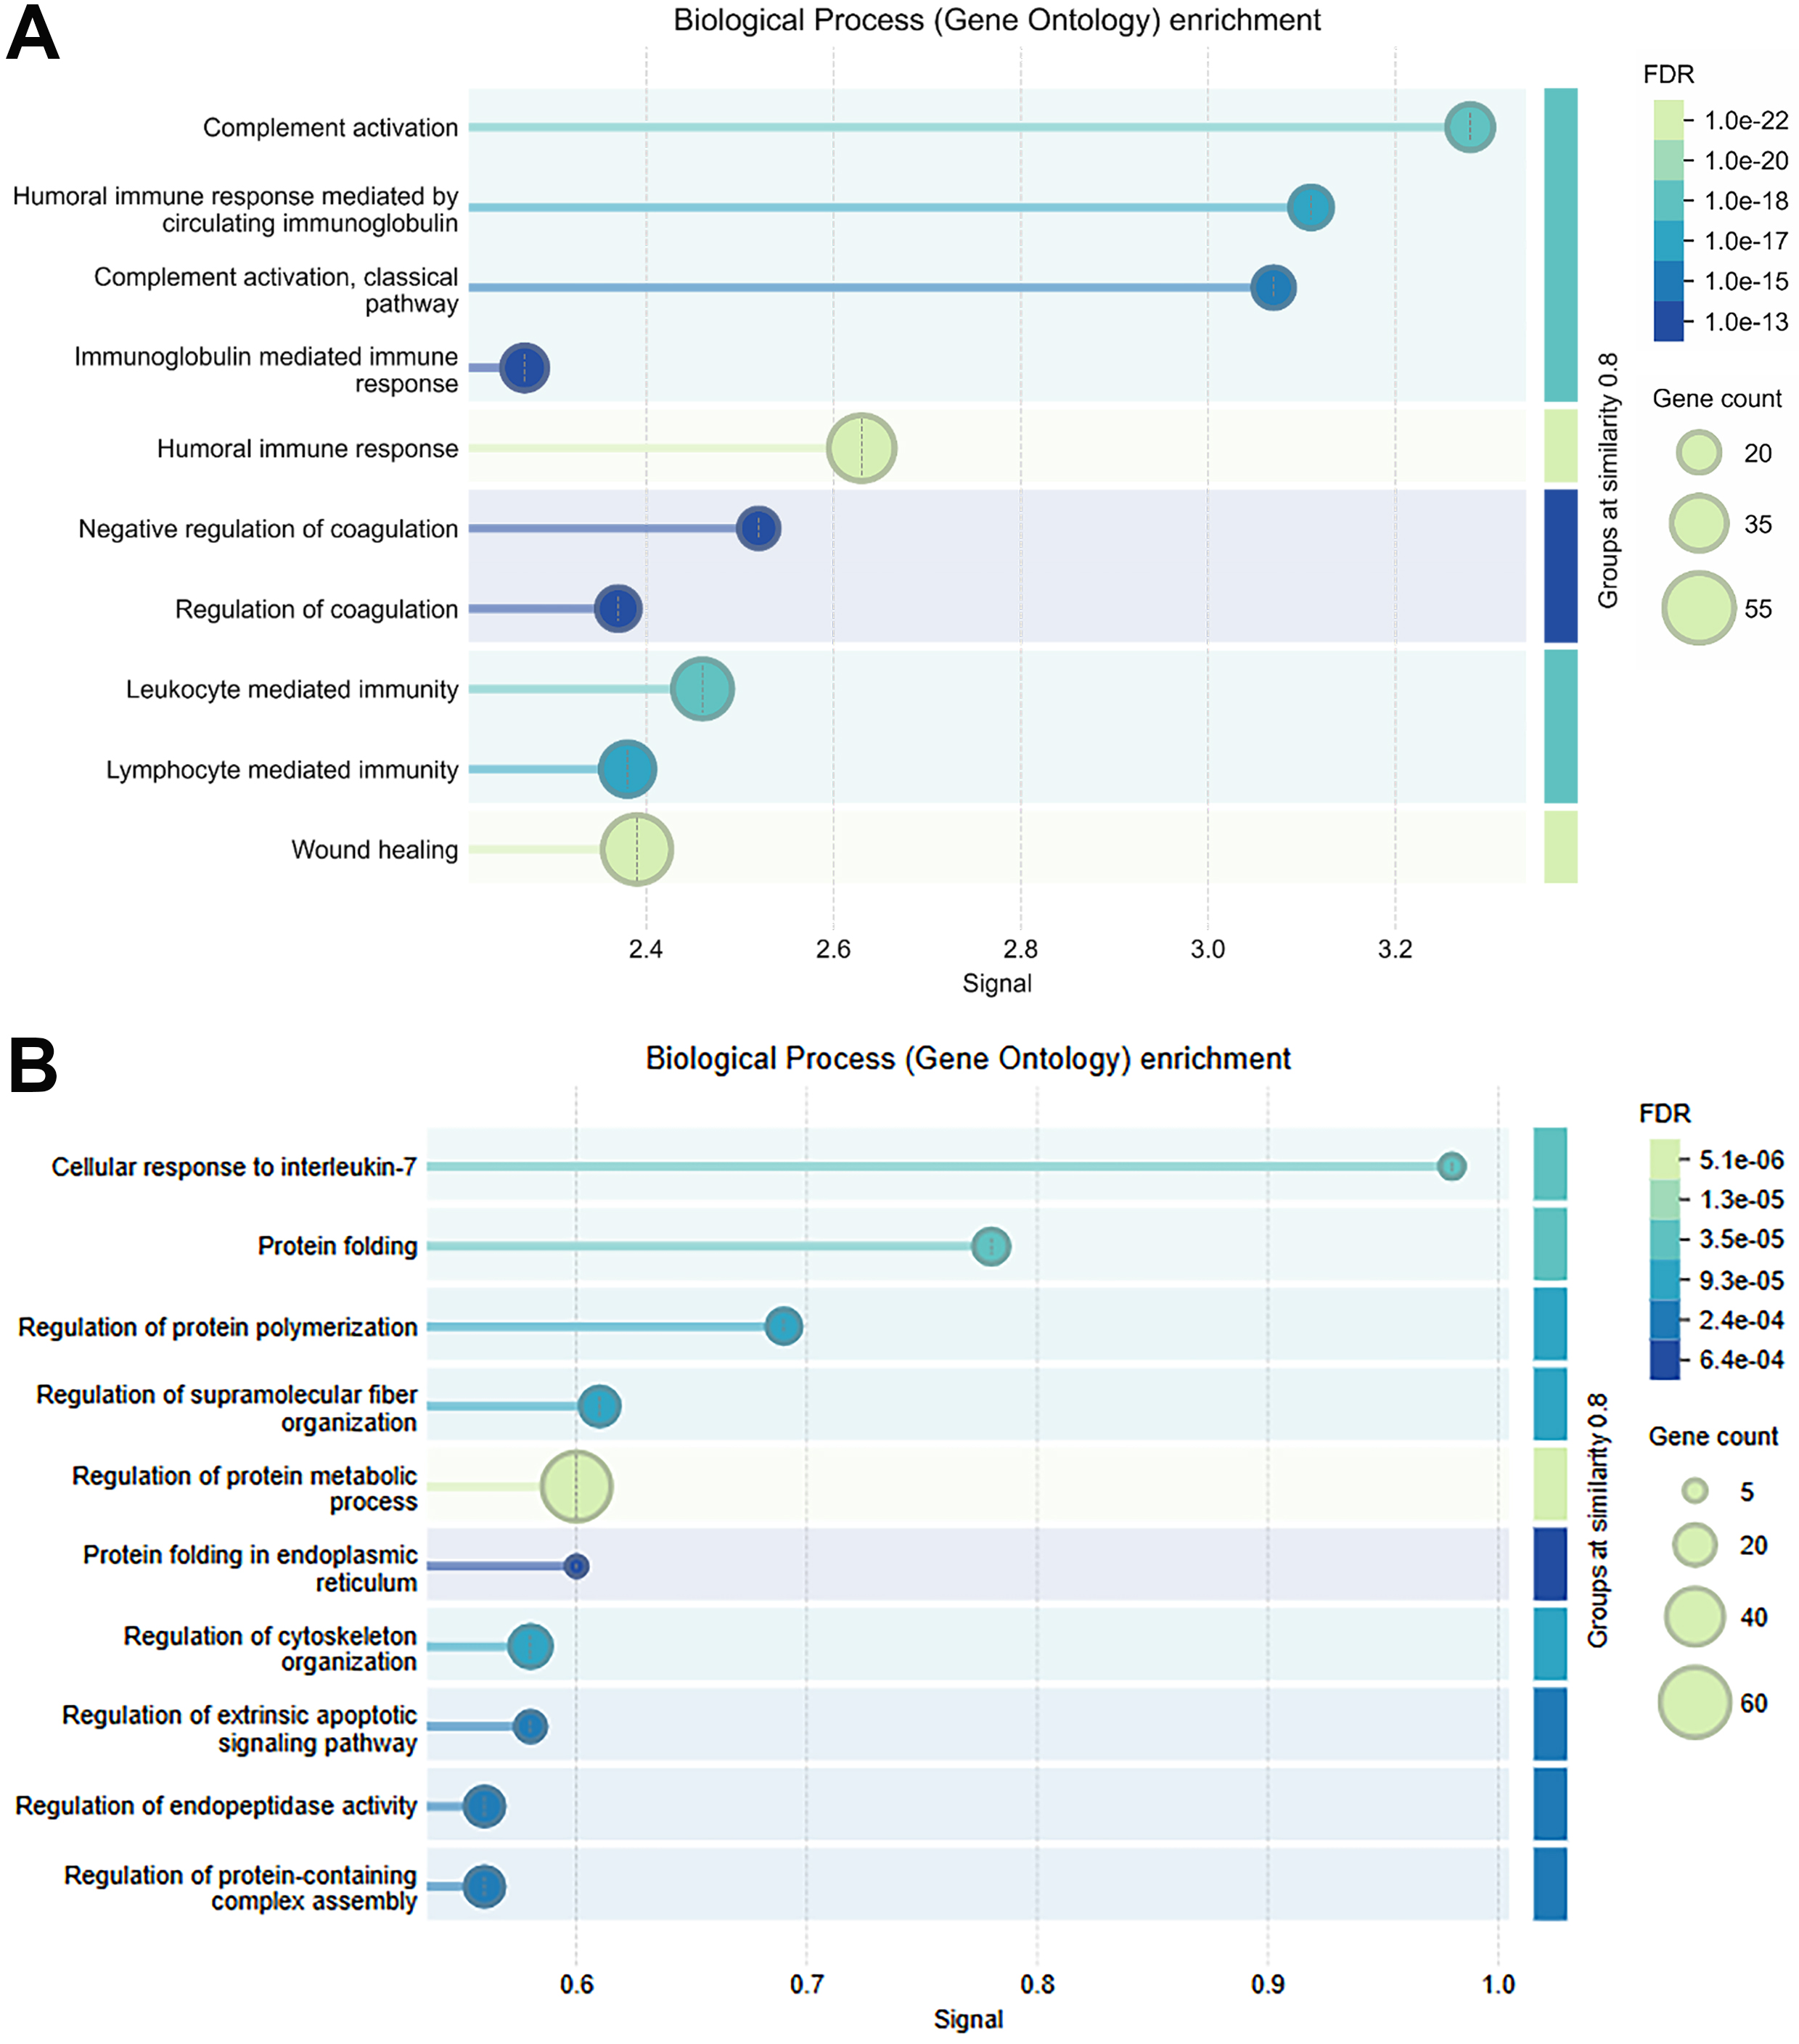
Figure 7. Summary of gene ontology enrichment analyses. Analysis was performed using the STRING 12.0 database on (A) the 515 proteins found with high confidence in all EV preparations and on (B) the 197 proteins uniquely found in the ExoEasy EV preparation. EV: Extracellular vesicle; STRING: Search Tool for the Retrieval of Interacting Genes/Proteins.
It is well known that EV preparations may also contain lipoproteins[19]. We used proteomic data to validate the presence of apolipoproteins, which bind to lipoproteins and thus serve as a good surrogate marker for lipoproteins in our EV preparations[20,21]. Table 2 demonstrates that all three EV preparations had apolipoproteins, suggesting lipoprotein recovery. However, these proteins were significantly more abundant in EE EVs as compared to UC and size exclusion chromatography preps.
Relative abundance of apolipoproteins found in EV preparations using UC, EE, and SEC
| Abundance ratios | |||
| EE/SEC | EE/UC | SEC/UC | |
| Apolipoprotein A-I | 14.207 | 15.718 | 1.056 |
| Apolipoprotein A-IV | 16.347 | 13.203 | 0.862 |
| Apolipoprotein B-100 | 5.283 | 1.153 | 0.235 |
| Apolipoprotein E | 6.593 | 5.338 | 0.735 |
| Apolipoprotein A-II | 25.031 | 10.621 | 0.506 |
| Apolipoprotein CI | 3.891 | 9.230 | 2.796 |
| Apolipoprotein C-III | 14.490 | 26.475 | 13.247 |
| Apolipoprotein D | 32.653 | 2.439 | 0.051 |
| Apolipoprotein C2 | 100.000 | 100.000 | |
| Apolipoprotein B receptor | 100.000 | 30.895 | 0.010 |
Finally, we further characterized the nucleic acids in our EV preps using a kit to distinguish RNA and dsDNA. Extracellular vesicle nucleic acid content was similar for RNA and dsDNA using all three EV isolation methods [Figure 8A], demonstrating that all three methods (including SEC) were adequate to isolate EV nucleic acids. Figure 8B further demonstrates that most of the nucleic acid in BAL was found in EVs compared to the non-EV fraction.
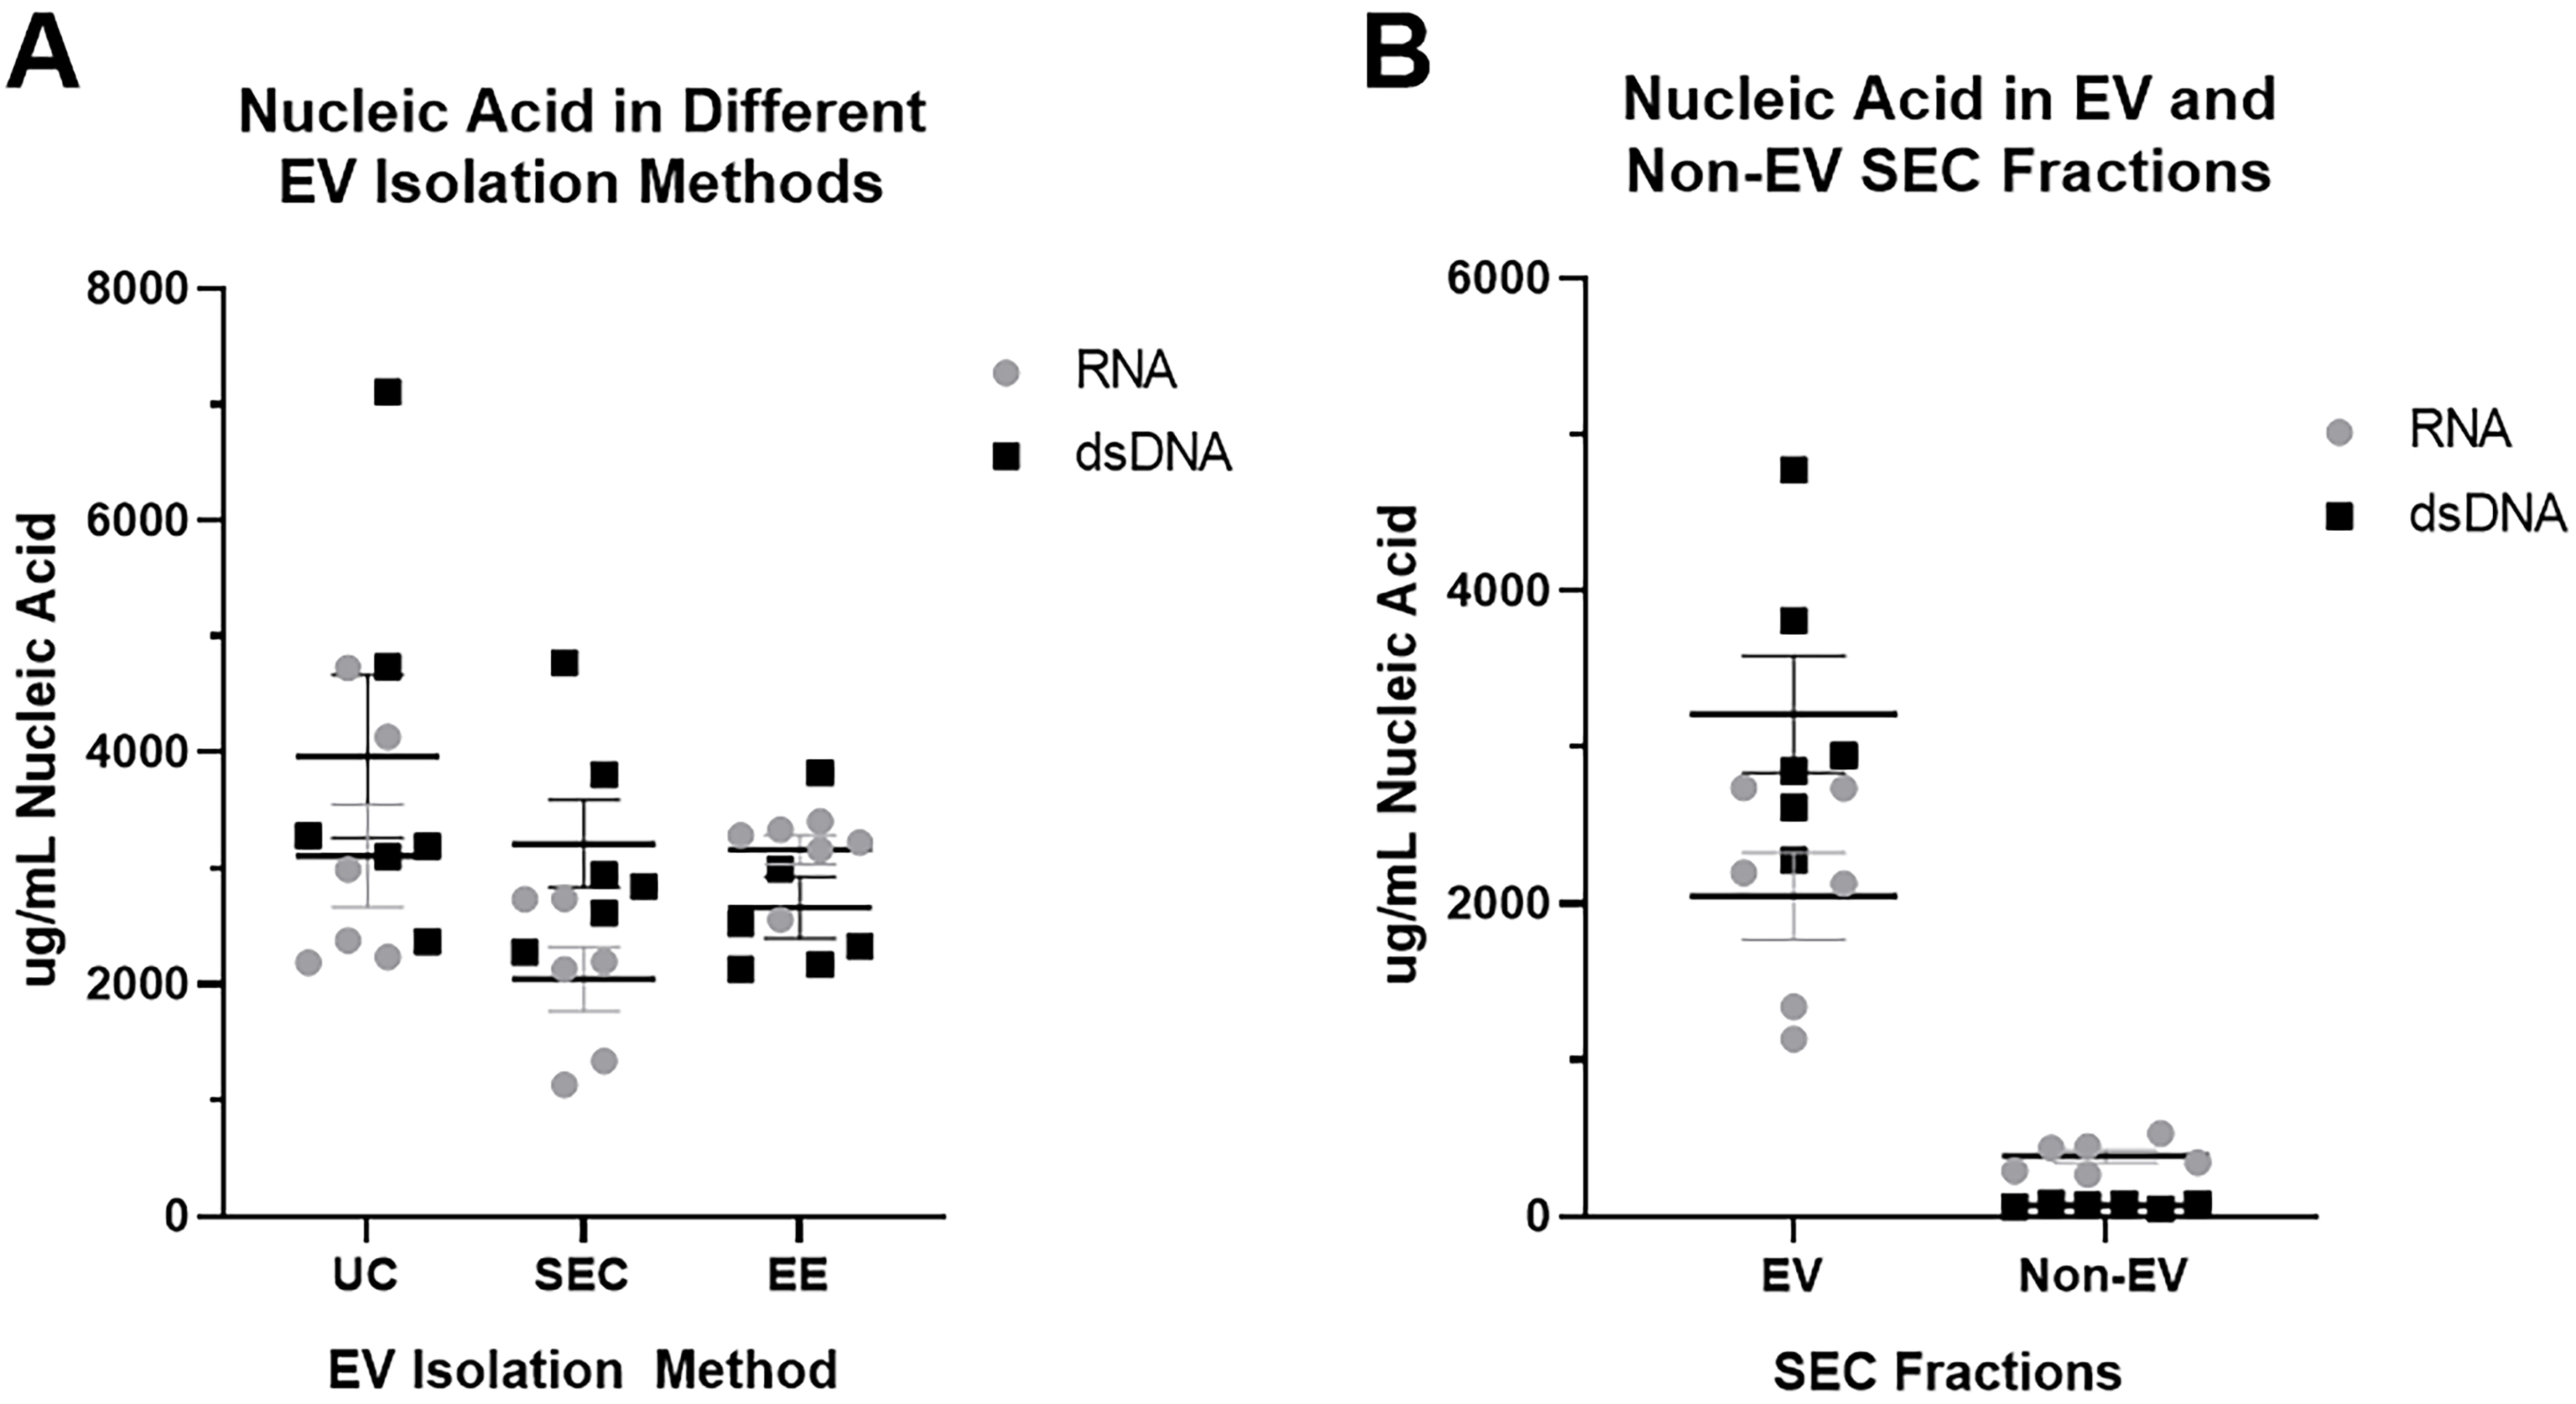
Figure 8. Measurement of RNA and dsDNA in nucleic acids isolated from extracellular vesicle preparations. EV nucleic acid content for RNA and dsDNA was measured using InvitrogenTM Quant-iTTM RNA Assay and InvitrogenTM Quant-iTTM PicoGreenTM dsDNA Assay Kits. (A) Comparison of RNA and dsDNA in EV preparations using SEC, UC, and EE; (B) Comparison of RNA and dsDNA found in the EV and non-EV fractions obtained by size exclusion chromatography. n = 2 subjects run in triplicate. EV: Extracellular vesicle; RNA: ribonucleic acid; dsDNA: double-stranded deoxyribonucleic acid; SEC: size exclusion chromatography; UC: ultracentrifugation; EE: exoEasy.
DISCUSSION
While there are many published methods to isolate EVs, each has its advantages and disadvantages[22]. UC is widely used, but has been demonstrated to have variable EV yields and has the potential to physically damage EVs[18,23-25]. Size Exclusion Chromatography[26] is quick, has a high-yield, and EV integrity is maintained through the isolation process[24]. Size exclusion does have some disadvantages. Depending on fractions collected and column used there may be non-EV contaminants. Furthermore, the final preparation is significantly diluted. These disadvantages are mitigated with the use of a concentration step[27]. Precipitation has high EV yield, but preparations contain non-EV contaminants which may prevent downstream use due to polymer formation, limiting functionality of EVs[28-31]. Immunocapture can yield pure, but low yield EV populations and does not isolate all EVs[32,33]. Ultrafiltration is easy to perform and can be combined with other methods, but has variable yield and composition[34,35]. Field-flow fractionation can separate EVs into subset fractions, but can not be utilized as a standalone method[22]. Microfluidics can isolate EVs from small samples and isolate subpopulations, but is not suitable for preparative purposes, limiting downstream use and application[36]. Finally, membrane affinity binding can be used to isolate all EVs, but cannot discriminate between EVs and cell membrane fragments or apoptotic bodies[22].
In this work, our aim was to determine the best way to isolate EVs from BAL, which has the additional confounding property of being an inherently dilute biological specimen[6]. Our goals were to identify a method that yields high EV quantities from dilute starting material, produce preparations with minimal free protein contamination, and maintain EV structural integrity for downstream applications. With these goals in mind, we chose to compare three distinct methods of EV isolation: membrane-based affinity chromatography (EE), standard UC, and size exclusion chromatography coupled with various concentration steps. Our results demonstrate that SEC, while not always yielding the highest quantities, provides final preparations that have the least free protein contamination and maintain the structural integrity of the EVs. This method also allows one to directly compare compounds of interest in EV and non-EV fractions. Analysis of protein and nucleic acid contents in EV and non-EV fractions are highly consistent and predictable. As expected, most protein in BAL was found in the non-EV fraction, consistent with the known abundance of free protein, especially albumin and immunoglobulins, in BAL fluid[37,38]. In contrast, our results add to that of other investigators[39] demonstrating that the bulk of nucleic acids in BAL are found in EVs, which serves as a protected environment against RNAses and DNAses found in most biological specimens[40].
Isolation of EVs from biologic specimens requires careful consideration of sample preparation before, during, and after EV isolation. Prior to isolating EVs, one must first remove large subcellular debris, organelles, and apoptotic bodies. We found that passing the specimen through a 0.65 μm syringe filter yielded higher EV loads compared to centrifugation at 10,000 g for 40 min prior to SEC column loading. During isolation of EVs from the SEC column, prior publications suggested that fractions 1-5 or 2-5 should be collected to maximize EV yield[41,42]. From our Nanosight data, fraction 1 had the second highest concentration of particles, and excluding this fraction would decrease yield significantly as well as possibly exclude the microvesicle population of vesicles. Our results verified that the majority of particles detected by Nanosight are contained within these fractions and to maximize yield, fractions 1-6 can be collected with minimal contaminating protein as determined by BCA Assay. Finally, after collecting the EV fractions, concentration of the large elution volume is necessary. Our results indicate that use of a 30 kDa Amicon filter to concentrate EV fractions had the best yield, which is similar to results published previously[43]. Use of larger filters likely results in loss of EVs in the filter[44]. Use of the smaller 10 kDa filter lead to an increase in protein which probably represents non-vesicular protein that was left in the later EV fractions and may decrease the EV purity. Using the 30 kDa filter to concentrate EV fractions yields the most EVs, while not introducing significantly increased extravesicular protein.
EE columns, while yielding the highest particle count and total protein, did so inconsistently and were not reproducible from sample to sample. In addition, there was a high amount of background protein in the BCA assay. This was further demonstrated by proteomic analysis, where EE preparations contained a large number of unique proteins. This may be an artifact of the affinity columns themselves (along with the increased particle count), or a result of non-specific binding of free protein or protein aggregate to the columns. UC also consistently yielded high particle counts as well as EV specific tetraspanins, but when visualized under transmission electron microscopy (TEM) (both when equivalent volume and when standardized to measured particle count), the SEC method had higher numbers of EVs as well as less background material that does not appear to be EVs. This background material likely explains the increase in total protein, tetraspanin staining on Western blot, and Nanosight counts in UC preparations. Given these findings, particle counts by Nanosight and tetraspanin antibody assays may overestimate the number of particles contained in EV samples isolated by UC[12], especially in other biological samples that are not as dilute as BAL fluid.
Finally, certain EV isolation techniques may preferentially isolate some EVs, leading to differences in protein and nucleic acid composition of the final preparations. Interestingly, all three isolation methods studied yielded similar nucleic acid concentrations. This is likely because virtually all nucleic acids are found in protected EV environments. This is especially true in the lung, where RNAses and DNAses are prevalent to clear unwanted viscous nucleic acids[45,46]. In contrast, the proteins detected in the EV preps varied, which partially reflects varying levels of free protein contamination. EE had the highest amount of protein in EV preps, including many unique proteins not found in SEC or UC extracellular vesicle preparations. Pathway enrichment analysis suggested these excess proteins were from a different source than EVs, primarily reflecting intracellular processes found in cells undergoing stress and apoptosis. In contrast, gene ontology analysis of proteins found in all three EV preparations was highly enriched for immune and inflammatory processes, which would be expected based on the sources of BAL used in this study. Even lipoproteins, which are known to contaminate EV preparations[19], were significantly more abundant in EE EV preparations.
There are limitations to our study. First, most of the BAL samples used were banked fluid from either patients undergoing clinically indicated bronchoscopy or from HIV-infected subjects participating in a study. While this does not diminish our isolation technique comparisons, since each BAL was processed using all three EV isolation methods, the proteomic analysis of the EVs did demonstrate an underlying inflammatory profile. This should not be interpreted as representative of BAL EVs from normal subjects. Furthermore, as inflammatory conditions are known to increase the generation of EVs[47], EV yield from normal BAL may be lower than in our subjects. Finally, there are other EV isolation techniques we did not utilize in our study. While we speculated on the limitations of these other techniques, direct comparison with size exclusion chromatography was not performed. Thus, conclusions about the superiority of SEC over techniques not studied in this work should be tempered until direct comparisons are made.
In conclusion, our study demonstrates that size exclusion chromatography is an excellent method to isolate EVs from bronchoalveolar lavage [Figure 9]. Samples prepared in this manner yield reproducible, high quantities of structurally intact, purified EVs with minimal extravesicular protein contamination.
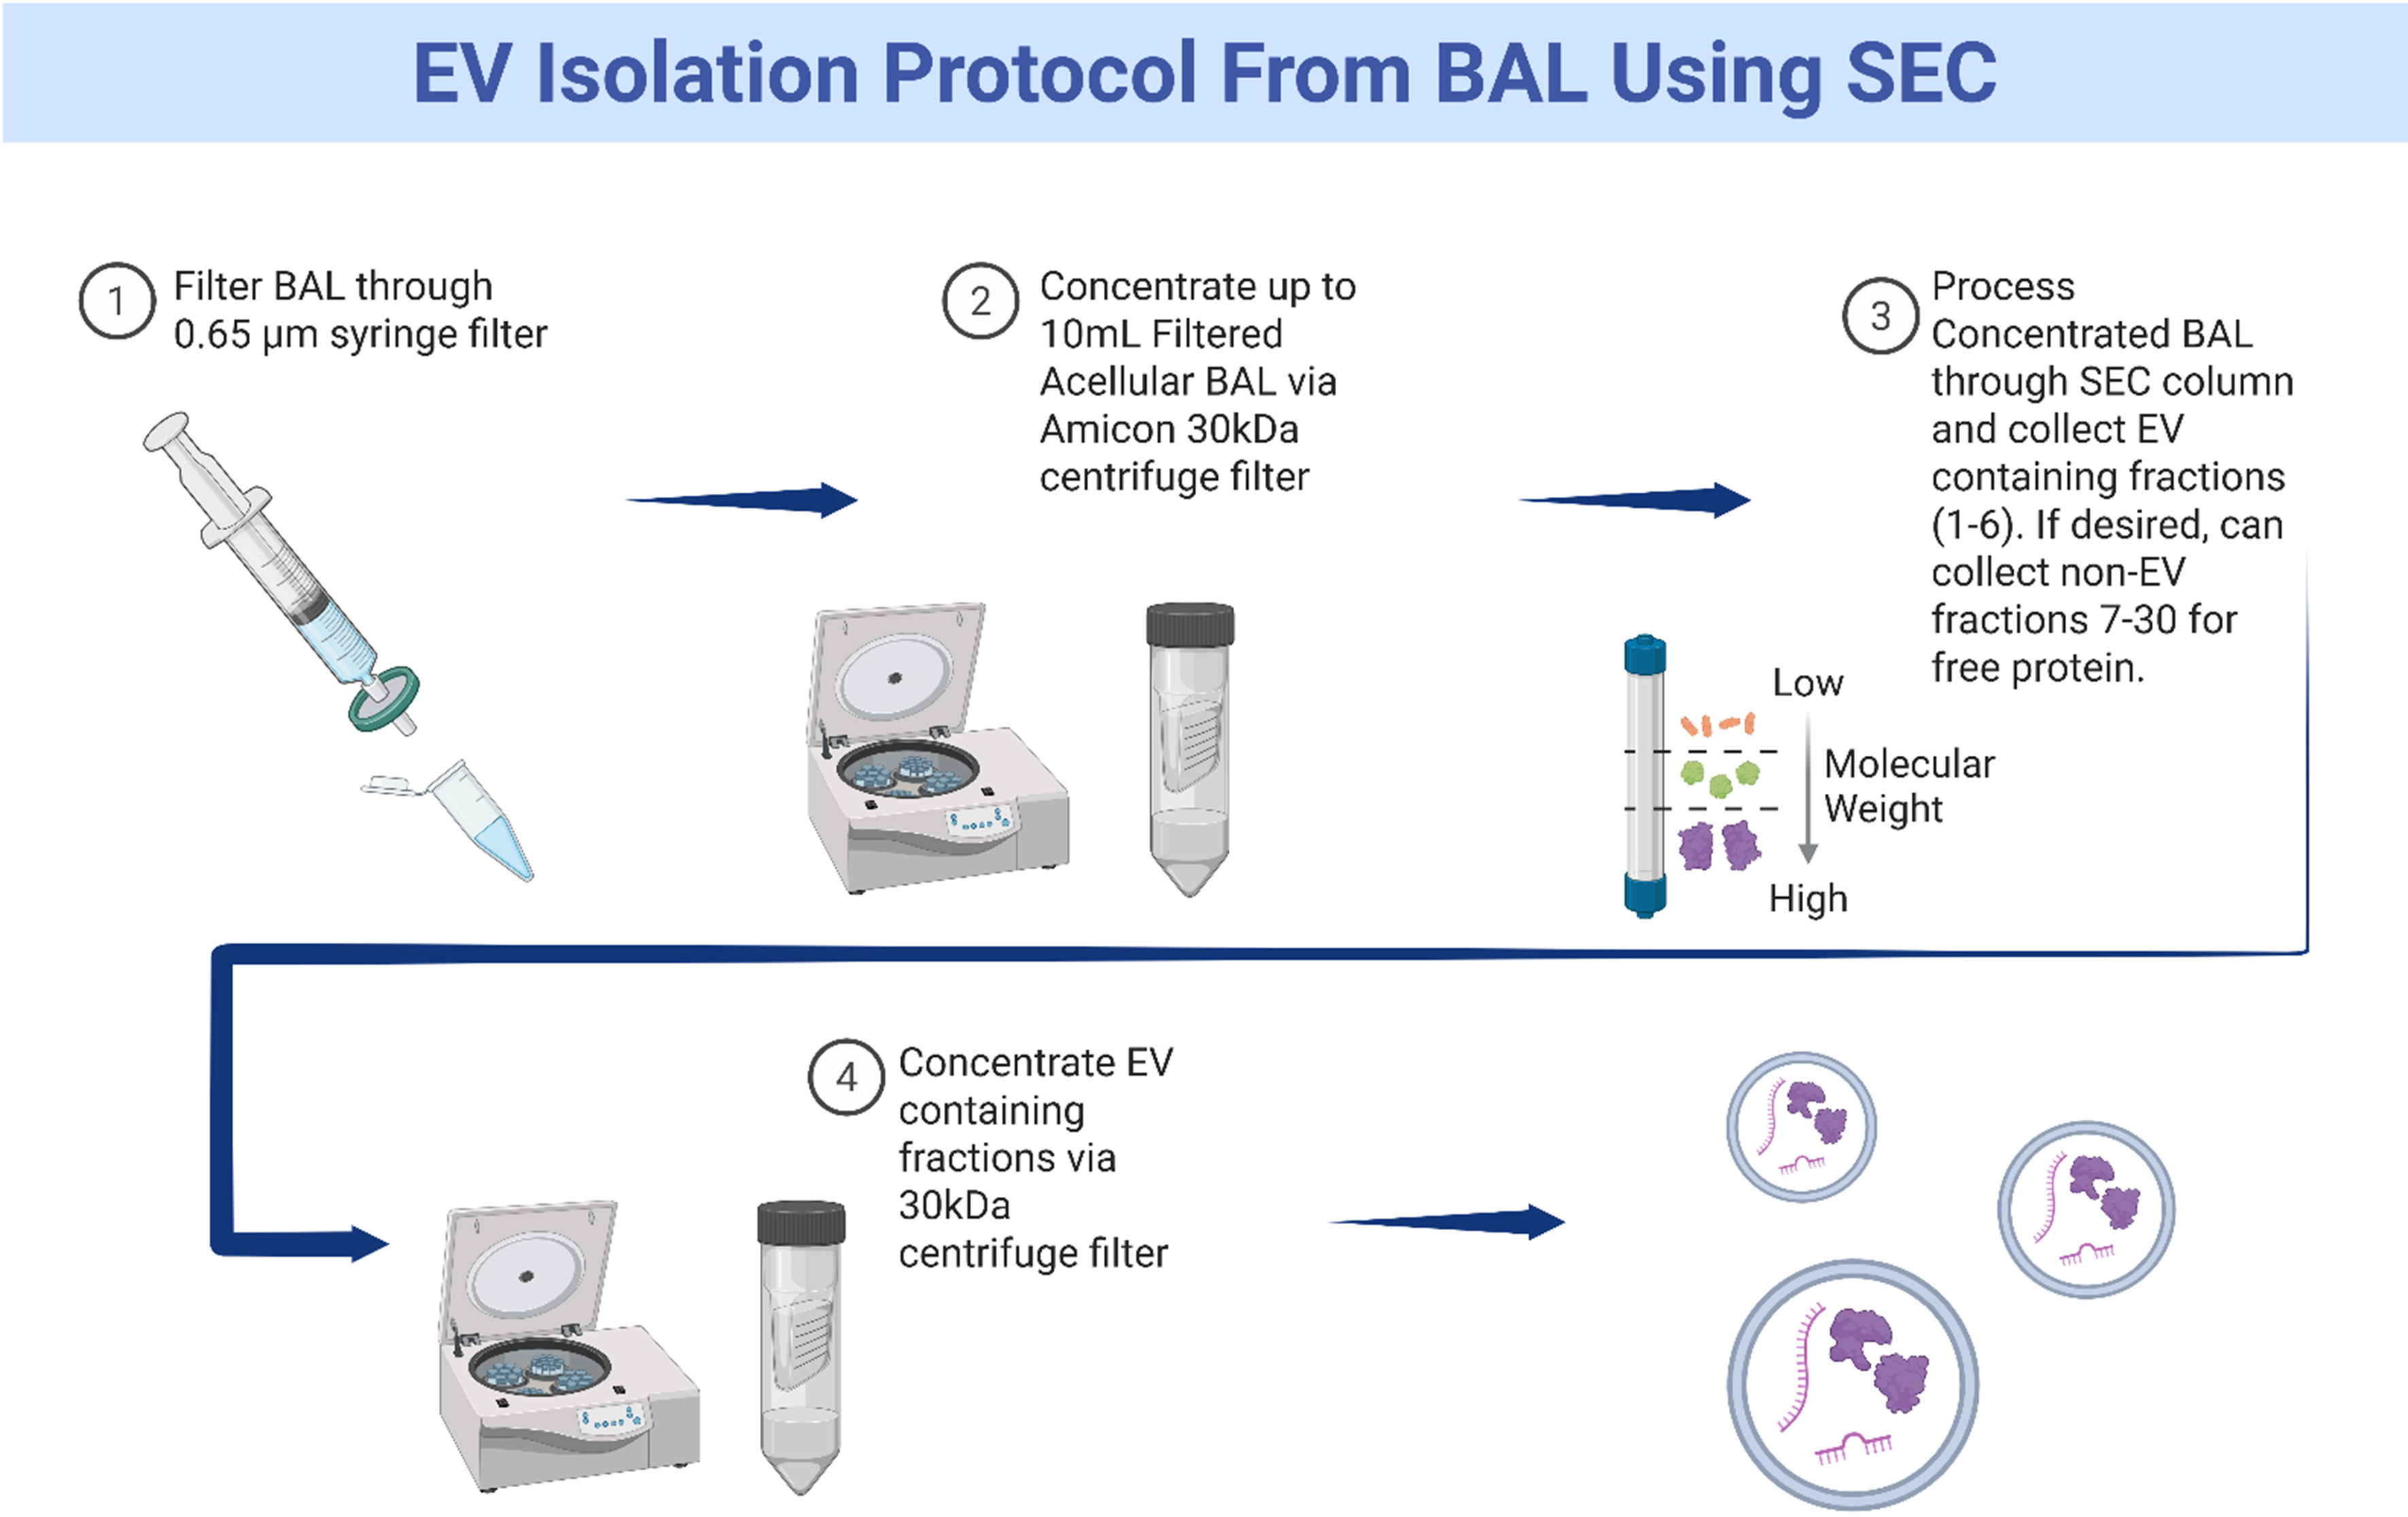
Figure 9. Graphical representation of method to isolate extracellular vesicles from bronchoalveolar lavage fluid. Created in BioRender. Fraser, M. (2026) https://BioRender.com/hjrs8dq. EV: Extracellular vesicle; BAL: bronchoalveolar lavage; SEC: size exclusion chromatography.
DECLARATIONS
Acknowledgements
The Graphic Abstract was created in BioRender. Fraser, M. (2026) (https://BioRender.com/ofpb2fe).
Authors’ contributions
Performance of all EV isolation protocols, nucleic acid analysis, writing: Fraser ME
Isolation and quantification of EVs, protein assays: Patel R, Shinabery T
Development of EV assessment tools: Zagorski J
Electron microscopy: Chen L, Dhillon NK
Development of EV protocols and assessment tools: Clauss M
Proteomics, writing: Doud EH, Mosley AL
Western blotting, funding support, writing: Gaston B
Conceptualization and oversight of project, funding, writing: Twigg HL III
All contributors have provided consent for publication.
Availability of data and materials
Data is available from the senior author on request. In addition, per the Data Management and Sharing Plan for this project, data will be available in NHLBI BioData Catalyst.
AI and AI-assisted tools statement
Not applicable.
Financial support and sponsorship
This work was funded by the National Institutes of Health under grants R01 HL 168579 (HLT), R01 HL152832 (NKD), R01 HL154859 (MC), and P01 HL 158507 (BG). Mass spectrometry performed in this work was done by the Indiana University School of Medicine Center for Proteome Analysis. Acquisition of the IUSM Center for Proteome Analysis instrumentation used for this project was provided by the Indiana University Precision Health Initiative. The proteomics funded, in part, by NIH grants supporting the Indiana Clinical and Translational Sciences Institute (UL1TR002529) and the P30 IU Simon Comprehensive Cancer Center Support Grant (P30CA082709).
Conflicts of interest
Dhillon NK is an Editorial Board Member of the journal Extracellular Vesicles and Circulating Nucleic Acids. Dhillon NK was not involved in any steps of the editorial process, including reviewers’ selection, manuscript handling, and decision-making. The other authors declare that there are no conflicts of interest.
Ethical approval and consent to participate
The subject material used in this manuscript came from two IRB approved studies: Genomic Analysis of Immunity and Lung Inflammation in HIV Infection (IRB number 1401371742) and Trafficking of Cells in Lung Inflammation (IRB number 1011003397). All patients who have obtained knowledge and consent.
Consent for publication
Not applicable.
Copyright
© The Author(s) 2026.
REFERENCES
1. Welsh JA, Goberdhan DC, O’Driscoll L, Théry C, Witwer KW. MISEV2023: an updated guide to EV research and applications. J Extracell Vesicles. 2024;13:e12416.
2. Dlugolecka M, Szymanski J, Zareba L, et al. Characterization of extracellular vesicles from bronchoalveolar lavage fluid and plasma of patients with lung lesions using fluorescence nanoparticle tracking analysis. Cells. 2021;10:3473.
3. Colombo SAP, Brown SL, Hepworth MR, et al. Comparative phenotype of circulating versus tissue immune cells in human lung and blood compartments during health and disease. Discov Immunol. 2023;2:kyad009.
4. Patel PH, Antoine MH, Sankari A, Ullah S. Bronchoalveolar Lavage. Available from: https://www.ncbi.nlm.nih.gov/books/NBK430762/. [Last accessed on 3 Apr 2026].
5. Rennard SI, Basset G, Lecossier D, et al. Estimation of volume of epithelial lining fluid recovered by lavage using urea as marker of dilution. J Appl Physiol. 1986;60:532-8.
6. Haeger S, Moore CM, McManus SA, Moore PK, Janssen WJ, Mould KJ. The bronchoalveolar lavage dilution conundrum: an updated view on a long-standing problem. Am J Physiol Lung Cell Mol Physiol. 2024;327:L807-13.
7. Gotoh T, Ueda S, Nakayama T, Takishita Y, Yasuoka S, Tsubura E. Protein components of bronchoalveolar lavage fluids from non-smokers and smokers. Eur J Respir Dis. 1983;64:369-77.
8. Nguyen EV, Gharib SA, Schnapp LM, Goodlett DR. Shotgun MS proteomic analysis of bronchoalveolar lavage fluid in normal subjects. Proteomics Clin Appl. 2014;8:737-47.
9. Carnino JM, Lee H, Jin Y. Isolation and characterization of extracellular vesicles from Broncho-alveolar lavage fluid: a review and comparison of different methods. Respir Res. 2019;20:240.
10. Momen-Heravi F, Balaj L, Alian S, et al. Current methods for the isolation of extracellular vesicles. Biol Chem. 2013;394:1253-62.
11. Smith PA, Kohli LM, Wood KL, Hage CA, Twigg HL 3rd, Knox KS. Cytometric analysis of BAL T cells labeled with a standardized antibody cocktail correlates with immunohistochemical staining. Cytometry B Clin Cytom. 2006;70:170-8.
12. Bachurski D, Schuldner M, Nguyen PH, et al. Extracellular vesicle measurements with nanoparticle tracking analysis - an accuracy and repeatability comparison between NanoSight NS300 and ZetaView. J Extracell Vesicles. 2019;8:1596016.
13. Filipe V, Hawe A, Jiskoot W. Critical evaluation of nanoparticle tracking analysis (NTA) by NanoSight for the measurement of nanoparticles and protein aggregates. Pharm Res. 2010;27:796-810.
14. Krishnamachary B, Cook C, Kumar A, Spikes L, Chalise P, Dhillon NK. Extracellular vesicle-mediated endothelial apoptosis and EV-associated proteins correlate with COVID-19 disease severity. J Extracell Vesicles. 2021;10:e12117.
15. Mosley AL, Sardiu ME, Pattenden SG, Workman JL, Florens L, Washburn MP. Highly reproducible label free quantitative proteomic analysis of RNA polymerase complexes. Mol Cell Proteomics. 2011;10:M110.000687.
16. Grecco GG, Haggerty DL, Doud EH, et al. A multi-omic analysis of the dorsal striatum in an animal model of divergent genetic risk for alcohol use disorder. J Neurochem. 2021;157:1013-31.
17. Szklarczyk D, Kirsch R, Koutrouli M, et al. The STRING database in 2023: protein-protein association networks and functional enrichment analyses for any sequenced genome of interest. Nucleic Acids Res. 2023;51:D638-46.
18. Linares R, Tan S, Gounou C, Arraud N, Brisson AR. High-speed centrifugation induces aggregation of extracellular vesicles. J Extracell Vesicles. 2015;4:29509.
19. Sódar BW, Kittel Á, Pálóczi K, et al. Low-density lipoprotein mimics blood plasma-derived exosomes and microvesicles during isolation and detection. Sci Rep. 2016;6:24316.
20. Davidsson P, Hulthe J, Fagerberg B, Camejo G. Proteomics of apolipoproteins and associated proteins from plasma high-density lipoproteins. Arterioscler Thromb Vasc Biol. 2010;30:156-63.
21. Ma Z, Zhong J, Tu W, Li S, Chen J. The functions of apolipoproteins and lipoproteins in health and disease. Mol Biomed. 2024;5:53.
22. Stam J, Bartel S, Bischoff R, Wolters JC. Isolation of extracellular vesicles with combined enrichment methods. J Chromatogr B Analyt Technol Biomed Life Sci. 2021;1169:122604.
23. De Sousa KP, Rossi I, Abdullahi M, Ramirez MI, Stratton D, Inal JM. Isolation and characterization of extracellular vesicles and future directions in diagnosis and therapy. Wiley Interdiscip Rev Nanomed Nanobiotechnol. 2023;15:e1835.
24. Guan S, Yu H, Yan G, Gao M, Sun W, Zhang X. Characterization of urinary exosomes purified with size exclusion chromatography and ultracentrifugation. J Proteome Res. 2020;19:2217-25.
25. Mol EA, Goumans MJ, Doevendans PA, Sluijter JPG, Vader P. Higher functionality of extracellular vesicles isolated using size-exclusion chromatography compared to ultracentrifugation. Nanomedicine. 2017;13:2061-5.
26. Monguió-Tortajada M, Gálvez-Montón C, Bayes-Genis A, Roura S, Borràs FE. Extracellular vesicle isolation methods: rising impact of size-exclusion chromatography. Cell Mol Life Sci. 2019;76:2369-82.
27. Koh YQ, Almughlliq FB, Vaswani K, Peiris HN, Mitchell MD. Exosome enrichment by ultracentrifugation and size exclusion chromatography. Front Biosci. 2018;23:865-74.
28. Gámez-Valero A, Monguió-Tortajada M, Carreras-Planella L, Franquesa Ml, Beyer K, Borràs FE. Size-exclusion chromatography-based isolation minimally alters extracellular vesicles’ characteristics compared to precipitating agents. Sci Rep. 2016;6:33641.
29. Konoshenko MY, Lekchnov EA, Vlassov AV, Laktionov PP. Isolation of extracellular vesicles: general methodologies and latest trends. Biomed Res Int. 2018;2018:8545347.
30. Macías M, Rebmann V, Mateos B, et al. Comparison of six commercial serum exosome isolation methods suitable for clinical laboratories. Effect in cytokine analysis. Clin Chem Lab Med. 2019;57:1539-45.
31. Serrano-Pertierra E, Oliveira-Rodríguez M, Rivas M, et al. Characterization of plasma-derived extracellular vesicles isolated by different methods: a comparison study. Bioengineering. 2019;6:8.
32. Kowal J, Arras G, Colombo M, et al. Proteomic comparison defines novel markers to characterize heterogeneous populations of extracellular vesicle subtypes. Proc Natl Acad Sci U S A. 2016;113:E968-77.
33. Skoczylas Ł, Gawin M, Fochtman D, Widłak P, Whiteside TL, Pietrowska M. Immune capture and protein profiling of small extracellular vesicles from human plasma. Proteomics. 2024;24:e2300180.
34. Lobb RJ, Becker M, Wen SW, et al. Optimized exosome isolation protocol for cell culture supernatant and human plasma. J Extracell Vesicles. 2015;4:27031.
35. Rood IM, Deegens JK, Merchant ML, et al. Comparison of three methods for isolation of urinary microvesicles to identify biomarkers of nephrotic syndrome. Kidney Int. 2010;78:810-6.
36. Wu M, Chen C, Wang Z, et al. Separating extracellular vesicles and lipoproteins via acoustofluidics. Lab Chip. 2019;19:1174-82.
37. Kim KJ, Malik AB. Protein transport across the lung epithelial barrier. Am J Physiol Lung Cell Mol Physiol. 2003;284:L247-59.
38. Reynolds HY. Immunoglobulin G and its function in the human respiratory tract. Mayo Clin Proc. 1988;63:161-74.
39. Tsering T, Nadeau A, Wu T, Dickinson K, Burnier JV. Extracellular vesicle-associated DNA: ten years since its discovery in human blood. Cell Death Dis. 2024;15:668.
40. Lu L, Li J, Moussaoui M, Boix E. Immune modulation by human secreted RNases at the extracellular space. Front Immunol. 2018;9:1012.
41. Fernández-Rhodes M, Adlou B, Williams S, et al. Defining the influence of size-exclusion chromatography fraction window and ultrafiltration column choice on extracellular vesicle recovery in a skeletal muscle model. J Extracell Biol. 2023;2:e85.
42. Ter-Ovanesyan D, Norman M, Lazarovits R, et al. Framework for rapid comparison of extracellular vesicle isolation methods. Elife. 2021;10:e70725.
43. Ji X, Huang S, Zhang J, et al. A novel method of high-purity extracellular vesicle enrichment from microliter-scale human serum for proteomic analysis. Electrophoresis. 2021;42:245-56.
44. Vergauwen G, Dhondt B, Van Deun J, et al. Confounding factors of ultrafiltration and protein analysis in extracellular vesicle research. Sci Rep. 2017;7:2704.
45. Pua HH, Happ HC, Gray CJ, et al. Increased hematopoietic extracellular RNAs and vesicles in the lung during allergic airway responses. Cell Rep. 2019;26:933-44.e4.
46. Rosenecker J, Naundorf S, Rudolph C. Airway surface liquid contains endogenous DNase activity which can be activated by exogenous magnesium. Eur J Med Res. 2009;14:304-8.
Cite This Article
How to Cite
Download Citation
Export Citation File:
Type of Import
Tips on Downloading Citation
Citation Manager File Format
Type of Import
Direct Import: When the Direct Import option is selected (the default state), a dialogue box will give you the option to Save or Open the downloaded citation data. Choosing Open will either launch your citation manager or give you a choice of applications with which to use the metadata. The Save option saves the file locally for later use.
Indirect Import: When the Indirect Import option is selected, the metadata is displayed and may be copied and pasted as needed.
About This Article
Special Topic
Copyright

Data & Comments
Data
0


Comments
Comments must be written in English. Spam, offensive content, impersonation, and private information will not be permitted. If any comment is reported and identified as inappropriate content by OAE staff, the comment will be removed without notice. If you have any queries or need any help, please contact us at [email protected].