


fig1
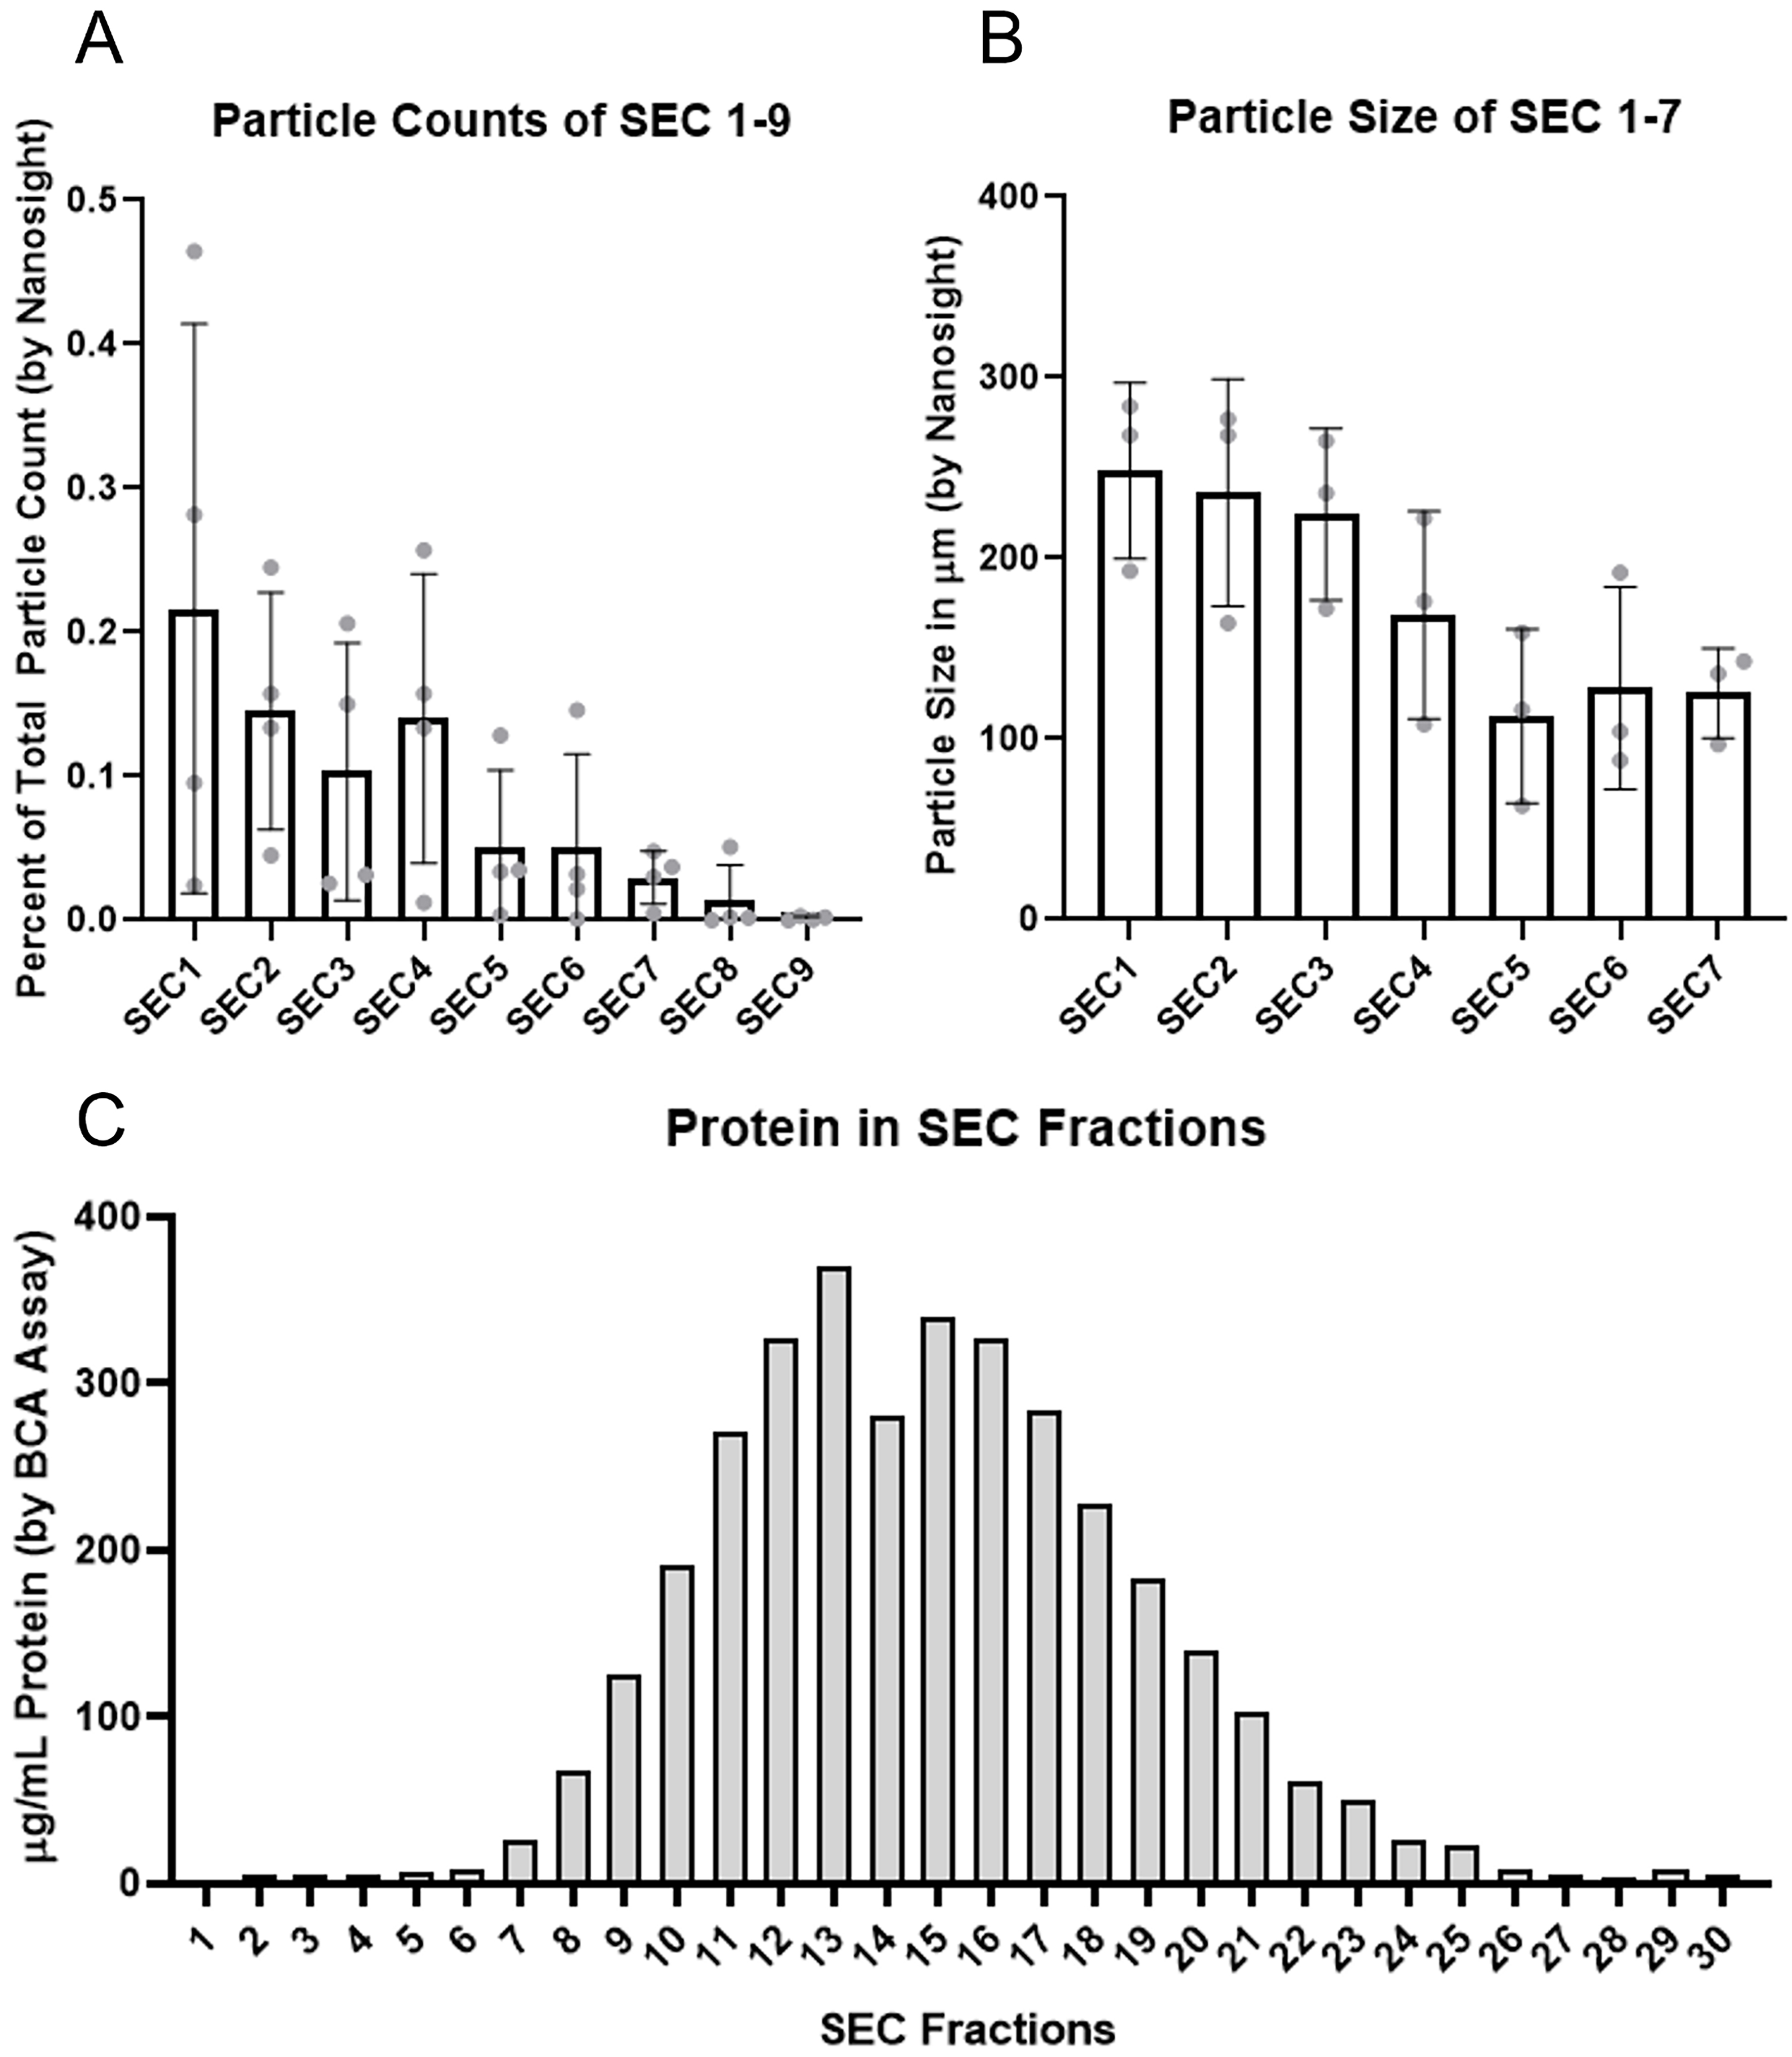
Figure 1. Size exclusion chromatography fraction particle counts, size, and protein content. (A) Particle counts represented as a fraction of total sample particle count as determined by Nanosight LM-10 of SEC Fractions 1-9 demonstrating decrease in particle counts in later fractions until being below the limit of detection by Nanosight in SEC fraction 9, n = 4 subjects, error bars represent standard deviation; (B) Particle size of particles contained within SEC fractions 1-7 demonstrating decrease in particle size with increase in SEC fractions, n = 3 subjects, error bars represent standard deviation; (C) Total protein count in SEC fractions 1-30 demonstrating minimal protein in SEC fractions 1-6 with increase in protein concentration in fractions 7-25 with a peak in fraction 13, n = 1 subject. SEC: Size exclusion chromatography; LM-10: Nanosight LM-10 particle analysis system; SD: standard deviation.


