


fig4
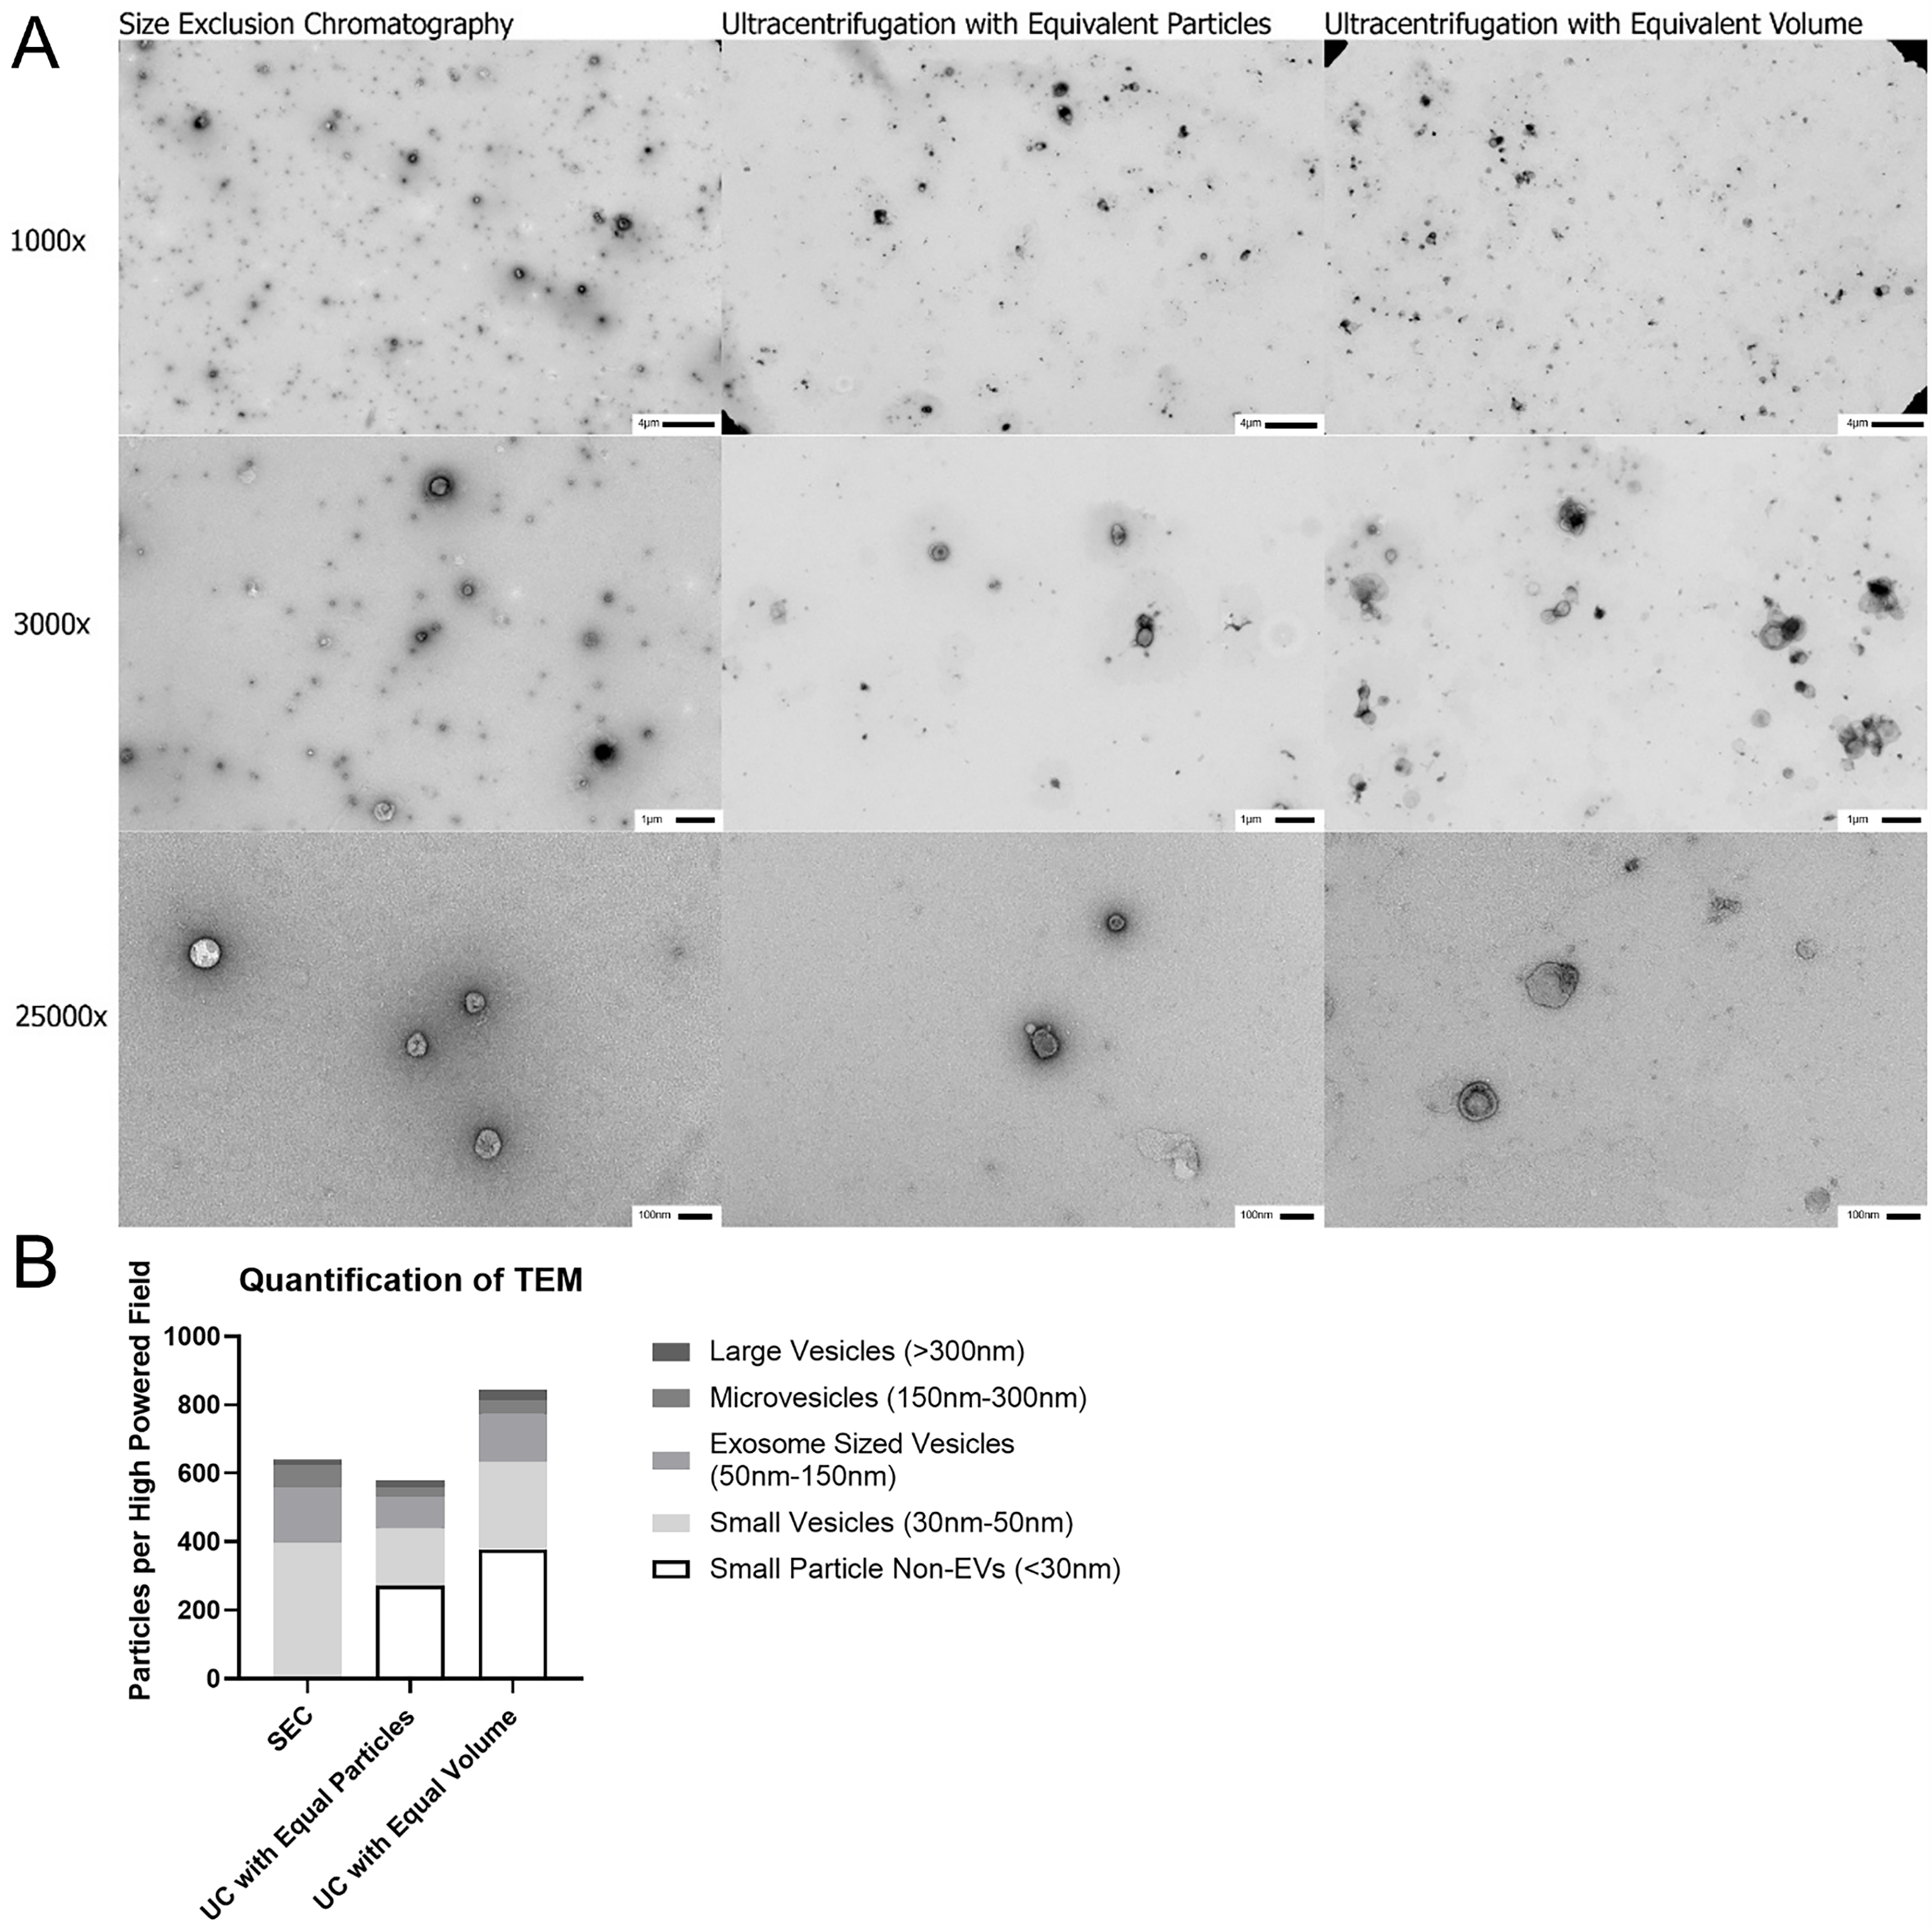
Figure 4. Transmission electron microscopy of EVs isolated from BAL by SEC and UC. (A) EVs were isolated by SEC and UC and preparations imaged using both equivalent particle counts by Nanosight LM-10 and equal volume from original acellular BAL to visualize EV yield, 1,000 ×, 3,000 ×, and 25,000 × magnifications are shown. All samples imaged demonstrate typical cupping that is characteristic of EVs, but the SEC sample shows higher density of identifiable EVs per High Powered Field; (B) 1,000 × images were used to quantify number of particles with 3,000 × and 25,000 × magnifications utilized to clarify size and nature of particles. Non-EV particles were not included in the counts as determined by lack of central cupping on higher magnification images. SEC demonstrated significantly higher quantities of small particles EVs and the Exosome population compared to both UC preparations. n = 3-5 HPF for 1,000 × and 5-9 HPF for 3,000 × and 25,000 × magnifications. EVs: Extracellular vesicles; BAL: bronchoalveolar lavage; SEC: size exclusion chromatography; UC: ultracentrifugation; TEM: transmission electron microscopy; HPF: high power field.


