


Endothelial cell heterogeneity and immune-metabolic crosstalk in scleroderma: insights from single-cell RNA sequencing
 0
0 Abstract
Aim: This study aims to investigate the mechanisms by which vascular endothelial cells regulate the immune microenvironment in scleroderma.
Methods: Two public single-cell RNA sequencing (scRNA-seq) datasets (GSE264508 and GSE138669) from the Gene Expression Omnibus (GEO) database were analyzed, including skin samples from localized and systemic scleroderma patients. Seurat was used for data processing and clustering, CellChat for cell communication analysis, Monocle2 for pseudotime analysis, scMetabolism for metabolic profiling, and TwoSampleMR to identify potential causal genes based on expression quantitative trait loci (eQTL) data.
Results: We identified distinct EC subtypes and found enhanced communication between ECs and myeloid cells in scleroderma, indicating an active role in immune regulation. ECs remodeled the immune microenvironment via multiple ligand-receptor pairs. Increased oxidative phosphorylation in early-stage ECs was linked to immune activation. Pseudotime analysis revealed dynamic differentiation, and Mendelian randomization identified COX4I1 as a potential pathogenic and therapeutic target.
Conclusion: This study provides a comprehensive single-cell atlas of ECs in scleroderma, highlighting their immunometabolic plasticity and crosstalk with immune cells. The findings suggest that ECs are active participants in the early pathogenesis of skin fibrosis and support COX4I1 as a potential therapeutic target.
Keywords
INTRODUCTION
Scleroderma is a group of autoimmune connective tissue diseases characterized primarily by vascular abnormalities, immune activation, and tissue fibrosis. It is mainly classified into two clinical subtypes: systemic sclerosis (SSC) and localized scleroderma (LS)[1-3]. SSC is a chronic, progressive disease affecting the skin and multiple internal organs, and is associated with high morbidity and mortality. In contrast, LS primarily affects the skin and subcutaneous tissues, typically sparing visceral involvement, but can still lead to substantial functional impairment and cosmetic disfigurement[4,5].
Histopathologically, both subtypes exhibit inflammatory cell infiltration and dermal fibrosis, suggesting the existence of shared pathogenic mechanisms. However, significant differences remain in their patterns of immune activation, degree of vascular injury, and fibrotic pathways[6-9].
Recent studies have identified endothelial cell (EC) dysfunction as one of the earliest and most critical pathological events in the development of scleroderma, particularly in SSC. ECs play a central role in the “inflammation-vascular-fibrosis axis” by regulating microvascular rarefaction, immune cell recruitment, inflammatory cascade amplification, and fibroblast activation[10]. In SSC, ECs are prone to activation, apoptosis, and endothelial-to-mesenchymal transition (EndMT), and they secrete various pro-fibrotic mediators such as vascular endothelial growth factor (VEGF), connective tissue growth factor (CTGF), and thymic stromal lymphopoietin (TSLP)[11-14]. Furthermore, bidirectional interactions between ECs and myeloid cells, including macrophages and dendritic cells, are thought to intensify local immune responses, thereby accelerating fibrosis and tissue remodeling[15-20]. At the transcriptional and epigenetic levels, ECs in SSC exhibit impaired angiogenic capacity, metabolic dysregulation, and aberrant DNA methylation, indicating a profound reprogramming and loss of homeostatic function[21-23]. Comparatively, endothelial abnormalities in LS remain less well characterized. A few studies have reported impaired angiogenesis, diminished responsiveness to VEGF, and downregulation of endothelial miR-126 in LS patients[24,25], suggesting that vascular dysfunction may also contribute to localized fibrotic changes via mechanisms partially overlapping with those in SSC. However, the specific differences in EC subset composition, metabolic states, and intercellular communication networks between LS and SSC have not been systematically elucidated.
Current research on EC subset heterogeneity, intercellular communication, and metabolic features in scleroderma is mainly limited to isolated observations, lacking systematic exploration at the single-cell level. In this study, we conducted an integrative analysis of two publicly available single-cell RNA sequencing (scRNA-seq) datasets (GSE264508 and GSE138669), comprising skin samples from patients with LS and SSC. Using analytical tools such as Seurat, CellChat, scMetabolism, and Monocle, we comprehensively evaluated EC lineage composition, communication networks, and metabolic states. We identified shared and distinct features between SSC and LS in EC subset composition and metabolic pathway activity. Further Mendelian randomization (MR) analysis revealed a negative correlation between COX4I1 and the risk of LS, suggesting COX4I1 as a potential protective target. Collectively, this study systematically delineates the pivotal roles of ECs in scleroderma pathogenesis and provides novel insights for developing targeted metabolic and signaling intervention strategies.
METHODS
Sample data
Two single-cell datasets related to scleroderma were obtained from the Gene Expression Omnibus (GEO: https://www.ncbi.nlm.nih.gov/geo/) database. One of them corresponds to LS (GSE264508, N = 28), which includes 14 samples from healthy individuals and 14 samples from patients with LS. The second dataset corresponds to SSC (GSE138669, N = 22), containing 10 healthy control samples and 12 SSC patient samples.
Single-cell data analysis
Quality control, normalization, and integration of scRNA-seq data were performed using the Seurat package (version 4.3.0) in R[26]. A log normalization approach within a linear regression framework was initially applied to scale the data, facilitating downstream identification of cell populations. Cells were filtered based on the following criteria: the number of detected RNA features had to range between 50 and 10,000 to exclude low-quality or doublet-prone cells. Cells exhibiting > 25% mitochondrial gene content (pMT) were removed to eliminate apoptotic or damaged cells. Additionally, cells with > 5% hemoglobin gene expression were excluded to reduce contamination from red blood cells, which could bias downstream analysis. The SCTransform method was subsequently employed for variance-stabilizing normalization of the raw count matrix. Dimensionality reduction was conducted via principal component analysis (PCA) on highly variable genes, with the optimal number of principal components (PCs) determined through ElbowPlot inspection and quantitative evaluation. To account for potential batch effects across samples, the Harmony algorithm was applied for integration and alignment. A shared nearest neighbor (SNN) graph was constructed using the top PCs, followed by unsupervised clustering via the Louvain algorithm, with a resolution parameter set to 0.5. Uniform Manifold Approximation and Projection (UMAP) was then used for visualization in two dimensions. Differentially expressed genes (DEGs) between clusters were identified using the FindAllMarkers function, with a threshold of log2 fold change (Log2FC) > 0.25. Finally, cell type annotation was manually curated based on canonical markers from previously published literature[27-30], enabling accurate identification and labeling of major cell populations.
Cell-cell communication analysis
Intercellular communication analysis was performed using the CellChat package in R (version 1.6.1)[27], which incorporates a curated database of ligand-receptor interactions for both human and mouse species. This framework enables the inference of cell-cell communication networks based on single-cell transcriptomic data annotated by cell clusters. We employed the CellChatDB.human database to systematically assess the dominant incoming and outgoing signaling pathways among the identified cell populations. Communication probability and strength between clusters were quantitatively inferred using the integrated computational model. To visualize the intercellular signaling landscape, the netVisual_circle function was applied to generate circular network plots depicting the directionality and intensity of signaling from a specified target cluster to all other annotated clusters. Furthermore, the netVisual_bubble function was utilized to construct bubble plots highlighting statistically significant ligand-receptor pairs mediating interactions between the target cluster and other cell types.
Pseudotime analysis
We performed pseudotime trajectory analysis on EC subsets using the Monocle R package (version 2.22.0)[31]. A newCellDataSet object was constructed, and size factors and dispersion estimates were calculated using the estimateSizeFactors and estimateDispersions functions, respectively. Low-quality cells were filtered out by applying a minimum expression threshold (min_expr = 0.1) to exclude genes with low detection rates. Dimensionality reduction was subsequently performed using the DDRTree algorithm to infer developmental trajectories and visualize transcriptional progression across EC states.
Metabolic activity assessment
Metabolic activity at the single-cell level within each cell population was quantified and visualized using the scMetabolism R package (version 0.2.1)[32], a recently developed computational tool for assessing cellular metabolic states in scRNA-seq data. The algorithm integrates precompiled metabolic pathway gene sets from the Kyoto Encyclopedia of Genes and Genomes (KEGG) and computes pathway-specific activity scores for individual cells based on gene expression matrices and a vision-based scoring algorithm. Prior to analysis, the expression data were uniformly transformed to conform to the input requirements of the package. The virtual inference of single-cell omics interpretation (VISION) method was selected for activity scoring, enabling high-resolution quantification of metabolic signatures across diverse pathways. Finally, metabolic activity scores were compared across different biological conditions or cell populations to identify significantly dysregulated metabolic pathways relevant to the biological context under investigation.
Gene-Based Mendelian Randomization (eQTL-MR) analysis
Genome-wide association study (GWAS) statistics for SSC from the FinnGen database (release R9; https://r9.risteys.finngen.fi/), combined with GWAS data for LS (ID: finngen_R9_L12_LOCALSCLERODERMA) from the FinnGen database, were obtained. Gene-based MR analysis using expression quantitative trait loci (eQTLs) as instrumental variables was conducted with the TwoSampleMR R package (version 0.6.14). Five complementary MR methods were applied by default: Inverse Variance Weighted (IVW), MR-Egger regression, Weighted Median, Simple Mode, and Weighted Mode. Among these, the IVW method served as the primary approach due to its efficiency and statistical power. It estimates the causal effect by aggregating single nucleotide polymorphism (SNP)-specific effects weighted by the inverse of their variance, under the assumption that all instruments satisfy the core MR assumptions. MR-Egger regression introduces an intercept term to test for directional (horizontal) pleiotropy. The Weighted Median method provides consistent estimates even when up to 50% of the instruments are invalid. The Simple Mode estimator is a non-parametric method that infers the most common causal effect among SNPs based on clustering, while the Weighted Mode extends this approach by incorporating the weight of each variant in estimating the modal effect. MR analyses were performed across two independent datasets, with the IVW method designated as the primary analytic approach. A result was considered robustly positive if the IVW-derived P value was less than 0.05, provided there was no evidence of pleiotropy or heterogeneity, and effect estimates (β coefficients) from the other methods were concordant in direction, even if not statistically significant.
Statistical analysis
All statistical analyses were performed using R software (versions 1.6.1 and 4.3.0). We confirm that different versions of R packages were used in this study because some analyses were conducted at different time points and computational environments, where package versions varied slightly. However, all analyses were re-run and verified for consistency, and the results were reproducible across versions.
RESULTS
Enhanced endothelial-myeloid cell communication in scleroderma
A total of 121,351 cells were identified and categorized into 12 distinct subpopulations [Figure 1A]. The dataset was divided into three groups: Healthy, LS, and SSC [Figure 1B]. Scatter plots showing marker gene expression for each cell type are displayed in Figure 1C. The proportion of each cell type is shown in Figure 1D, indicating that keratinocytes, ECs, fibroblasts, smooth muscle cells (SMCs), and T cells constitute a significant proportion of the cellular landscape. Cell-cell interaction analysis revealed that myeloid cells exhibit stronger interactions with ECs compared to other cell types [Figure 1E].
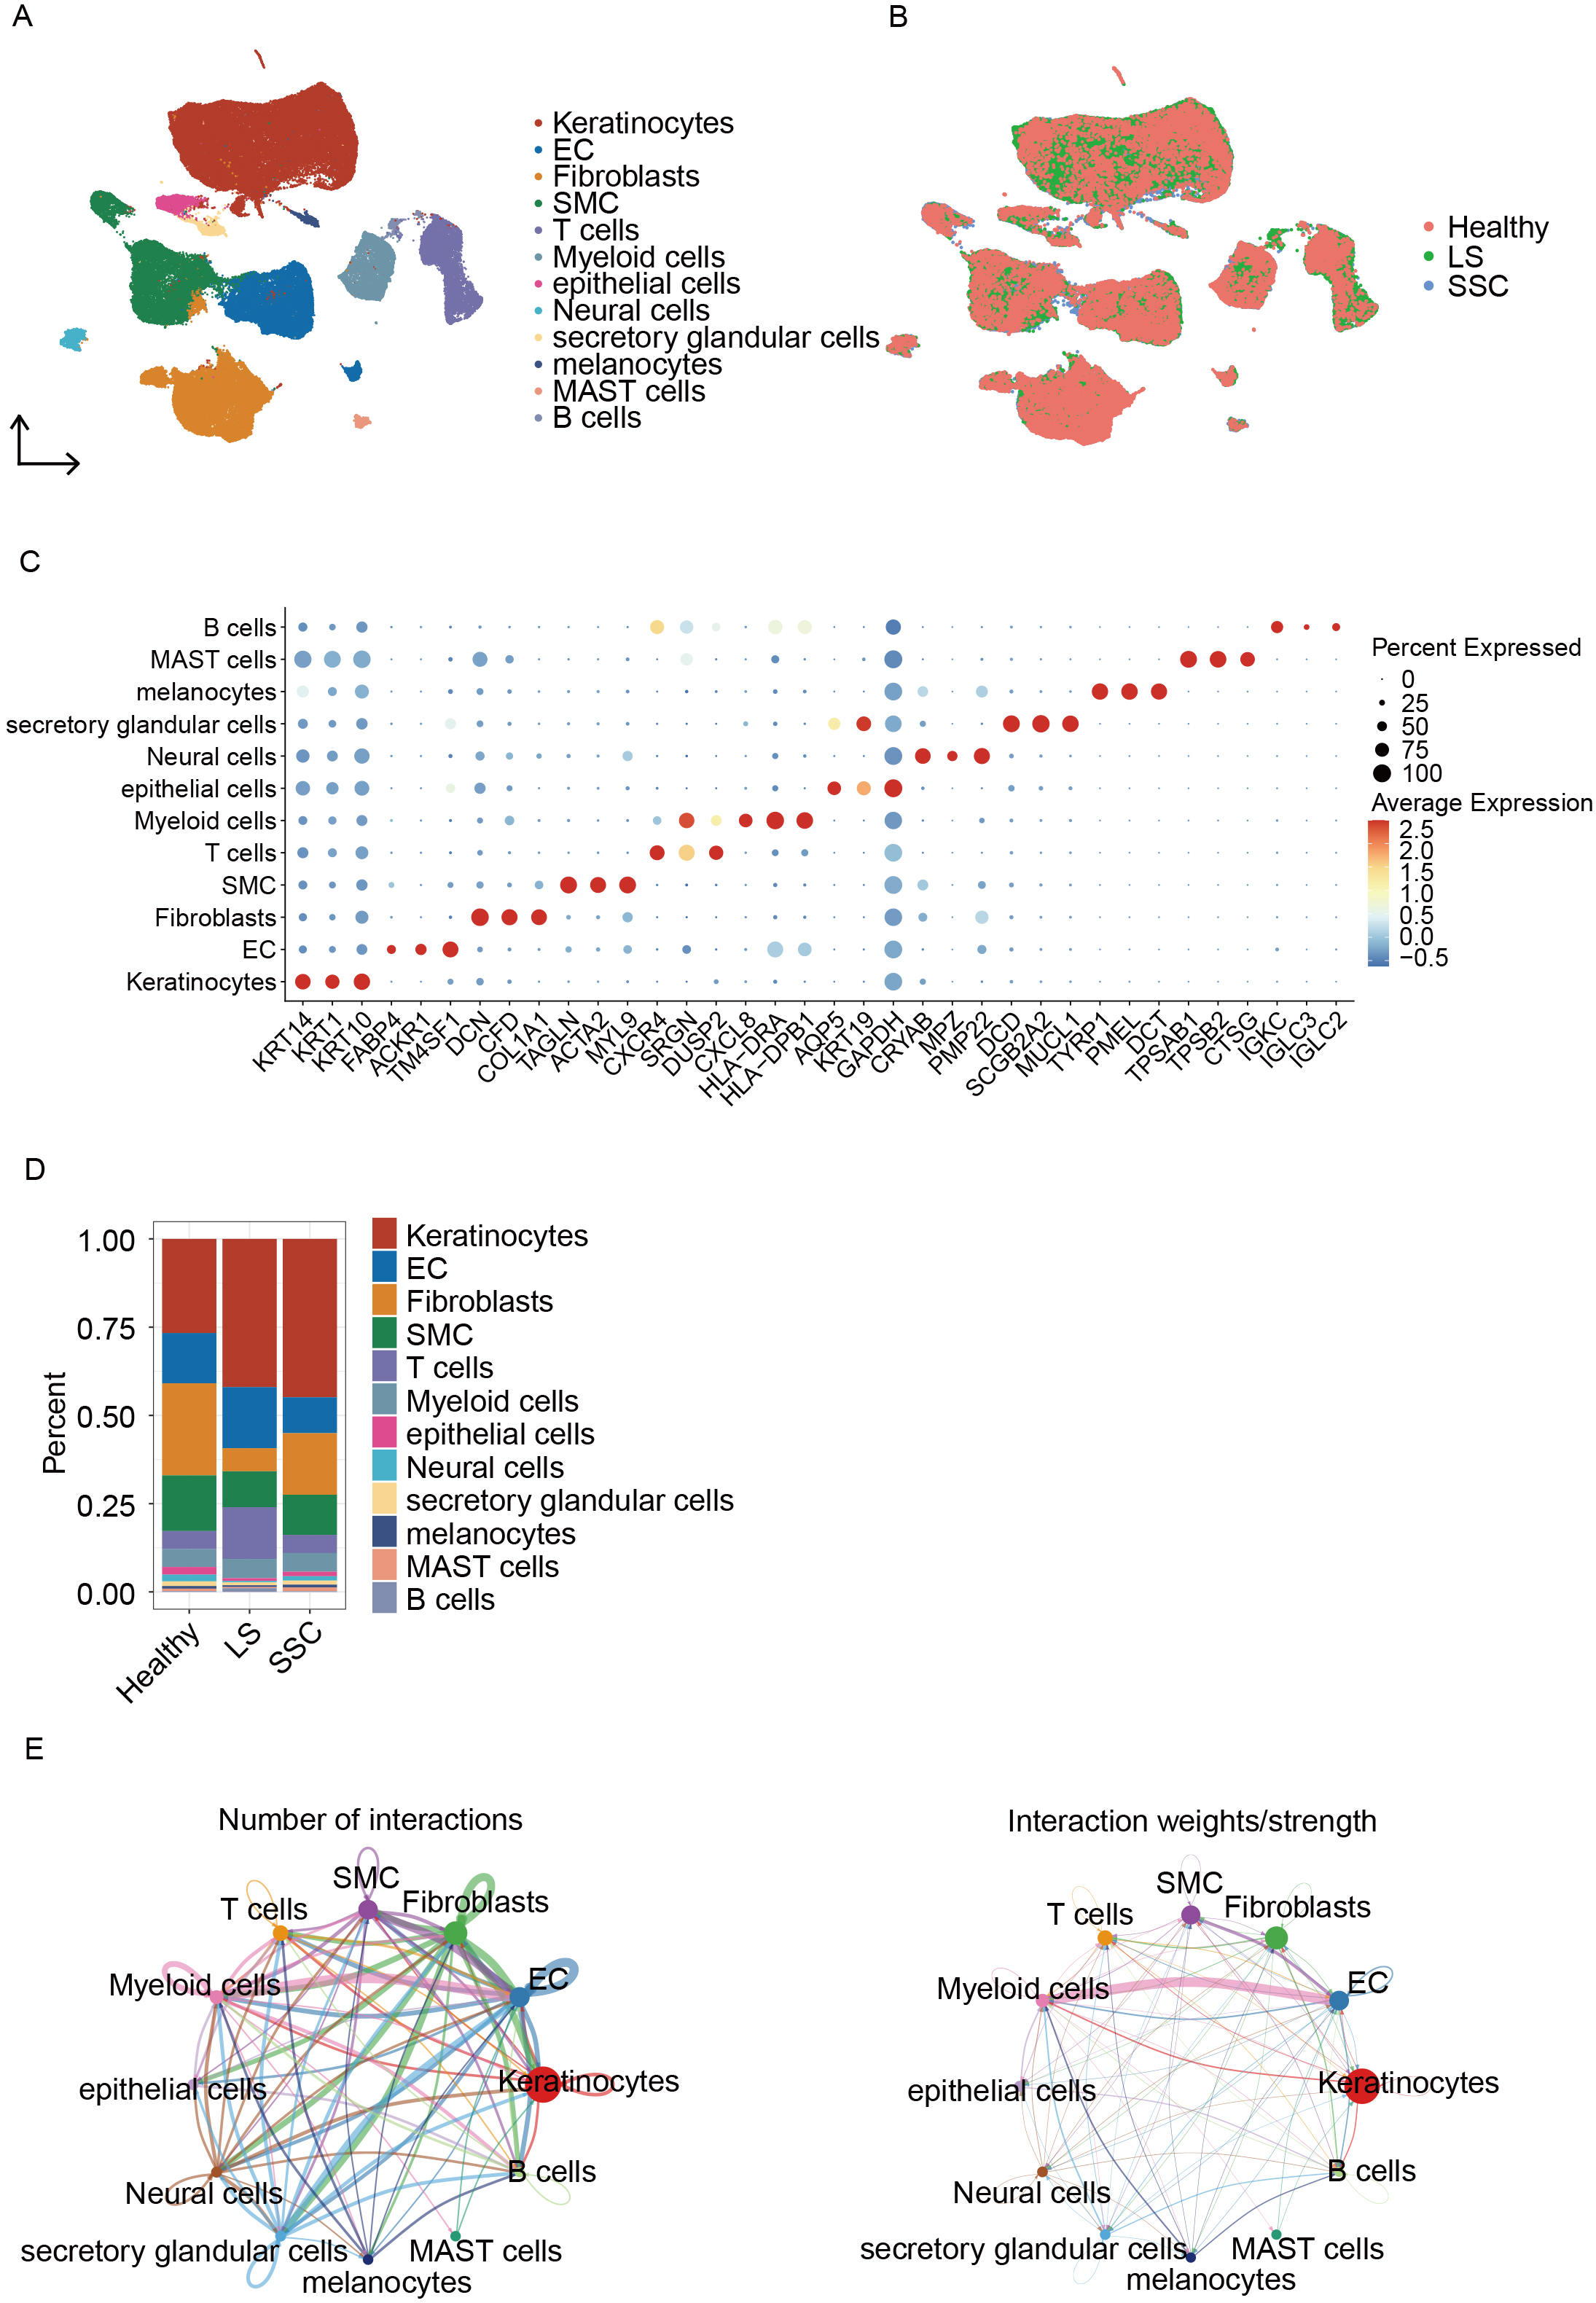
Figure 1. Single-cell analysis and intercellular interactions in scleroderma. (A) UMAP plot showing cell type annotations; (B) UMAP plot displaying cell distribution across groups; (C) Dot plot of marker genes used for cell annotation; (D) Bar plot showing the proportion of cell types in each sample; (E) Cell-cell interaction network diagrams: the left panel shows the total number of interactions and the right panel shows the weighted interaction network. UMAP: Uniform manifold approximation and projection; EC: endothelial cell; SMCs: smooth muscle cells; SSC: systemic sclerosis; LS: localized scleroderma; MAST: mastocytes.
Analysis of EC subclusters
The ECs were divided into seven distinct subpopulations, including: CXCL14+ vascular ECs (CXCL14+ VECs), Venous ECs (VenECs), Mural cells (MCs), Capillary ECs (CapECs), Endothelial progenitor cells (EPCs), Lymphatic ECs (LECs), and Arterial ECs (ArtECs) (See Figure 2A). The differences in subpopulation proportions among the three groups are shown in Figure 2B. UMAP visualizations of canonical marker gene expression for vascular, lymphatic, and mural ECs are shown in Figure 2C, while the top 3 DEGs for each subcluster are illustrated in Figure 2D. To explore the functional roles of each endothelial subpopulation in scleroderma, we performed Gene Ontology (GO) enrichment analysis based on both inter-subcluster and intergroup DEGs. As shown in Figure 2E, each endothelial subtype exhibited distinct enrichment patterns. For instance, VenECs were significantly enriched in pathways such as leukocyte cell-cell adhesion and regulation of T cell activation, suggesting their involvement in immune responses. Furthermore, intergroup GO enrichment analysis revealed that the SSC group showed significant enrichment in the long-chain fatty acid transport pathway [Figure 2F]. Within this pathway, fatty acid binding protein 4 (FABP4), a gene previously associated with fibrotic diseases, was notably upregulated, indicating its potential role in scleroderma pathogenesis. The expression of FABP4 is shown in Figure 2G.
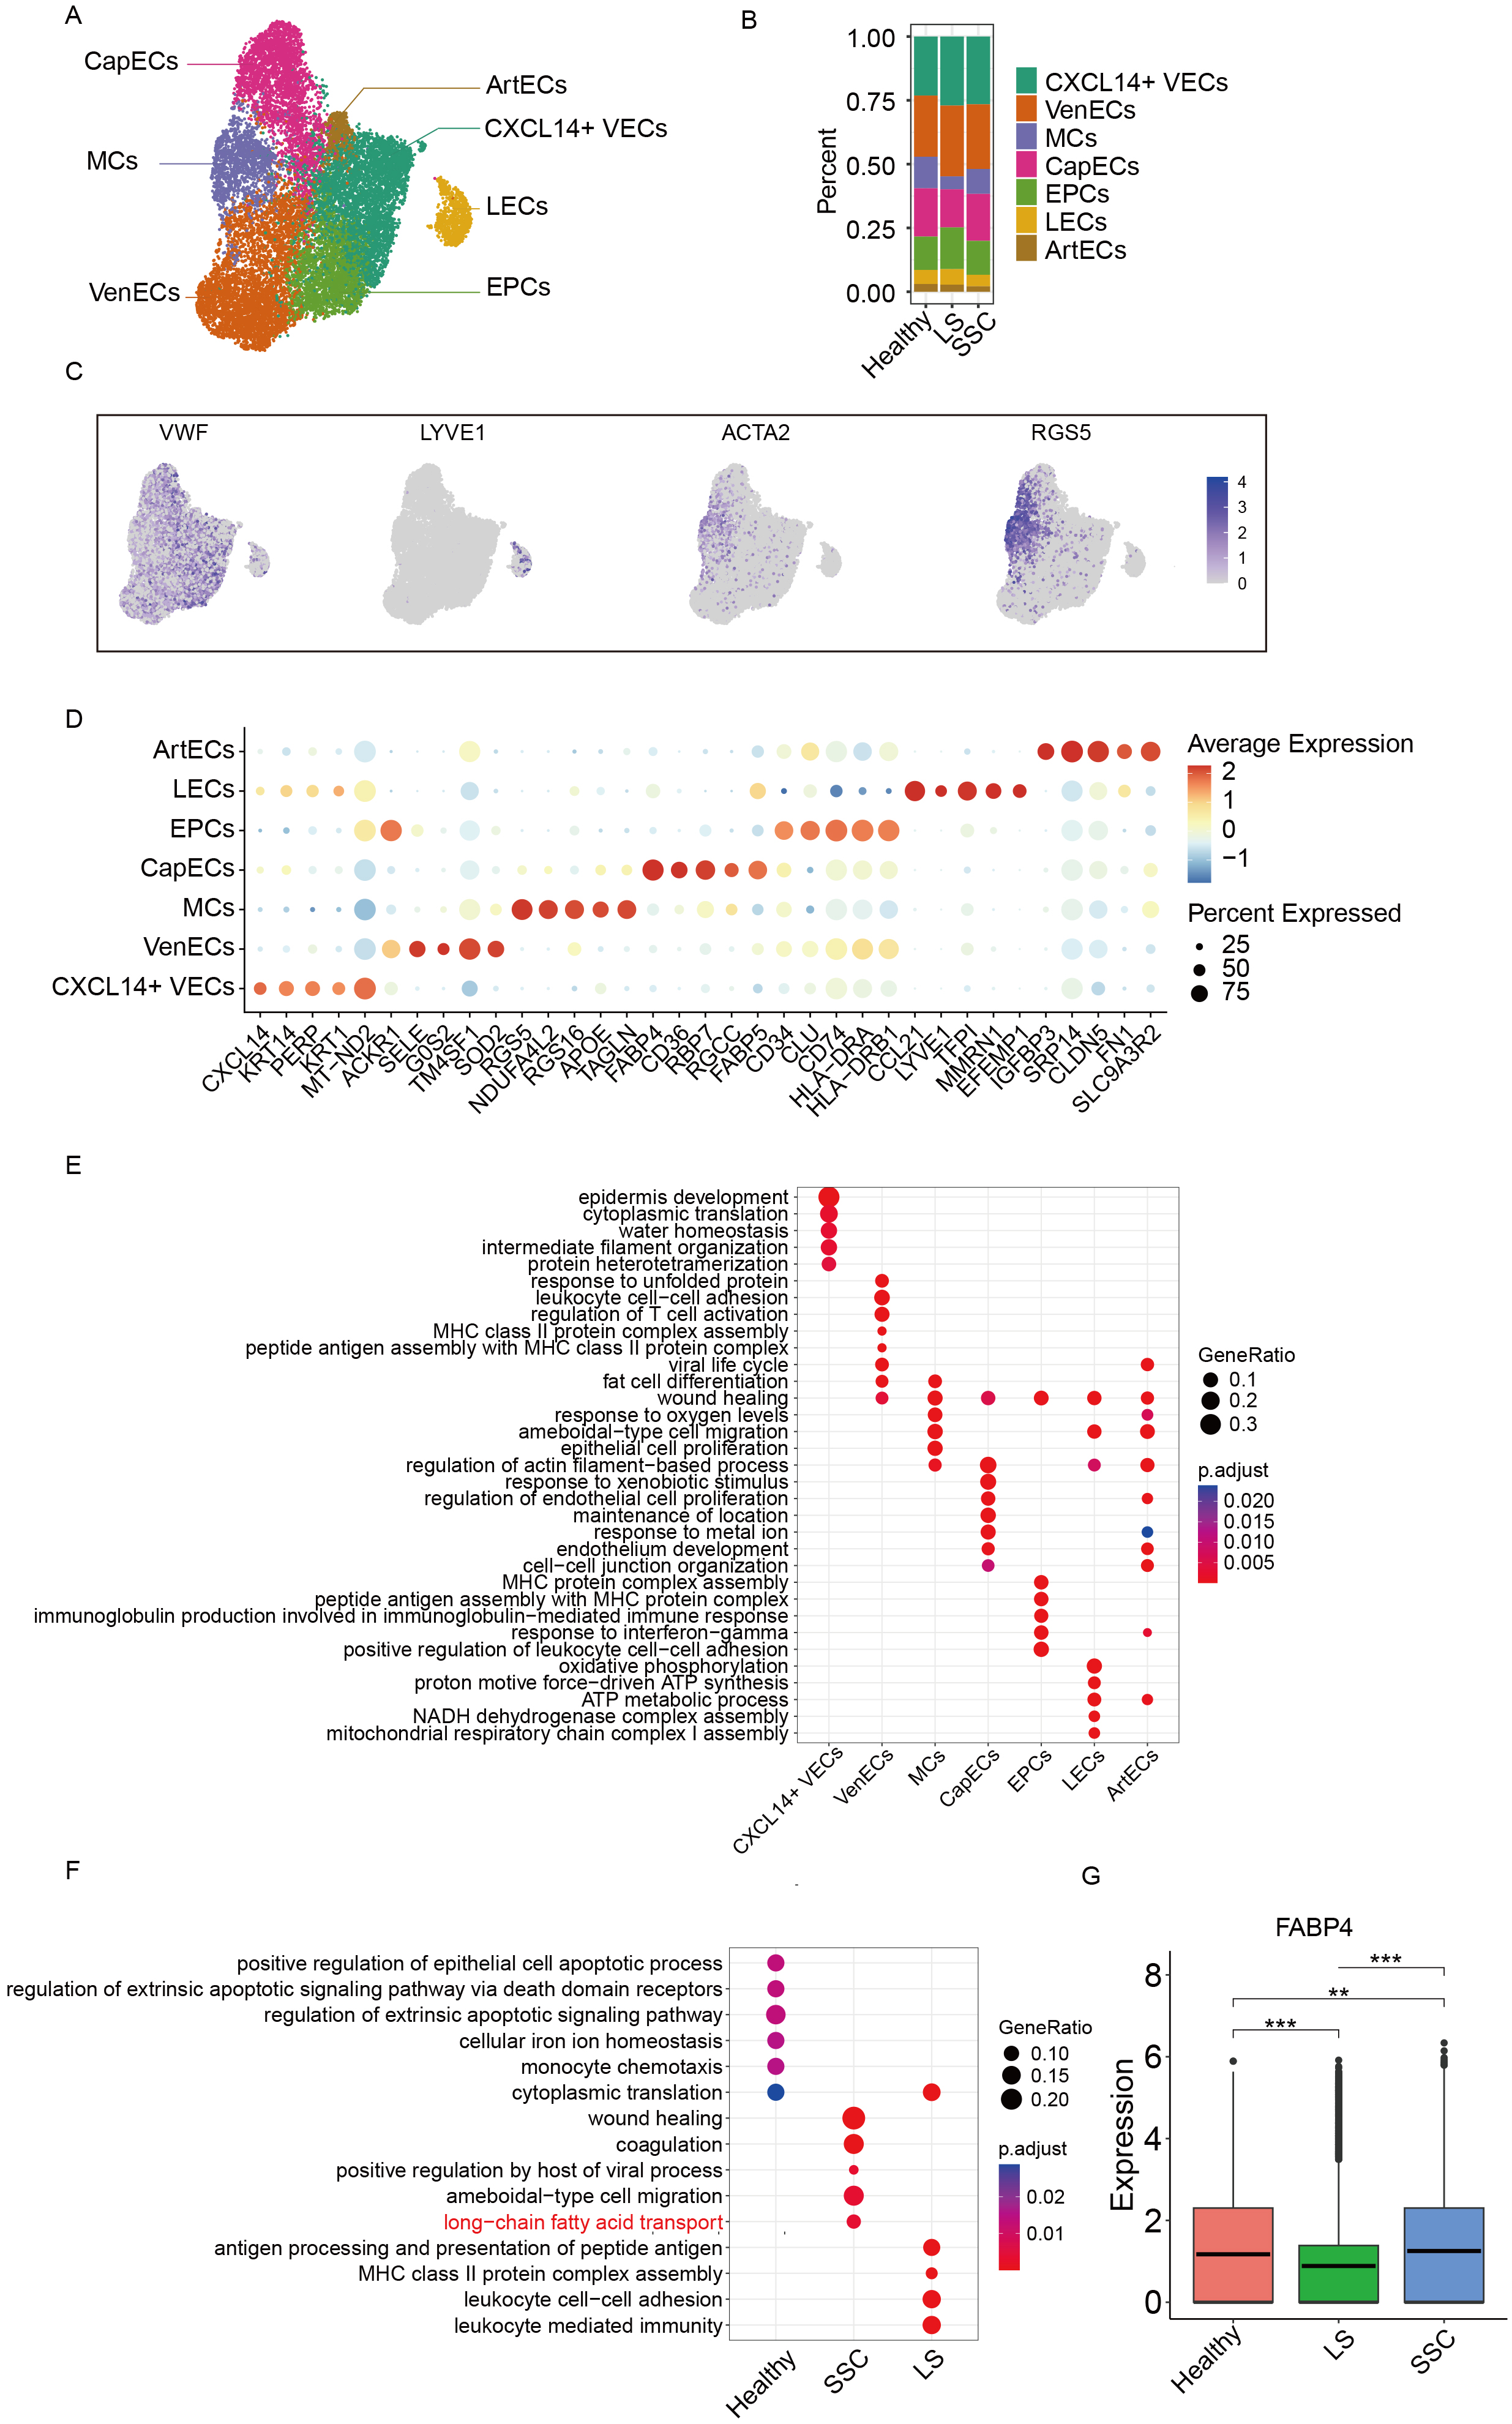
Figure 2. Subclustering analysis of ECs. (A) UMAP plot showing the annotation of EC subclusters; (B) Bar plot showing the proportion of EC subclusters across groups; (C) UMAP plot displaying marker gene expression for each cell subtype; (D) Dot plot of canonical marker genes used for subcluster annotation; (E) Functional enrichment analysis of DEGs among EC subclusters; (F) Functional enrichment analysis of DEGs between groups; (G) Box plot showing the expression of FABP4 across different groups with asterisks denoting levels of statistical significance where *** signifies a P value of less than 0.001, ** signifies a P value of less than 0.01, and * signifies a P value of less than 0.05. UMAP: Uniform manifold approximation and projection; ECs: endothelial cells; DEGs: differentially expressed genes; FABP4: fatty acid binding protein 4; MCs: mural cells; CapECs: capillary ECs; EPCs: endothelial progenitor cells; LECs: lymphatic ECs; CXCL14+ VECs: CXCL14+ vascular ECs; VenECs: venous ECs; ArtECs: arterial ECs; SSC: systemic sclerosis; LS: localized scleroderma; MHC: major histocompatibility complex; NADH: nicotinamide adenine dinucleotide + hydrogen; ATP: adenosine triphosphate; VWF: von willebrand factor; LYVE1: lymphatic vessel endothelial hyaluronan receptor 1; ACTA2: actin alpha 2; RGS5: regulator of g-protein signaling 5.
Mapping the EC microenvironment
Pseudotime analysis was performed on ECs to investigate their differentiation trajectories. Figure 3A and B illustrates these trajectories, where colors transition from dark to light, representing progression from the initial to terminal differentiation stages. The developmental stages of individual cells are shown in Figure 3C, with smaller numbers indicating proximity to the starting point of differentiation. Cell-cell interaction analysis across groups revealed that EC interactions in both the LS and SSC groups were significantly enhanced compared to healthy controls, indicating a heightened endothelial response in scleroderma. Among these, interactions between MCs and VenECs as well as EPCs were stronger than interactions involving other cell types [Figure 3D]. Figure 3E presents a heatmap depicting the relative strength of signaling pathways across groups. The strongest signals were observed in MCs. Notably, the Midkine (MK) signaling pathway was absent in the healthy group but exhibited strong activity in both the LS and SSC groups. Within this pathway, the most significant contributing ligand-receptor pair was Midkine (MDK)-Nucleolin (NCL) [Figure 3F]. In addition, we observed that both ECs and myeloid cells may jointly contribute to the activation of this pathway in scleroderma. Notably, the heatmap results showed that signaling pathway activation was more pronounced in myeloid cells, although it remains unclear which cell type plays a dominant role in this activation.
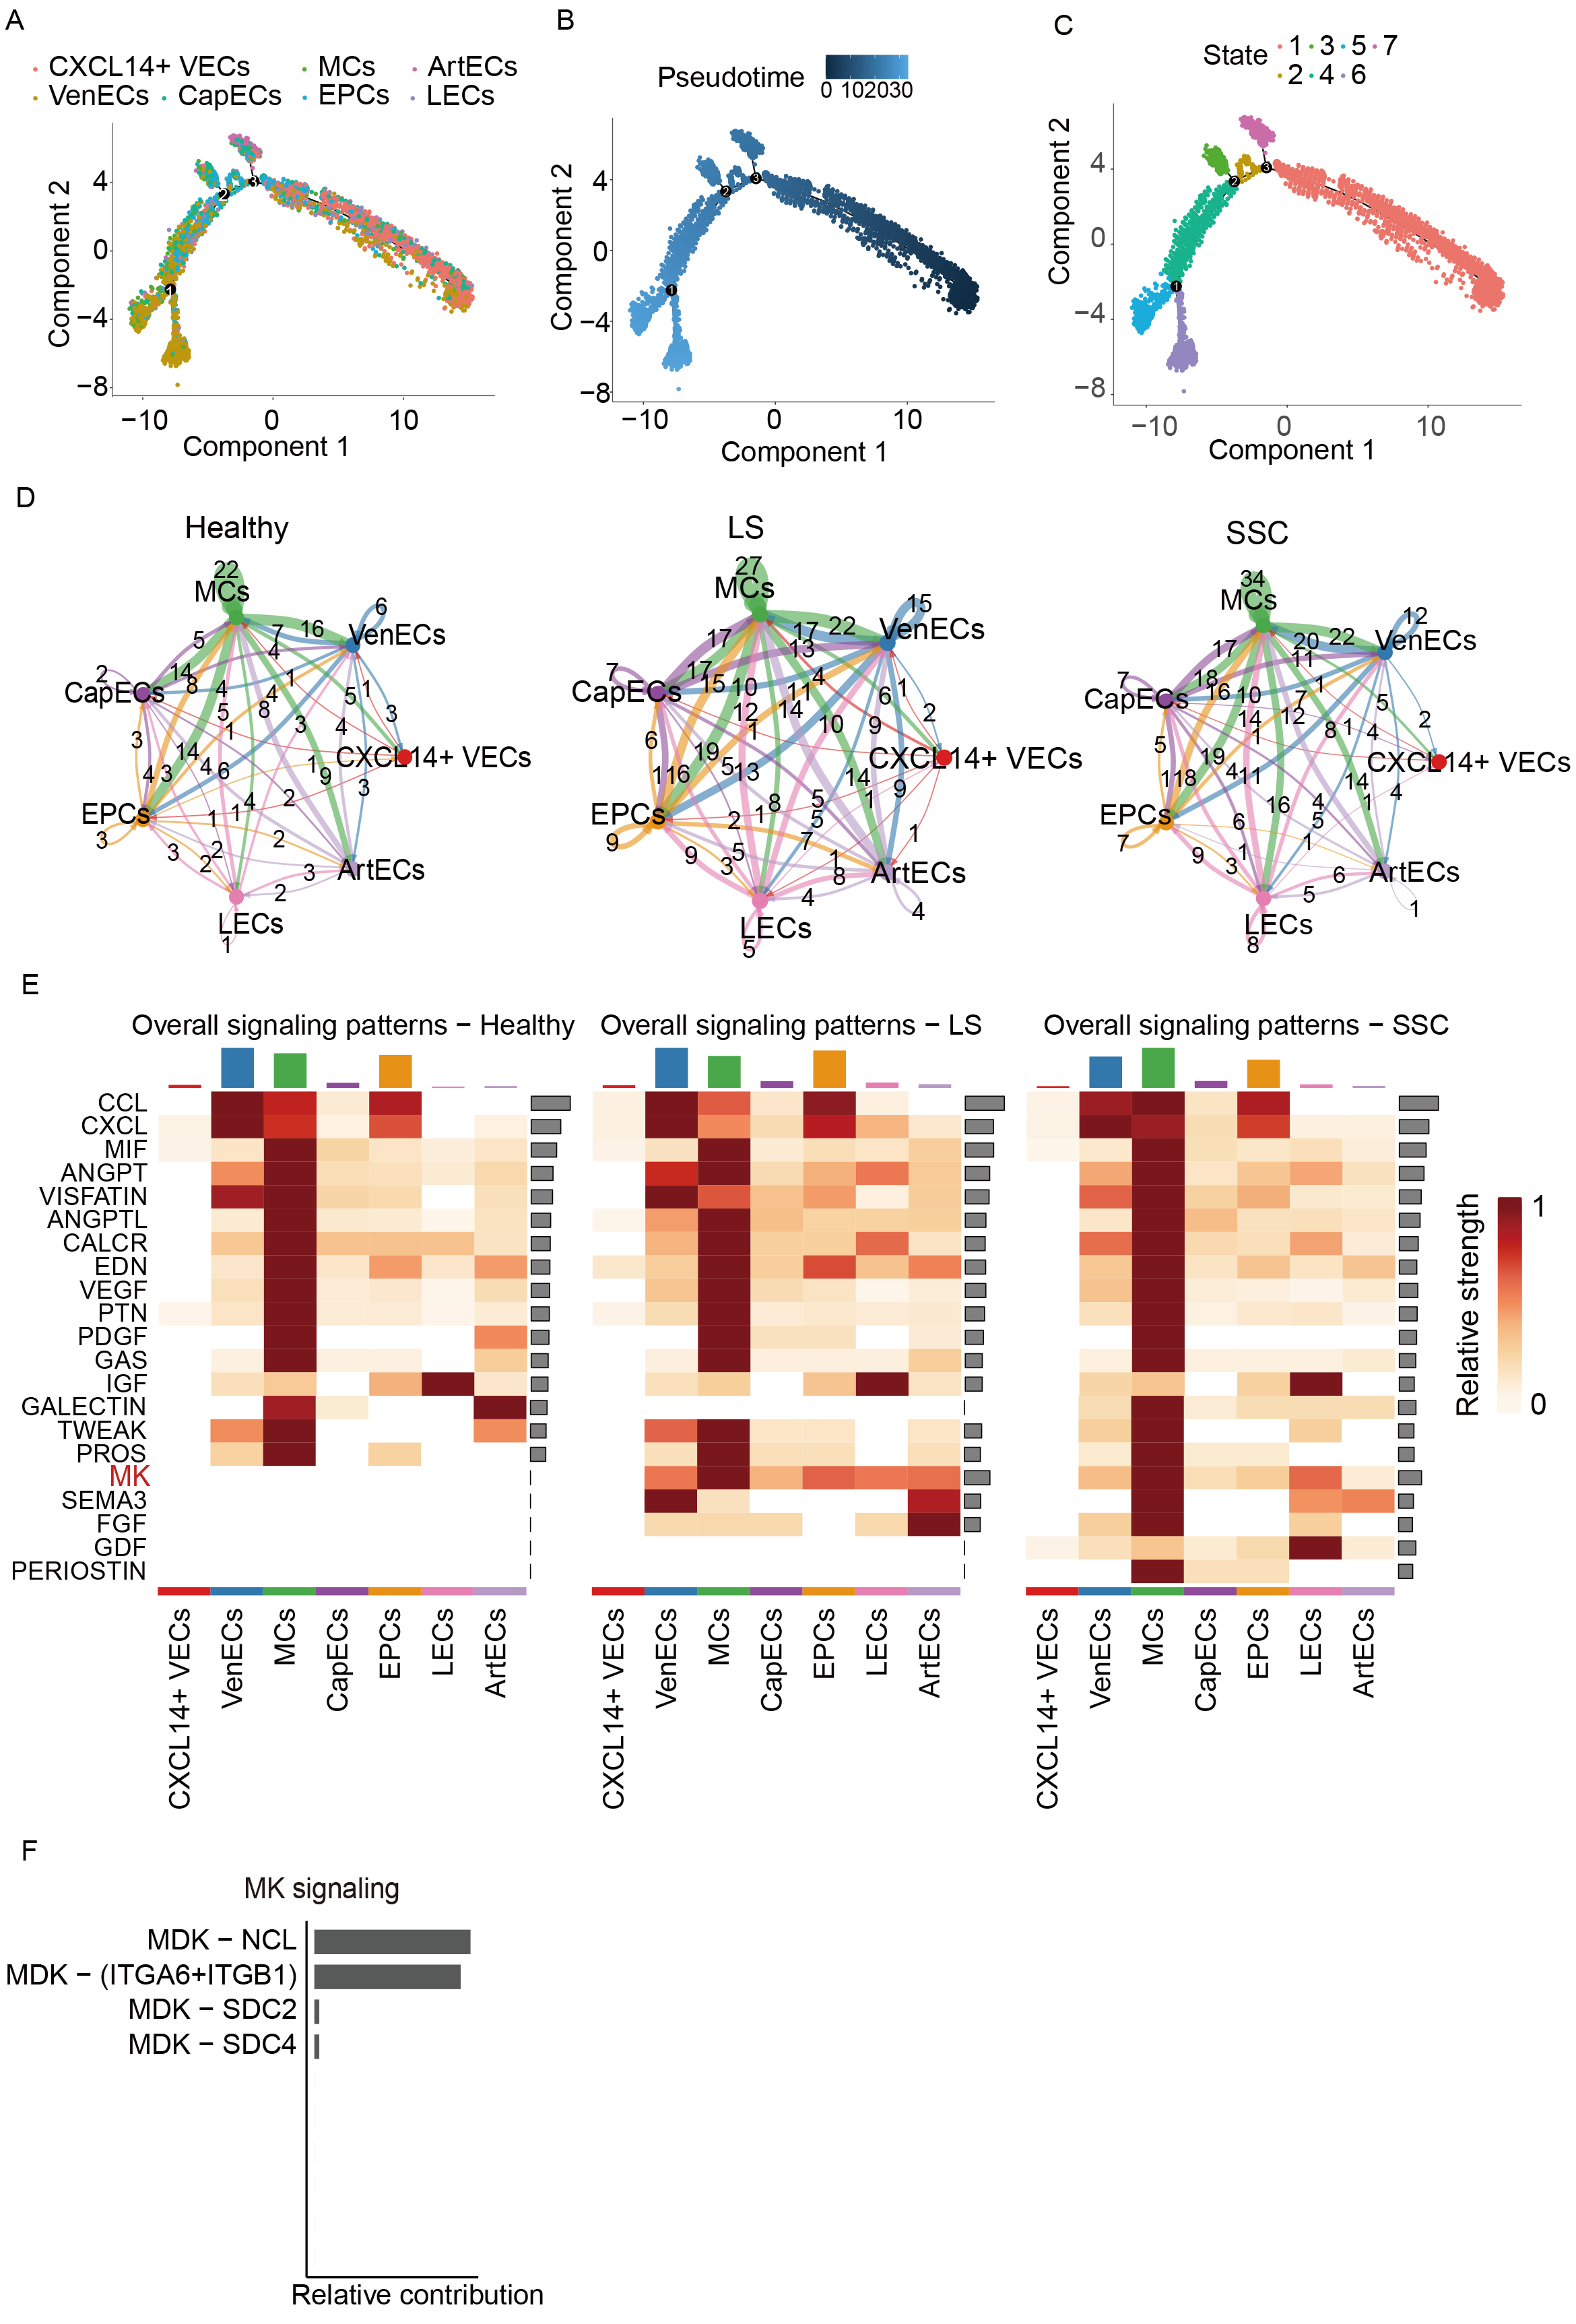
Figure 3. Pseudotime and intercellular communication analysis of EC subclusters. (A) Pseudotime distribution of EC subclusters; (B) Pseudotime value distribution across subclusters; (C) Cell developmental trajectory stages along pseudotime; (D) Cell-cell communication networks between groups; (E) Heatmap showing the expression of signaling pathways across cell-cell interactions; (F) Bar plot illustrating the contribution of specific ligand-receptor pairs within the MK signaling pathway. EC: Endothelial cell; MCs: mural cells; CapECs: capillary ECs; EPCs: endothelial progenitor cells; LECs: lymphatic ECs; CXCL14+ VECs: CXCL14+ vascular ECs; VenECs: venous ECs; ArtECs: arterial ECs; SSC: systemic sclerosis; LS: localized scleroderma; NCL: nucleolin; MK/MDK: midkine; DMK: doppel midkine; CCL: c-c motif chemokine ligand; CXCL: c-x-c motif chemokine ligand; MIF: macrophage migration inhibitory factor; ANGPT: angiopoietin; VISFATIN: visfatin; ANGPTL: angiopoietin-like; CALCR: calcitonin receptor; EDN: endothelin; VEGF: vascular endothelial growth factor; PTN: pleiotrophin; PDGF: platelet-derived growth factor; GAS: gastrin; IGF: insuln-like growth factor; GALECTIN: galectin; TWEAK: tumor necrosis factor-like weak inducer of apoptosis; PROS: protein s; SEMA3: semaphorin 3; FGF: fibroblast growth factor; GDF: growth differentiation factor; PERIOSTIN: periostin.
Analysis of metabolic activity in ECs
Metabolic activity scores were calculated for each EC subpopulation [Figure 4A]. The LS group exhibited higher overall metabolic activity compared to both healthy controls and the SSC group. Comparative pathway analysis revealed a marked upregulation of oxidative phosphorylation (OXPHOS) in both LS and SSC relative to controls [Figure 4B], suggesting that metabolic reprogramming of ECs may contribute to disease pathogenesis by promoting immune activation. Differential analysis of metabolic pathways between Healthy vs. LS and Healthy vs. SSC [Figure 4C and D] further identified significant enrichment of the phosphonate and phosphinate metabolism pathway in both disease groups, implicating its potential role in immune-related processes in scleroderma. Moreover, additional metabolic differences were observed between LS and SSC [Figure 4E], highlighting disease subtype-specific metabolic alterations.
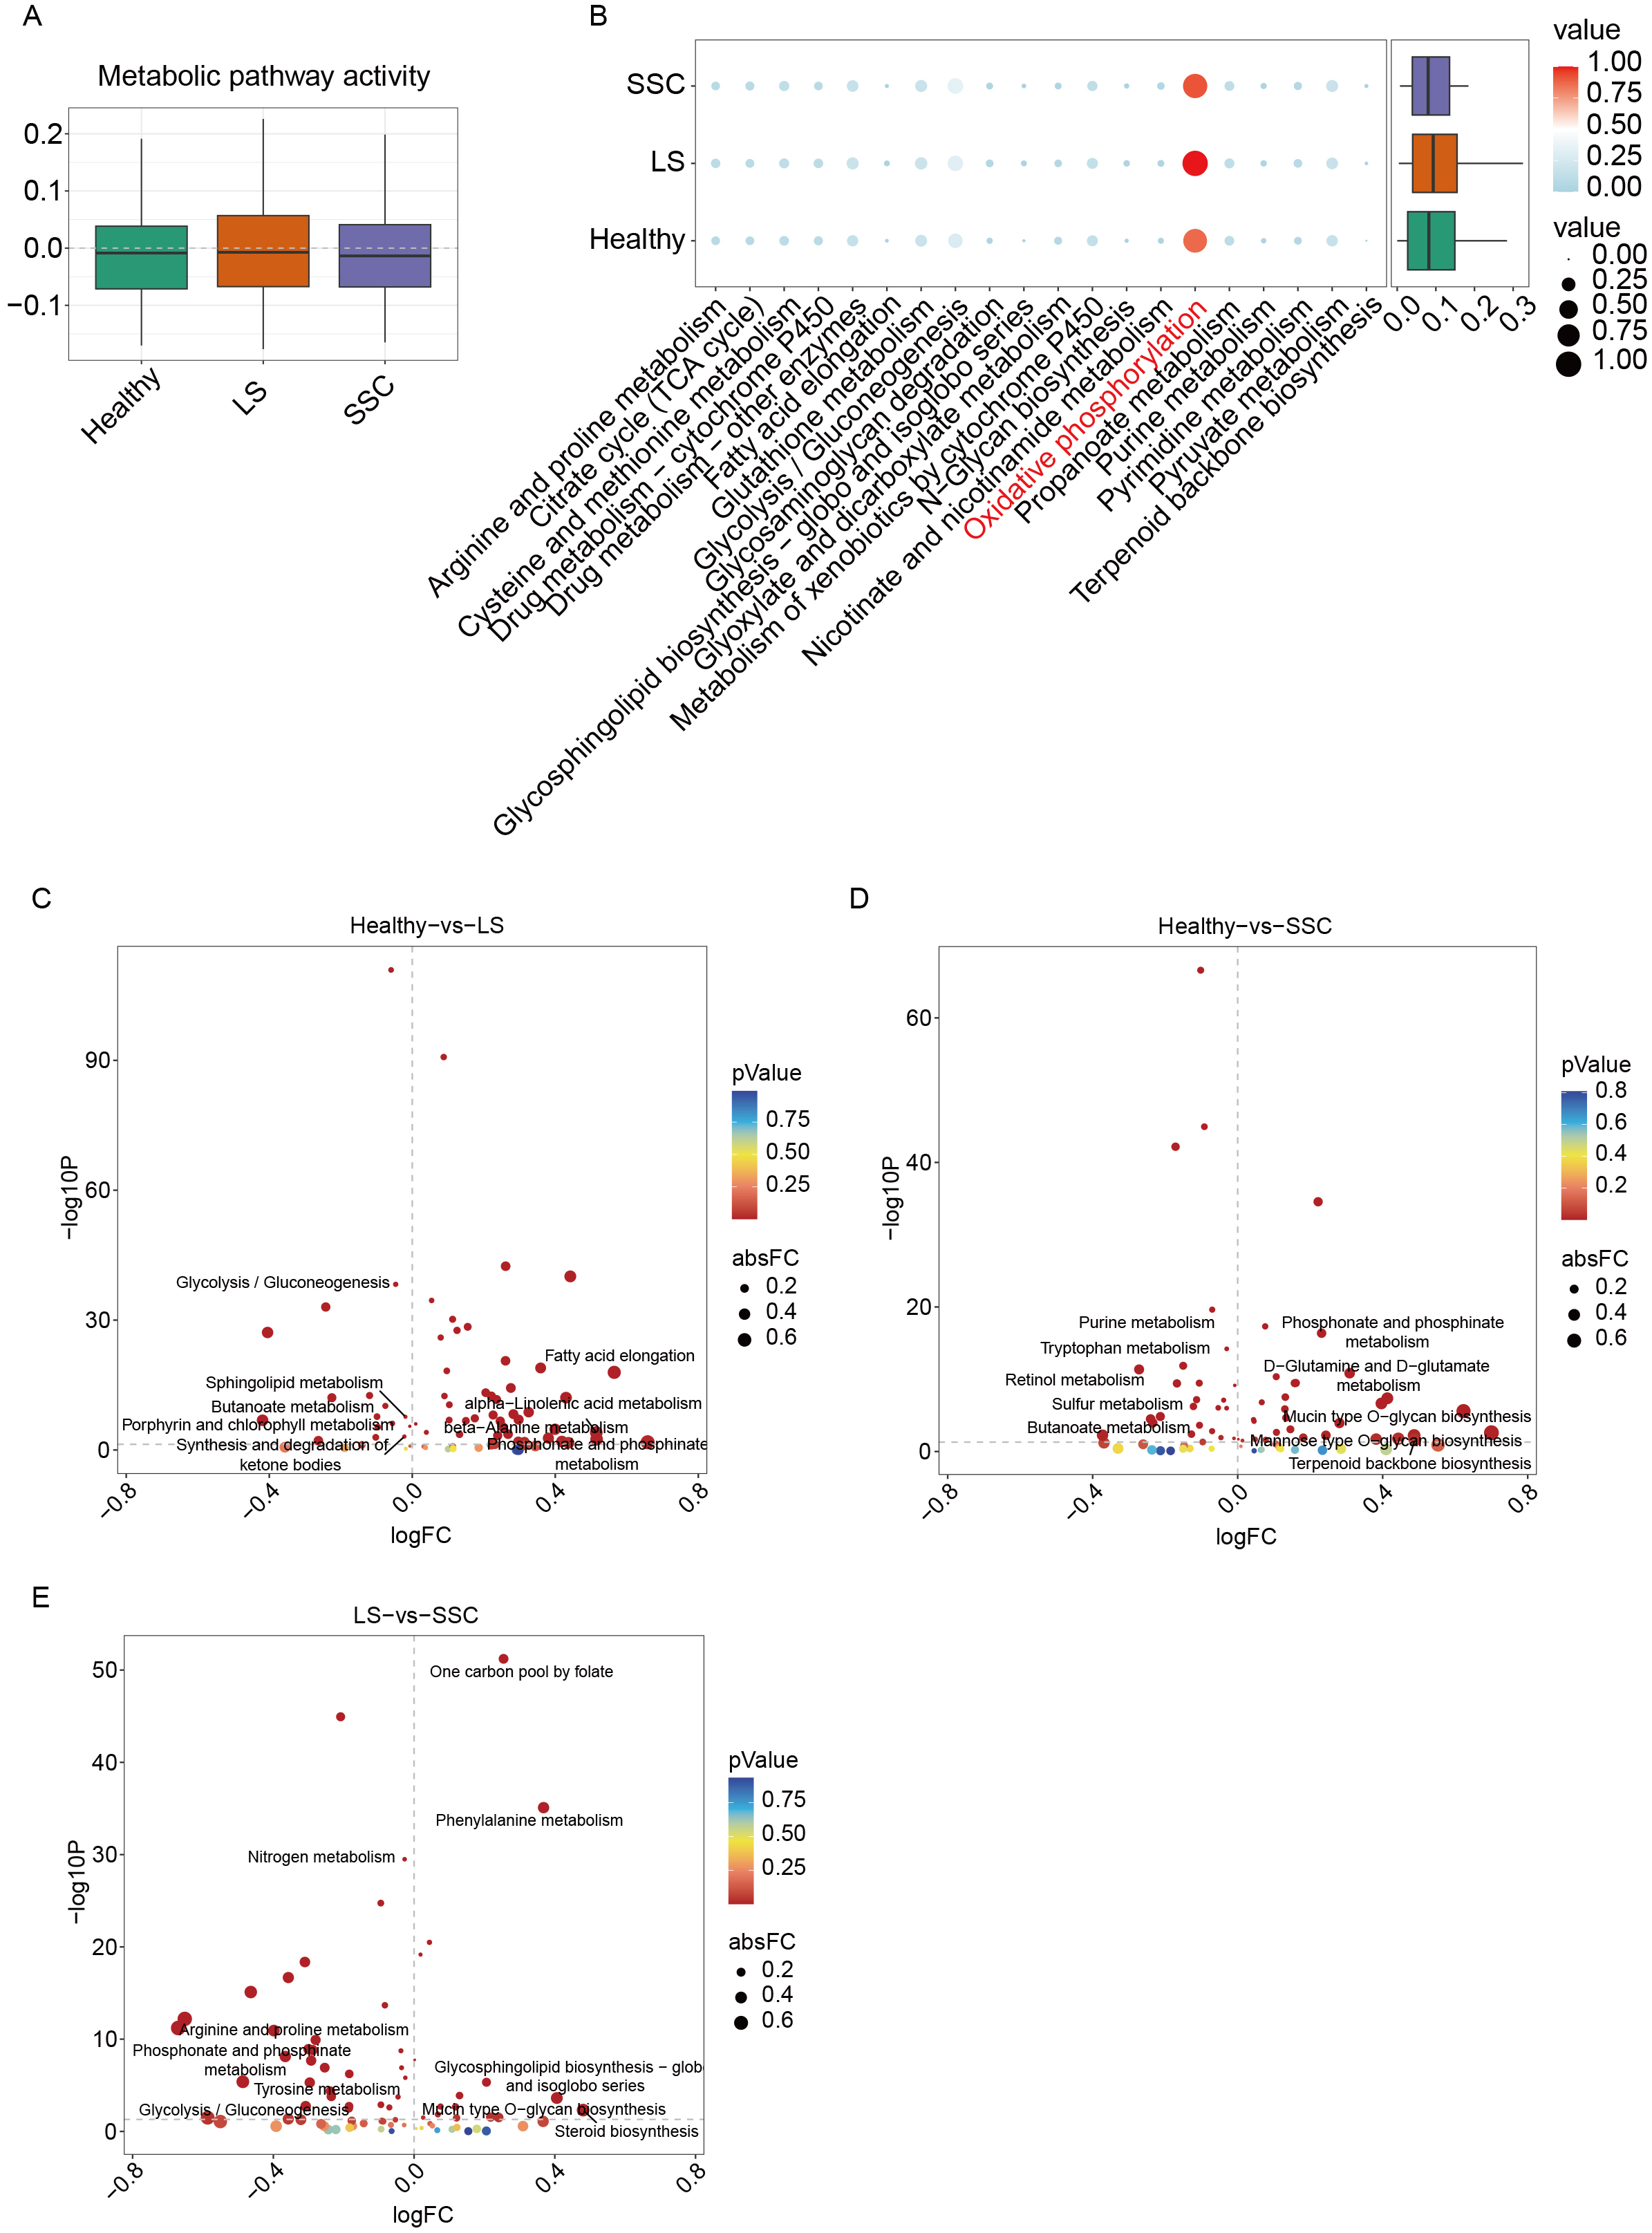
Figure 4. Metabolic activity assessment in ECs. (A) Box plot comparing metabolic activity across groups; (B) Dot plot showing differential expression of metabolic pathways between groups; (C) Differential metabolic pathway analysis between the normal and LS groups; the x-axis represents log fold change (logFC), and the y-axis represents -log10P values. The top five pathways ranked by fold change are labeled; (D) Differential analysis of metabolic pathway between the normal and SSC groups; (E) Differential analysis of metabolic pathway between the LS and SSC groups. ECs: Endothelial cells; SSC: systemic sclerosis; LS: localized scleroderma; TCA: tricarboxylic acid.
eQTL-based MR analysis
To explore whether metabolic reprogramming contributes causally to disease risk, we performed MR analysis using eQTL data for OXPHOS pathway genes and GWAS data for LS [Figure 5A]. Elevated expression of COX4I1 was causally associated with a decreased risk of LS, suggesting a potential protective effect. Figure 5B-D illustrates the MR scatter plot, forest plot, and leave-one-out sensitivity analysis. Although individual SNP estimates were not robust, the aggregated effect depicted by the red line demonstrated a consistent inverse association between COX4I1 expression and LS susceptibility, reinforcing the validity of the causal inference.
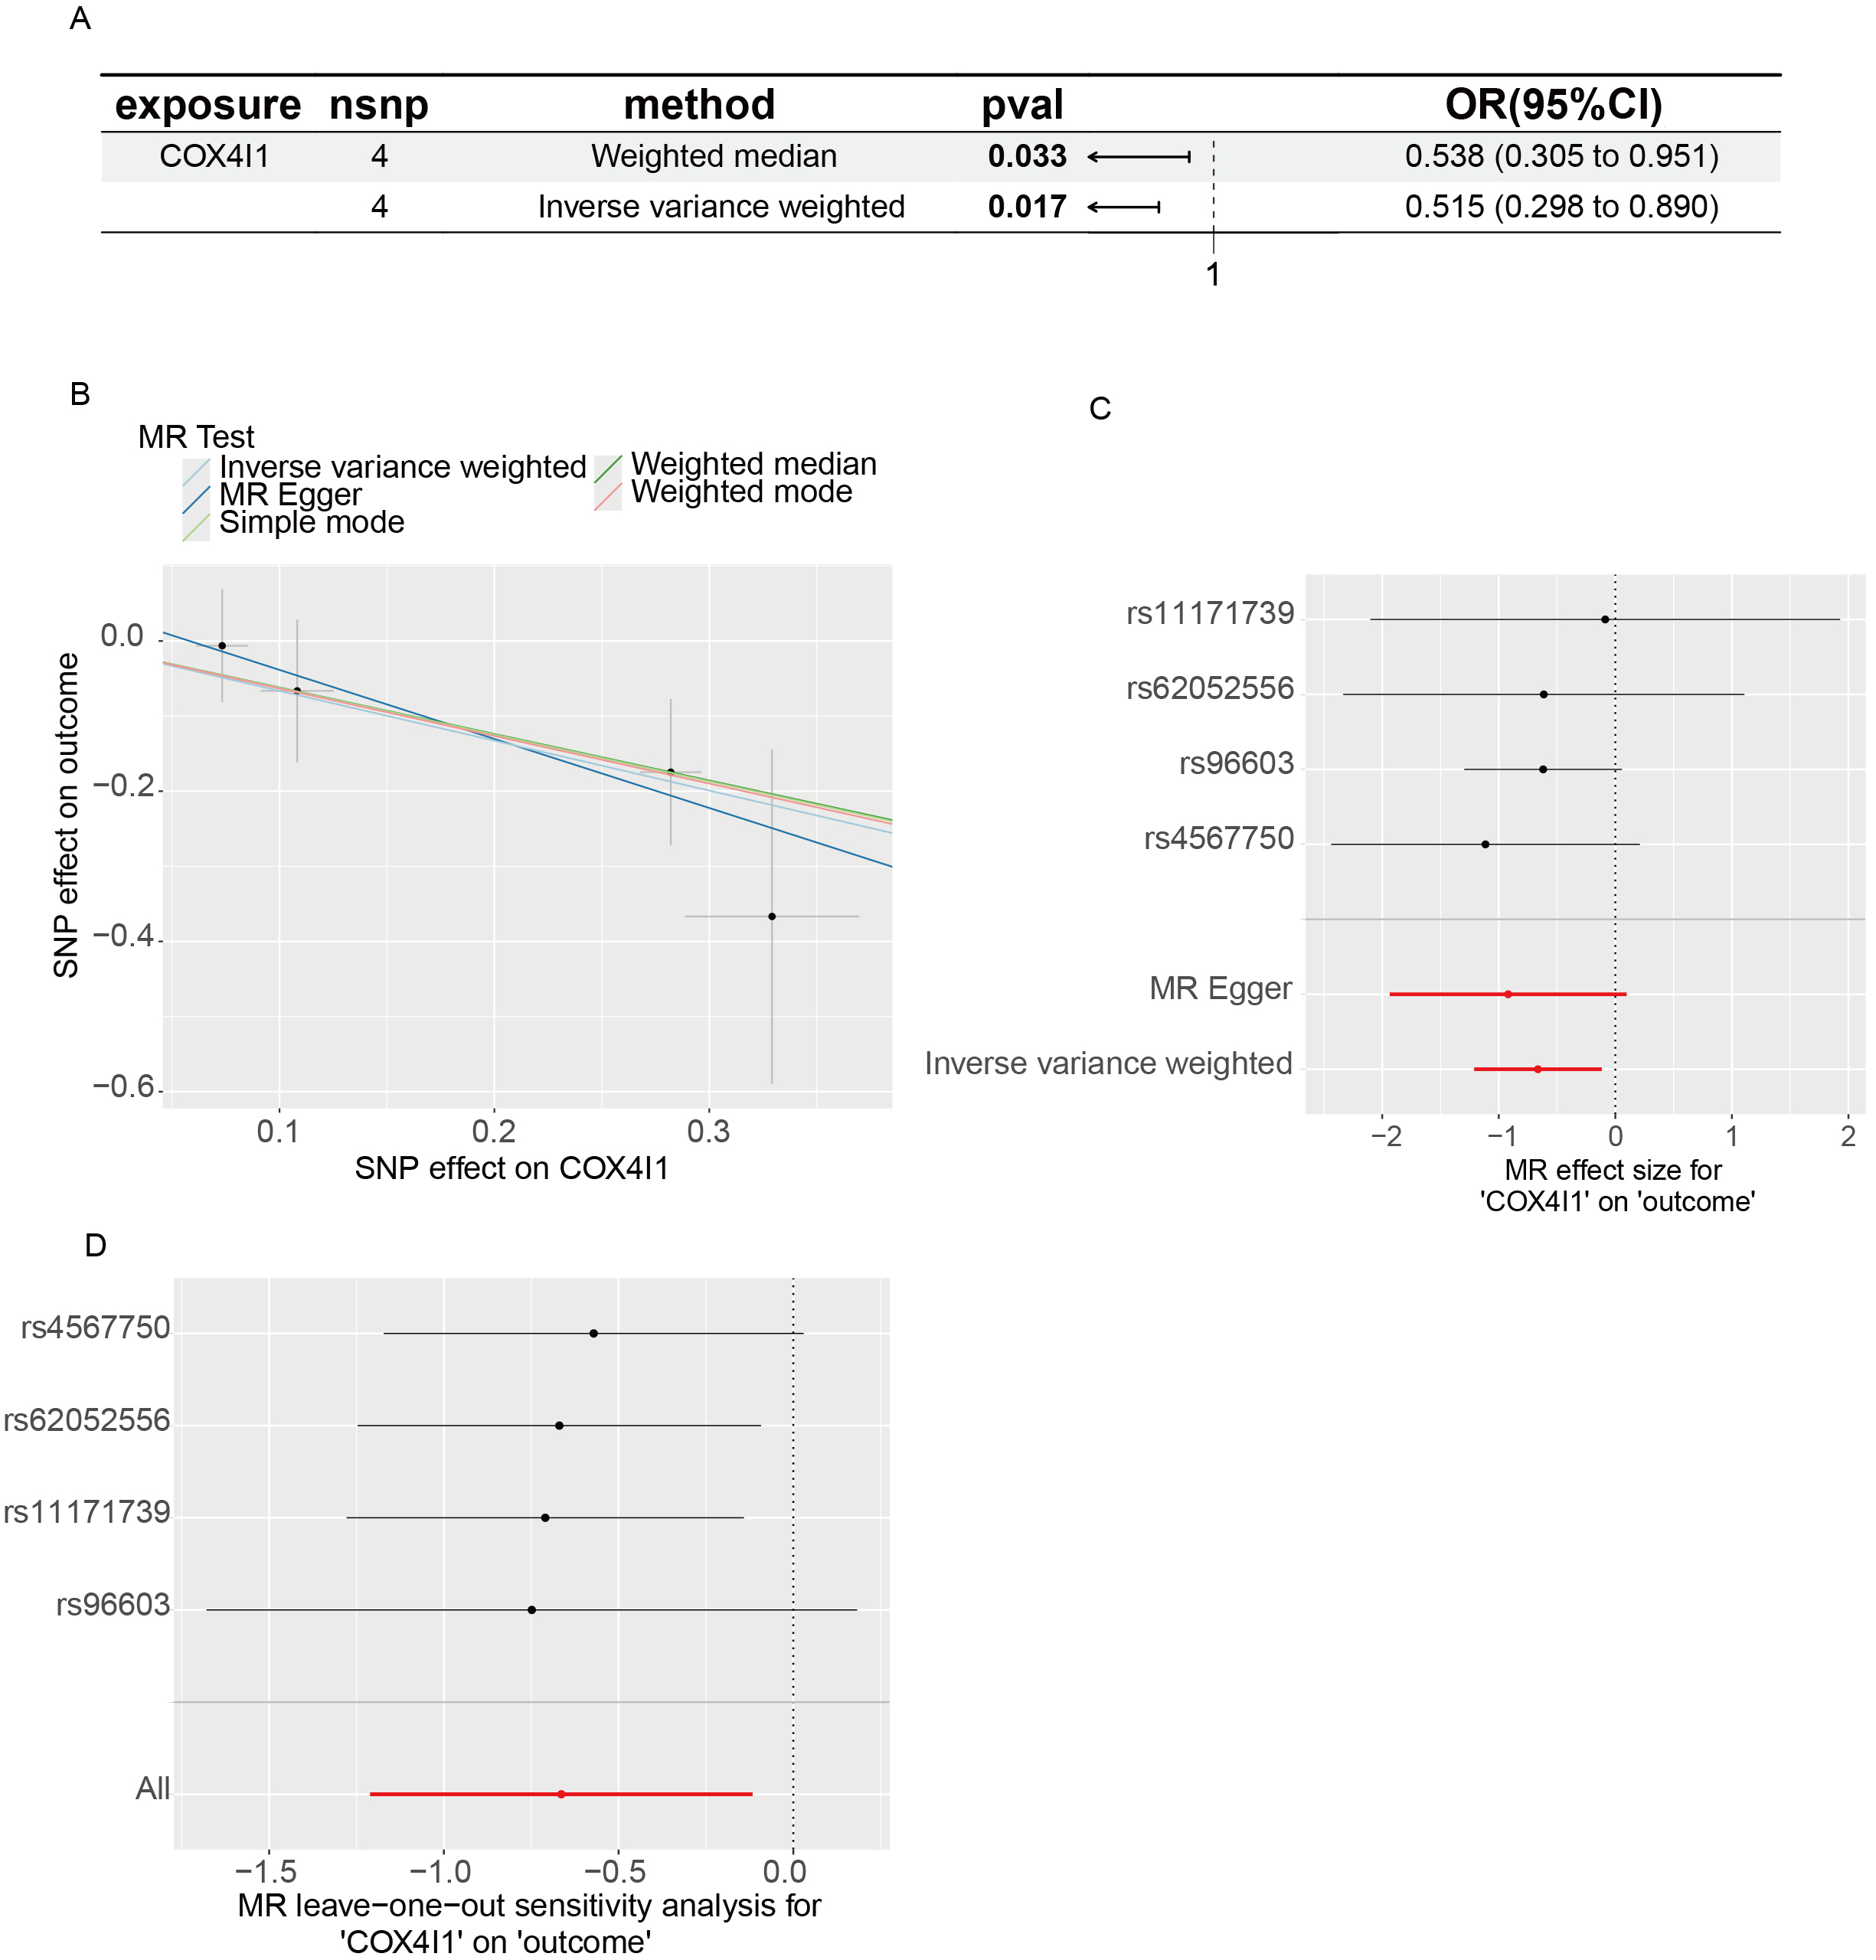
Figure 5. eQTL-Based MR results. (A) Scatter plot showing SNP-level associations between COX4I1 expression (exposure) and LS (outcome), with 95% confidence intervals; (B) MR effect estimates from multiple methods; slopes of colored lines reflect the causal relationship. A downward trend suggests that higher COX4I1 expression reduces LS risk; (C) Forest plot of individual SNP effects using the Wald ratio. Lines left of zero indicate protective effects; lines crossing zero are non-significant; (D) Leave-one-out sensitivity plot showing the stability of MR estimates when excluding each SNP in turn. MR: Mendelian randomization; eQTL: expression quantitative trait loci; LS: localized scleroderma; SNP: single nucleotide polymorphism; OR: odds ratio; CI: confidence interval.
DISCUSSION
Based on integrated single-cell transcriptomic data, our study provides a comprehensive characterization of EC subsets in both LS and SSC, focusing on intercellular communication patterns and metabolic features. We highlight the pivotal role of ECs in shaping the local immune-metabolic-fibrotic microenvironment in scleroderma. VenECs and MCs were identified as key nodes mediating interactions with myeloid cells. Additionally, the aberrant expression of regulators such as COX4I1 in specific EC subsets points to potential subtype-specific therapeutic targets for scleroderma.
In this study, we identified seven distinct EC subsets, among which VenECs and MCs occupied central positions in the cellular communication network, particularly demonstrating strong interactions with myeloid cells. VenECs were enriched in inflammatory pathways, such as leukocyte adhesion and T cell activation, indicating their critical role in immune cell recruitment and inflammatory dissemination. Nevertheless, foundational experiments are required to directly elucidate and validate the mechanistic roles of VenECs and MCs in immune regulation and fibrosis progression. Further analysis revealed highly active ligand-receptor interactions between ECs and myeloid cells, including monocytes, macrophages, and dendritic cells, particularly intensified in LS and SSC (Subclustering of myeloid cells shown in Supplementary Figure 1). This heightened myeloid-EC communication may form a positive feedback loop along the “immune-vascular axis” that amplifies local inflammation and accelerates fibrosis progression. This finding aligns with prior research in fibrotic diseases, demonstrating that ECs facilitate immune cell recruitment through mechanisms such as adhesion molecule expression, chemokine secretion, and macrophage activation[10,33,34]. Previous studies have demonstrated that Atypical Chemokine Receptor-1 (ACKR1)+ECs not only interact with myeloid cells but also recruit and activate a subset of sFRP2+ fibroblasts[35]. Mechanistically, interleukin-1β (IL-1β)-stimulated ECs secrete M2 macrophage-attracting chemokines, promoting the accumulation and activation of CD163+ macrophages, which in turn enhance local transforming growth factor-β (TGF-β) signaling and fibrotic responses[36]. This establishes a pathogenic “EC-immune-stromal” interaction loop that drives early fibrotic niche formation in SSC. These mechanisms expand upon the classical EndMT model, providing new insight into EC-driven fibrosis, and support our CellChat-based finding that VenECs exhibit enhanced recruitment of fibroblasts and upregulation of wingless-type mouse mammary tumor virus integration site family (WNT) pathway-related mediators.
Comparative analysis of EC subtypes revealed both shared and distinct mechanisms of endothelial dysfunction in LS and SSC. Both subtypes exhibited enhanced intercellular communication, upregulated OXPHOS, and activation of inflammation-related signaling pathways, suggesting that endothelial dysfunction may represent a common early pathological event in scleroderma. However, notable differences were observed in terms of EC subset composition, metabolic activity, and signaling activation patterns. In LS, a higher proportion of CXCL14+ VenECs and CapECs was noted, characterized by heightened metabolic activity indicative of sustained local stress responses. In contrast, SSC was dominated by VenECs and MCs, with enrichment in lipid metabolism and stress-related pathways, reflecting a state of chronic systemic activation. Notably, both subtypes showed activation of the MDK-NCL signaling pathway, which is known to regulate cell migration, proliferation, and immune activation in various chronic conditions, including cancer, cardiovascular disease, and pulmonary fibrosis[37-42]. Moreover, in TGF-β-stimulated ECs, MDK plays a key role in promoting fibrosis by stabilizing C/EBPβ, which leads to increased ACTA2 expression and induces a partial EndMT. This process drives the development of renal fibrosis by enhancing myofibroblast-like characteristics in ECs[43]. Additionally, studies on the midkine/pleiotrophin (MK/PTN) family of signaling molecules describe how their interaction with NCL regulates key cellular processes such as nuclear transport, cell migration, and survival mechanisms that are highly relevant to fibrotic disease progression[44]. Our study is the first to suggest its involvement in EC-immune interactions in scleroderma, highlighting its potential as a shared immune-response driver and a promising target for therapeutic intervention.
At the metabolic level, recent studies in SSC have highlighted a synergistic disruption of the vascular niche and mitochondrial integrity[45]. In our research, the mitochondrial metabolic gene COX4I1 was significantly downregulated in LS and showed a causal association with reduced disease risk. COX4I1 encodes a subunit of cytochrome C oxidase complex IV, a critical component of the mitochondrial respiratory chain[46]. Its downregulation may enhance OXPHOS efficiency, reduce reactive oxygen species (ROS) production, and improve cellular energy homeostasis, thereby mitigating endothelial oxidative stress and fibrogenic phenotypic transition[46-48]. In SSC, elevated OXPHOS activity and mitochondrial dysfunction are also prevalent, suggesting that COX4I1 may exert similar protective effects. We found that MK activation occurs earlier and is followed by increased OXPHOS gene expression, such as COX4I1. This suggests that MK may act upstream, driving EC metabolic reprogramming, and sustaining inflammation and fibrosis. Further validation such as metabolic flux assays, mitochondrial membrane potential analysis, and clustered regularly interspaced short palindromic repeats (CRISPR)-mediated knockout will be required to elucidate its subtype-specific roles. FABP4 is another key metabolic regulator, involved broadly in lipid transport, inflammatory regulation, and angiogenesis[49-51]. We report for the first time that FABP4 is significantly upregulated in ECs from SSc samples, with expression levels positively correlated with immune activation, intercellular communication strength, and fatty acid metabolism. FABP4 may serve as a regulatory node within the EC-macrophage-fibroblast axis. In vascular inflammation, it induces intercellular adhesion molecule-1 (ICAM-1) and vascular cell adhesion molecule-1 (VCAM-1) expression, suppresses endothelial nitric oxide synthase (eNOS) activity, and disrupts EC homeostasis[52]. In human umbilical vein ECs (HUVECs), it also modulates angiogenesis through p38 mitogen-activated protein kinase (MAPK), stem cell factor (SCF)/antibody against SCF receptor (c-kit), and mechanistic target of rapamycin complex 1 (mTORC1) pathways[53-55]. Taken together, these findings identify FABP4 as a pro-inflammatory metabolic mediator with promising druggability.
Based on our findings, we propose that in early scleroderma, MDK-NCL activation drives abnormal immune-vascular interactions, recruiting immune cells and establishing a persistent inflammatory niche. During this stage, COX4I1 helps maintain OXPHOS balance, limits oxidative stress, and delays endothelial transition to a pro-fibrotic state. As the disease progresses, COX4I1 protection diminishes and FABP4 levels rise, disrupting lipid metabolism and amplifying EC-immune-fibroblast interactions. This shifts the system from protection to imbalance and drives progression from vascular inflammation to widespread fibrosis, positioning COX4I1 as a key target and FABP4 as a complementary intervention point. Our study offers new insights into EC heterogeneity and immune-metabolic crosstalk in scleroderma, but several limitations should be noted. First, our analyses relied on integrated scRNA-seq datasets, which are subject to technical noise such as batch effects and dropout events. Although Harmony integration was applied to mitigate these issues, subtle biases may persist. Furthermore, the cross-sectional design captures only static snapshots of the disease, limiting our ability to track dynamic changes or confirm predicted cell state transitions over time. Our research yielded novel insights into intercellular communication, activation pathways, and key molecular mechanisms in scleroderma; however, these findings remain relatively superficial and fragmented, with their intrinsic connections still at the hypothetical stage, necessitating further analysis and experimental validation. Lastly, the datasets included limited patient diversity, which may restrict the generalizability of our results. Future studies using longitudinal sampling, functional experiments, and larger, more diverse cohorts will be essential to confirm and extend these findings.
This study presents for the first time a comprehensive single-cell transcriptomic comparison of EC heterogeneity in LS and SSC, identifying distinct subtype-specific differences in EC subset composition, intercellular communication, and metabolic activity. CellChat analysis revealed enhanced communication between myeloid cells and ECs, supporting the establishment of an “immune-vascular” synergistic pathological mechanism. Our findings position ECs as central hubs integrating inflammation, metabolism, and fibrosis in scleroderma. Notably, tripartite interactions among VenECs/MCs, myeloid cells, and fibroblasts appear to be critical drivers of early disease progression. COX4I1 and FABP4 were identified as key markers and regulatory factors of EC functional states, offering potential subtype-specific therapeutic targets.
DECLARATIONS
Authors’ contributions
Conceptualized the manuscript: Lu Y, Yue Z
Contributed to data collection and literature review: Kishengere MA, Lu Y, Li Y, Yue Z
Contributed to the writing and editing of the manuscript: Kishengere MA, Li Y, Yue Z
Availability of data and materials
Data and materials are available from the corresponding author upon reasonable request.
Financial support and sponsorship
None.
Conflicts of interest
All authors declared that there are no conflicts of interest.
Ethical approval and consent to participate
Ethical approval and informed consent were not required for this study because all data were obtained from publicly available, de-identified datasets in the Gene Expression Omnibus (GEO) database. These datasets are freely accessible under open licenses.
Consent for publication
Not applicable.
Copyright
© The Author(s) 2025.
Supplementary Materials
REFERENCES
1. Ferreli C, Gasparini G, Parodi A, Cozzani E, Rongioletti F, Atzori L. Cutaneous manifestations of scleroderma and scleroderma-like disorders: a comprehensive review. Clin Rev Allergy Immunol. 2017;53:306-36.
2. Patnaik E, Lyons M, Tran K, Pattanaik D. Endothelial dysfunction in systemic sclerosis. Int J Mol Sci. 2023;24:14385.
3. Nilforoushzadeh MA, Heidari A, Ghane Y, et al. Efficacy and safety of platelet-rich plasma therapy in systemic sclerosis and localized scleroderma; a systematic review. Arch Dermatol Res. 2025;317:504.
4. Vasquez R, Sendejo C, Jacobe H. Morphea and other localized forms of scleroderma. Curr Opin Rheumatol. 2012;24:685-93.
5. McMahan ZH, Hummers LK. Systemic sclerosis-challenges for clinical practice. Nat Rev Rheumatol. 2013;9:90-100.
7. Florez-Pollack S, Kunzler E, Jacobe HT. Morphea: current concepts. Clin Dermatol. 2018;36:475-86.
8. Snarskaya ES, Vasileva KD. Localized scleroderma: actual insights and new biomarkers. Int J Dermatol. 2022;61:667-74.
9. Allanore Y, Assassi S. Systemic sclerosis: a multisystem disease; time to think beyond scleroderma. Arthritis Rheumatol. 2025;77:805-7.
10. Sun X, Nkennor B, Mastikhina O, Soon K, Nunes SS. Endothelium-mediated contributions to fibrosis. Semin Cell Dev Biol. 2020;101:78-86.
11. Laplante P, Sirois I, Raymond MA, et al. Caspase-3-mediated secretion of connective tissue growth factor by apoptotic endothelial cells promotes fibrosis. Cell Death Differ. 2010;17:291-303.
12. Maurer B, Distler A, Suliman YA, et al. Vascular endothelial growth factor aggravates fibrosis and vasculopathy in experimental models of systemic sclerosis. Ann Rheum Dis. 2014;73:1880-7.
13. Manetti M, Romano E, Rosa I, et al. Endothelial-to-mesenchymal transition contributes to endothelial dysfunction and dermal fibrosis in systemic sclerosis. Ann Rheum Dis. 2017;76:924-34.
14. Pérez L, Muñoz-Durango N, Riedel CA, et al. Endothelial-to-mesenchymal transition: Cytokine-mediated pathways that determine endothelial fibrosis under inflammatory conditions. Cytokine Growth Factor Rev. 2017;33:41-54.
15. Barron L, Wynn TA. Fibrosis is regulated by Th2 and Th17 responses and by dynamic interactions between fibroblasts and macrophages. Am J Physiol Gastrointest Liver Physiol. 2011;300:G723-8.
16. Kantari-Mimoun C, Castells M, Klose R, et al. Resolution of liver fibrosis requires myeloid cell-driven sinusoidal angiogenesis. Hepatology. 2015;61:2042-55.
17. Hsu T, Nguyen-Tran HH, Trojanowska M. Active roles of dysfunctional vascular endothelium in fibrosis and cancer. J Biomed Sci. 2019;26:86.
18. Tang PM, Nikolic-Paterson DJ, Lan HY. Macrophages: versatile players in renal inflammation and fibrosis. Nat Rev Nephrol. 2019;15:144-58.
19. Baci D, Bosi A, Parisi L, et al. Innate immunity effector cells as inflammatory drivers of cardiac fibrosis. Int J Mol Sci. 2020;21:7165.
20. Matsuda M, Seki E. The liver fibrosis niche: Novel insights into the interplay between fibrosis-composing mesenchymal cells, immune cells, endothelial cells, and extracellular matrix. Food Chem Toxicol. 2020;143:111556.
21. Tsou PS, Wren JD, Amin MA, et al. Histone deacetylase 5 is overexpressed in scleroderma endothelial cells and impairs angiogenesis via repression of proangiogenic factors. Arthritis Rheumatol. 2016;68:2975-85.
22. Zhu H, Chen W, Liu D, Luo H. The role of metabolism in the pathogenesis of systemic sclerosis. Metabolism. 2019;93:44-51.
23. Coit P, Schollaert KL, Mirizio EM, Torok KS, Sawalha AH. DNA methylation patterns in juvenile systemic sclerosis and localized scleroderma. Clin Immunol. 2021;228:108756.
24. Makino T, Jinnin M, Etoh M, et al. Down-regulation of microRNA-196a in the sera and involved skin of localized scleroderma patients. Eur J Dermatol. 2014;24:470-6.
25. Wang Y, Sun J, Kahaleh B. Epigenetic down-regulation of microRNA-126 in scleroderma endothelial cells is associated with impaired responses to VEGF and defective angiogenesis. J Cell Mol Med. 2021;25:7078-88.
26. Butler A, Hoffman P, Smibert P, Papalexi E, Satija R. Integrating single-cell transcriptomic data across different conditions, technologies, and species. Nat Biotechnol. 2018;36:411-20.
27. Jin S, Guerrero-Juarez CF, Zhang L, et al. Inference and analysis of cell-cell communication using CellChat. Nat Commun. 2021;12:1088.
28. Tirosh I, Izar B, Prakadan SM, et al. Dissecting the multicellular ecosystem of metastatic melanoma by single-cell RNA-seq. Science. 2016;352:189-96.
29. Stuart T, Butler A, Hoffman P, et al. Comprehensive integration of single-cell data. Cell. 2019;177:1888-1902.e21.
30. Satija R, Farrell JA, Gennert D, Schier AF, Regev A. Spatial reconstruction of single-cell gene expression data. Nat Biotechnol. 2015;33:495-502.
31. Trapnell C, Cacchiarelli D, Grimsby J, et al. The dynamics and regulators of cell fate decisions are revealed by pseudotemporal ordering of single cells. Nat Biotechnol. 2014;32:381-6.
32. Wu Y, Yang S, Ma J, et al. Spatiotemporal immune landscape of colorectal cancer liver metastasis at single-cell level. Cancer Discov. 2022;12:134-53.
33. To S, Agarwal SK. Macrophages and cadherins in fibrosis and systemic sclerosis. Curr Opin Rheumatol. 2019;31:582-8.
34. Jia H, Yue G, Li P, et al. Neutrophil extracellular traps license macrophage production of chemokines to facilitate CD8+ T cell infiltration in obstruction-induced renal fibrosis. Protein Cell. ;2025:pwaf020.
35. Huang Y, Pu W, Wang L, et al. Atypical chemokine receptor 1-positive endothelial cells mediate leucocyte infiltration and synergize with secreted frizzled-related protein 2/asporin-positive fibroblasts to promote skin fibrosis in systemic sclerosis. Br J Dermatol. 2024;191:964-78.
36. Laurent P, Lapoirie J, Leleu D, et al.; Fédération Hospitalo-Universitaire ACRONIM and the Centre National de Référence des Maladies Auto-Immunes Systémiques Rares de l’Est et du Sud-Ouest (RESO). Interleukin-1β-activated microvascular endothelial cells promote DC-SIGN-positive alternatively activated macrophages as a mechanism of skin fibrosis in systemic sclerosis. Arthritis Rheumatol. 2022;74:1013-26.
37. Jankauskas SS, Wong DWL, Bucala R, Djudjaj S, Boor P. Evolving complexity of MIF signaling. Cell Signal. 2019;57:76-88.
38. Filippou PS, Karagiannis GS, Constantinidou A. Midkine (MDK) growth factor: a key player in cancer progression and a promising therapeutic target. Oncogene. 2020;39:2040-54.
39. Gan C, Wang Y, Xiang Z, et al. Niclosamide-loaded nanoparticles (Ncl-NPs) reverse pulmonary fibrosis in vivo and in vitro. J Adv Res. 2023;51:109-20.
40. Sun HL, Ma QY, Bian HG, Meng XM, Jin J. Novel insight on GRP/GRPR axis in diseases. Biomed Pharmacother. 2023;161:114497.
41. Russo RC, Ryffel B. The chemokine system as a key regulator of pulmonary fibrosis: converging pathways in human idiopathic pulmonary fibrosis (IPF) and the bleomycin-induced lung fibrosis model in mice. Cells. 2024;13:2058.
42. Fu Y, Li S, Zhao Y, Zhang X, Mao X, Xu R. Integrative single-cell and spatial transcriptomics analysis reveals MDK-NCL pathway’s role in shaping the immunosuppressive environment of lung adenocarcinoma. Front Immunol. 2025;16:1546382.
43. Xu C, Chen J, Liang L, et al. Midkine promotes renal fibrosis by stabilizing C/EBPβ to facilitate endothelial-mesenchymal transition. Commun Biol. 2024;7:544.
44. Sorrelle N, Dominguez ATA, Brekken RA. From top to bottom: midkine and pleiotrophin as emerging players in immune regulation. J Leukoc Biol. 2017;102:277-86.
45. Rius Rigau A, Li YN, Matei AE, et al. Characterization of Vascular Niche in Systemic Sclerosis by Spatial Proteomics. Circ Res. 2024;134:875-91.
46. Zhang L, Zhang H, Wang TY, et al. Nuclear control of mitochondrial homeostasis and venetoclax efficacy in AML via COX4I1. Adv Sci. 2025;12:e2404620.
47. Xu M, Ma Q, Fan C, Chen X, Zhang H, Tang M. Ginsenosides Rb1 and Rg1 protect primary cultured astrocytes against oxygen-glucose deprivation/reoxygenation-induced injury via improving mitochondrial function. Int J Mol Sci. 2019;20:6086.
48. Xie T, Wang C, Jin Y, et al. CoenzymeQ10-induced activation of AMPK-YAP-OPA1 pathway alleviates atherosclerosis by improving mitochondrial function, inhibiting oxidative stress and promoting energy metabolism. Front Pharmacol. 2020;11:1034.
49. Yu L, Wei W, Lv J, Lu Y, Wang Z, Cai C. FABP4-mediated lipid metabolism promotes TNBC progression and breast cancer stem cell activity. Cancer Lett. 2024;604:217271.
50. Qiao Y, Liu L, Yin L, et al. FABP4 contributes to renal interstitial fibrosis via mediating inflammation and lipid metabolism. Cell Death Dis. 2019;10:382.
51. Wu X, Shu L, Zhang Z, et al. Adipocyte fatty acid binding protein promotes the onset and progression of liver fibrosis via mediating the crosstalk between liver sinusoidal endothelial cells and hepatic stellate cells. Adv Sci. 2021;8:e2003721.
52. Wu YW, Chang TT, Chang CC, Chen JW. Fatty-acid-binding protein 4 as a novel contributor to mononuclear cell activation and endothelial cell dysfunction in atherosclerosis. Int J Mol Sci. 2020;21:9245.
53. Elmasri H, Ghelfi E, Yu CW, et al. Endothelial cell-fatty acid binding protein 4 promotes angiogenesis: role of stem cell factor/c-kit pathway. Angiogenesis. 2012;15:457-68.
54. Guo D, Lin C, Lu Y, et al. FABP4 secreted by M1-polarized macrophages promotes synovitis and angiogenesis to exacerbate rheumatoid arthritis. Bone Res. 2022;10:45.
Cite This Article
How to Cite
Download Citation
Export Citation File:
Type of Import
Tips on Downloading Citation
Citation Manager File Format
Type of Import
Direct Import: When the Direct Import option is selected (the default state), a dialogue box will give you the option to Save or Open the downloaded citation data. Choosing Open will either launch your citation manager or give you a choice of applications with which to use the metadata. The Save option saves the file locally for later use.
Indirect Import: When the Indirect Import option is selected, the metadata is displayed and may be copied and pasted as needed.
About This Article
Copyright

Data & Comments
Data
0


Comments
Comments must be written in English. Spam, offensive content, impersonation, and private information will not be permitted. If any comment is reported and identified as inappropriate content by OAE staff, the comment will be removed without notice. If you have any queries or need any help, please contact us at [email protected].