


fig5
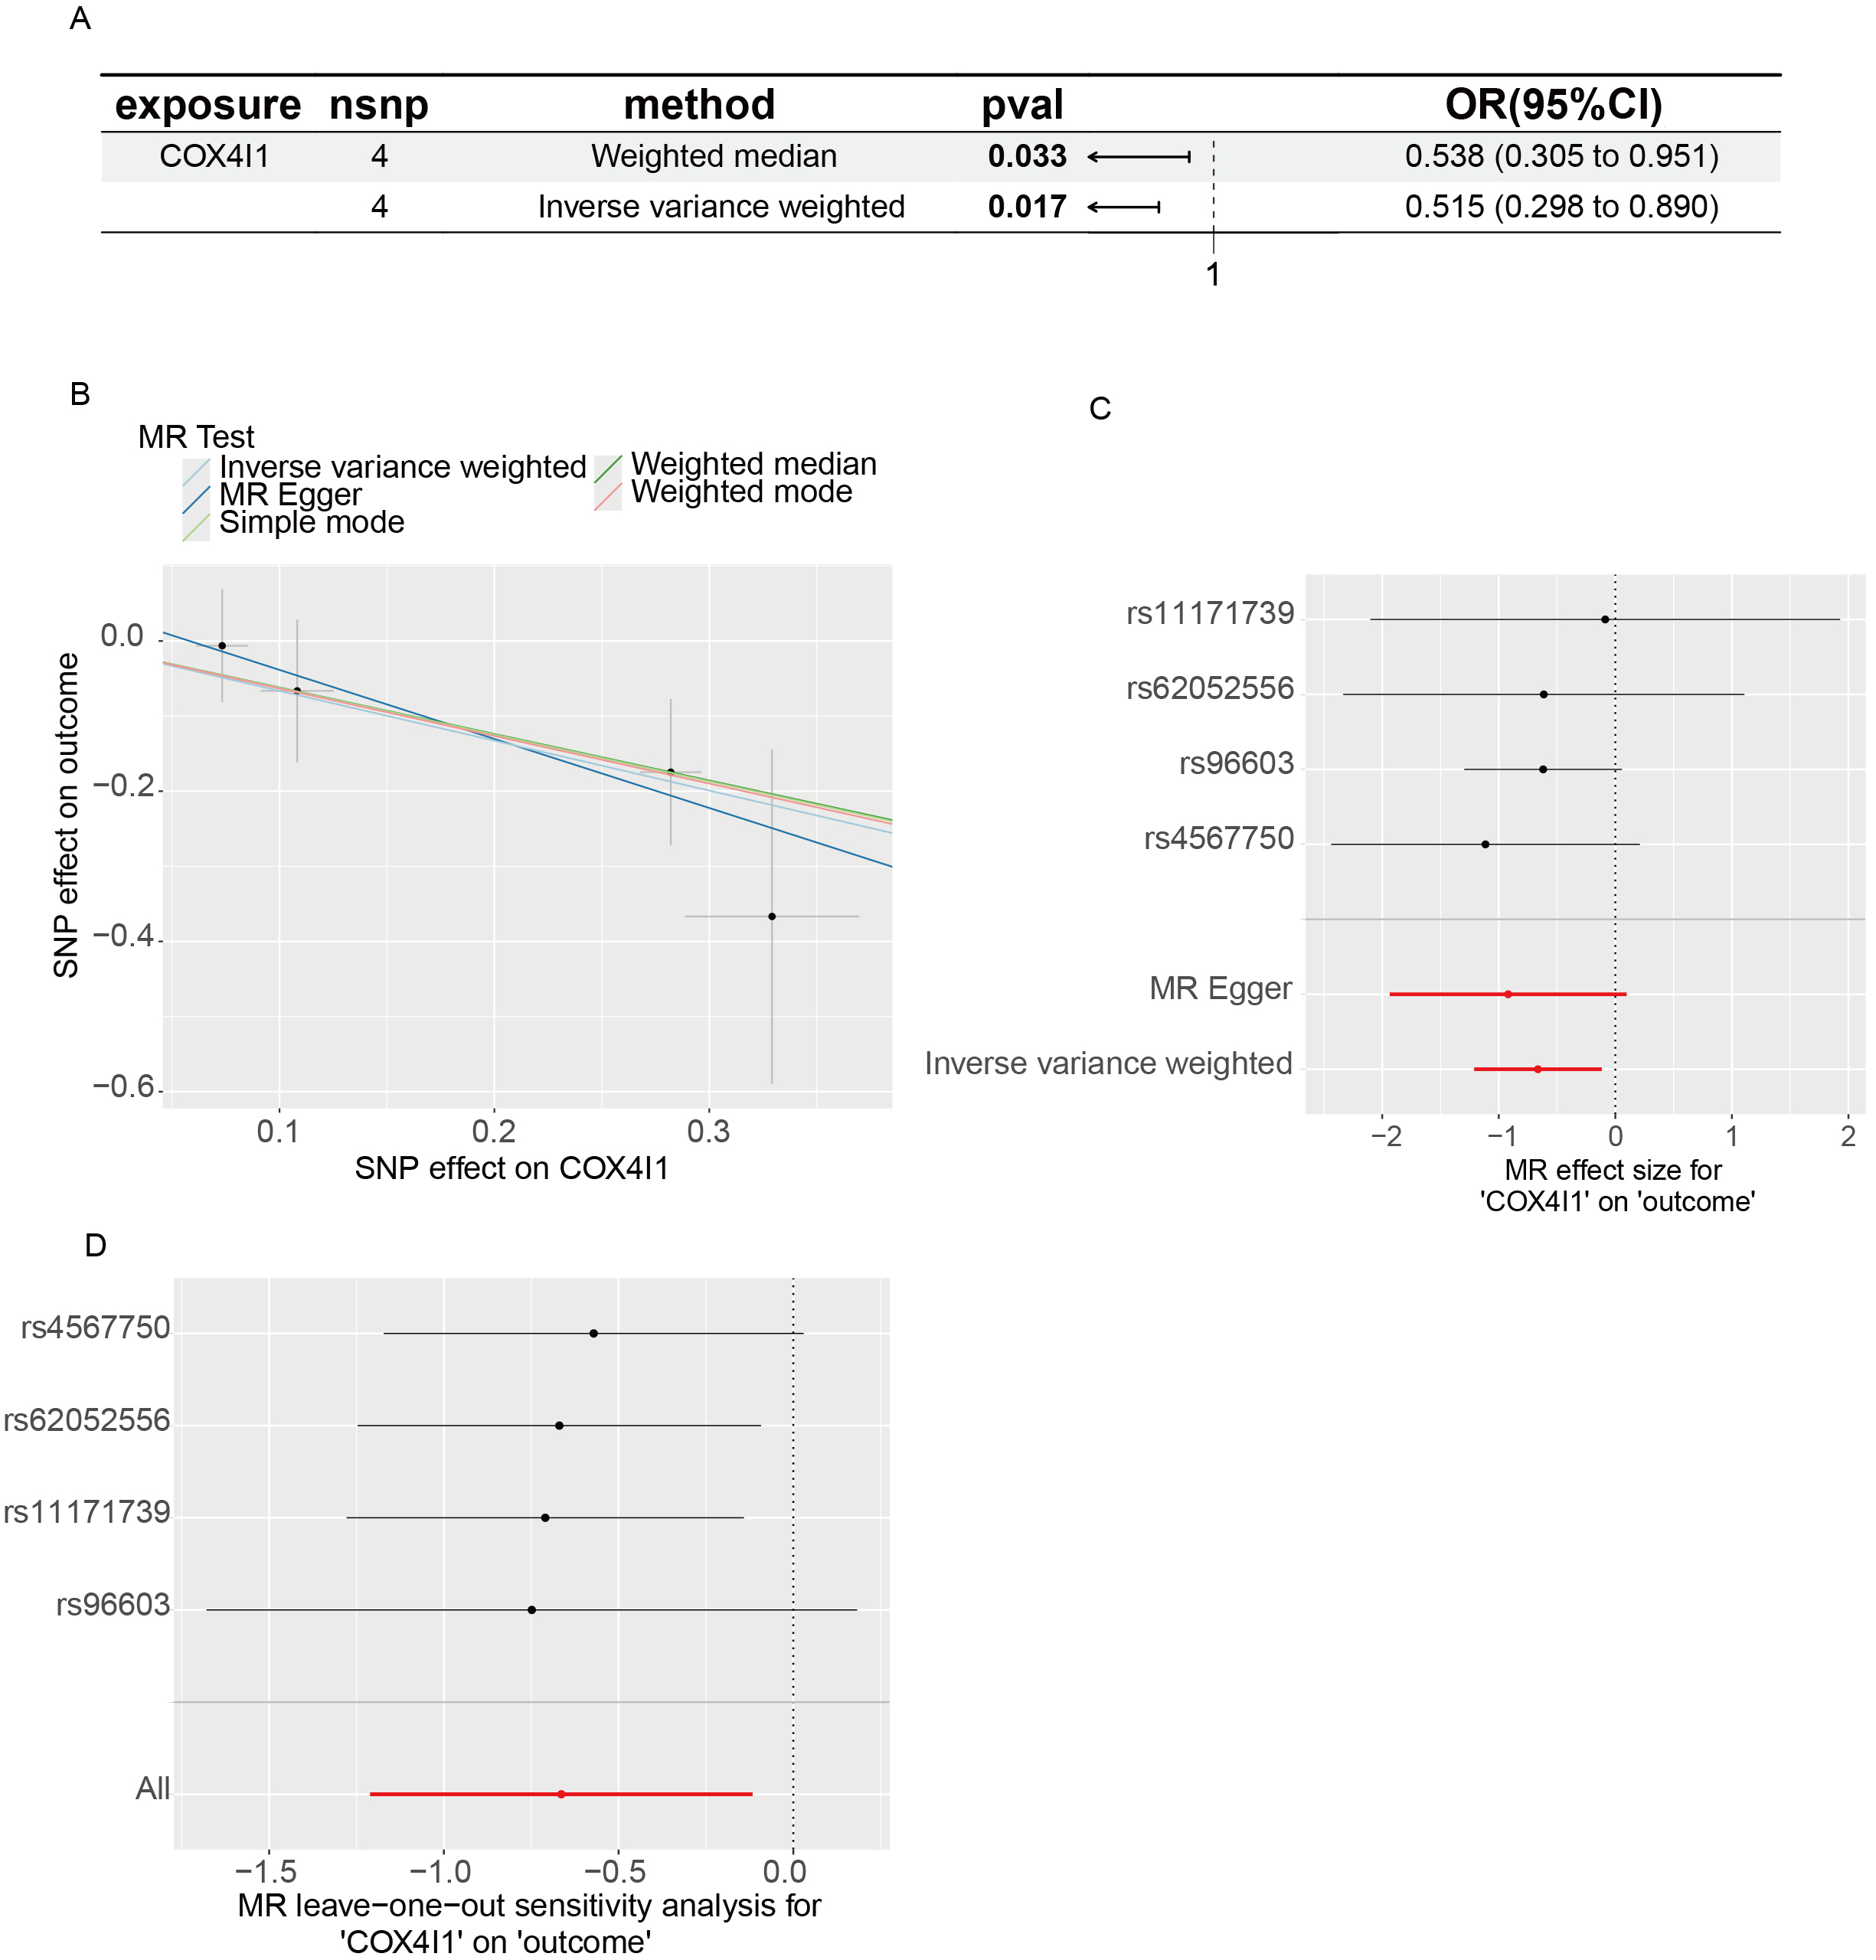
Figure 5. eQTL-Based MR results. (A) Scatter plot showing SNP-level associations between COX4I1 expression (exposure) and LS (outcome), with 95% confidence intervals; (B) MR effect estimates from multiple methods; slopes of colored lines reflect the causal relationship. A downward trend suggests that higher COX4I1 expression reduces LS risk; (C) Forest plot of individual SNP effects using the Wald ratio. Lines left of zero indicate protective effects; lines crossing zero are non-significant; (D) Leave-one-out sensitivity plot showing the stability of MR estimates when excluding each SNP in turn. MR: Mendelian randomization; eQTL: expression quantitative trait loci; LS: localized scleroderma; SNP: single nucleotide polymorphism; OR: odds ratio; CI: confidence interval.


