


fig3
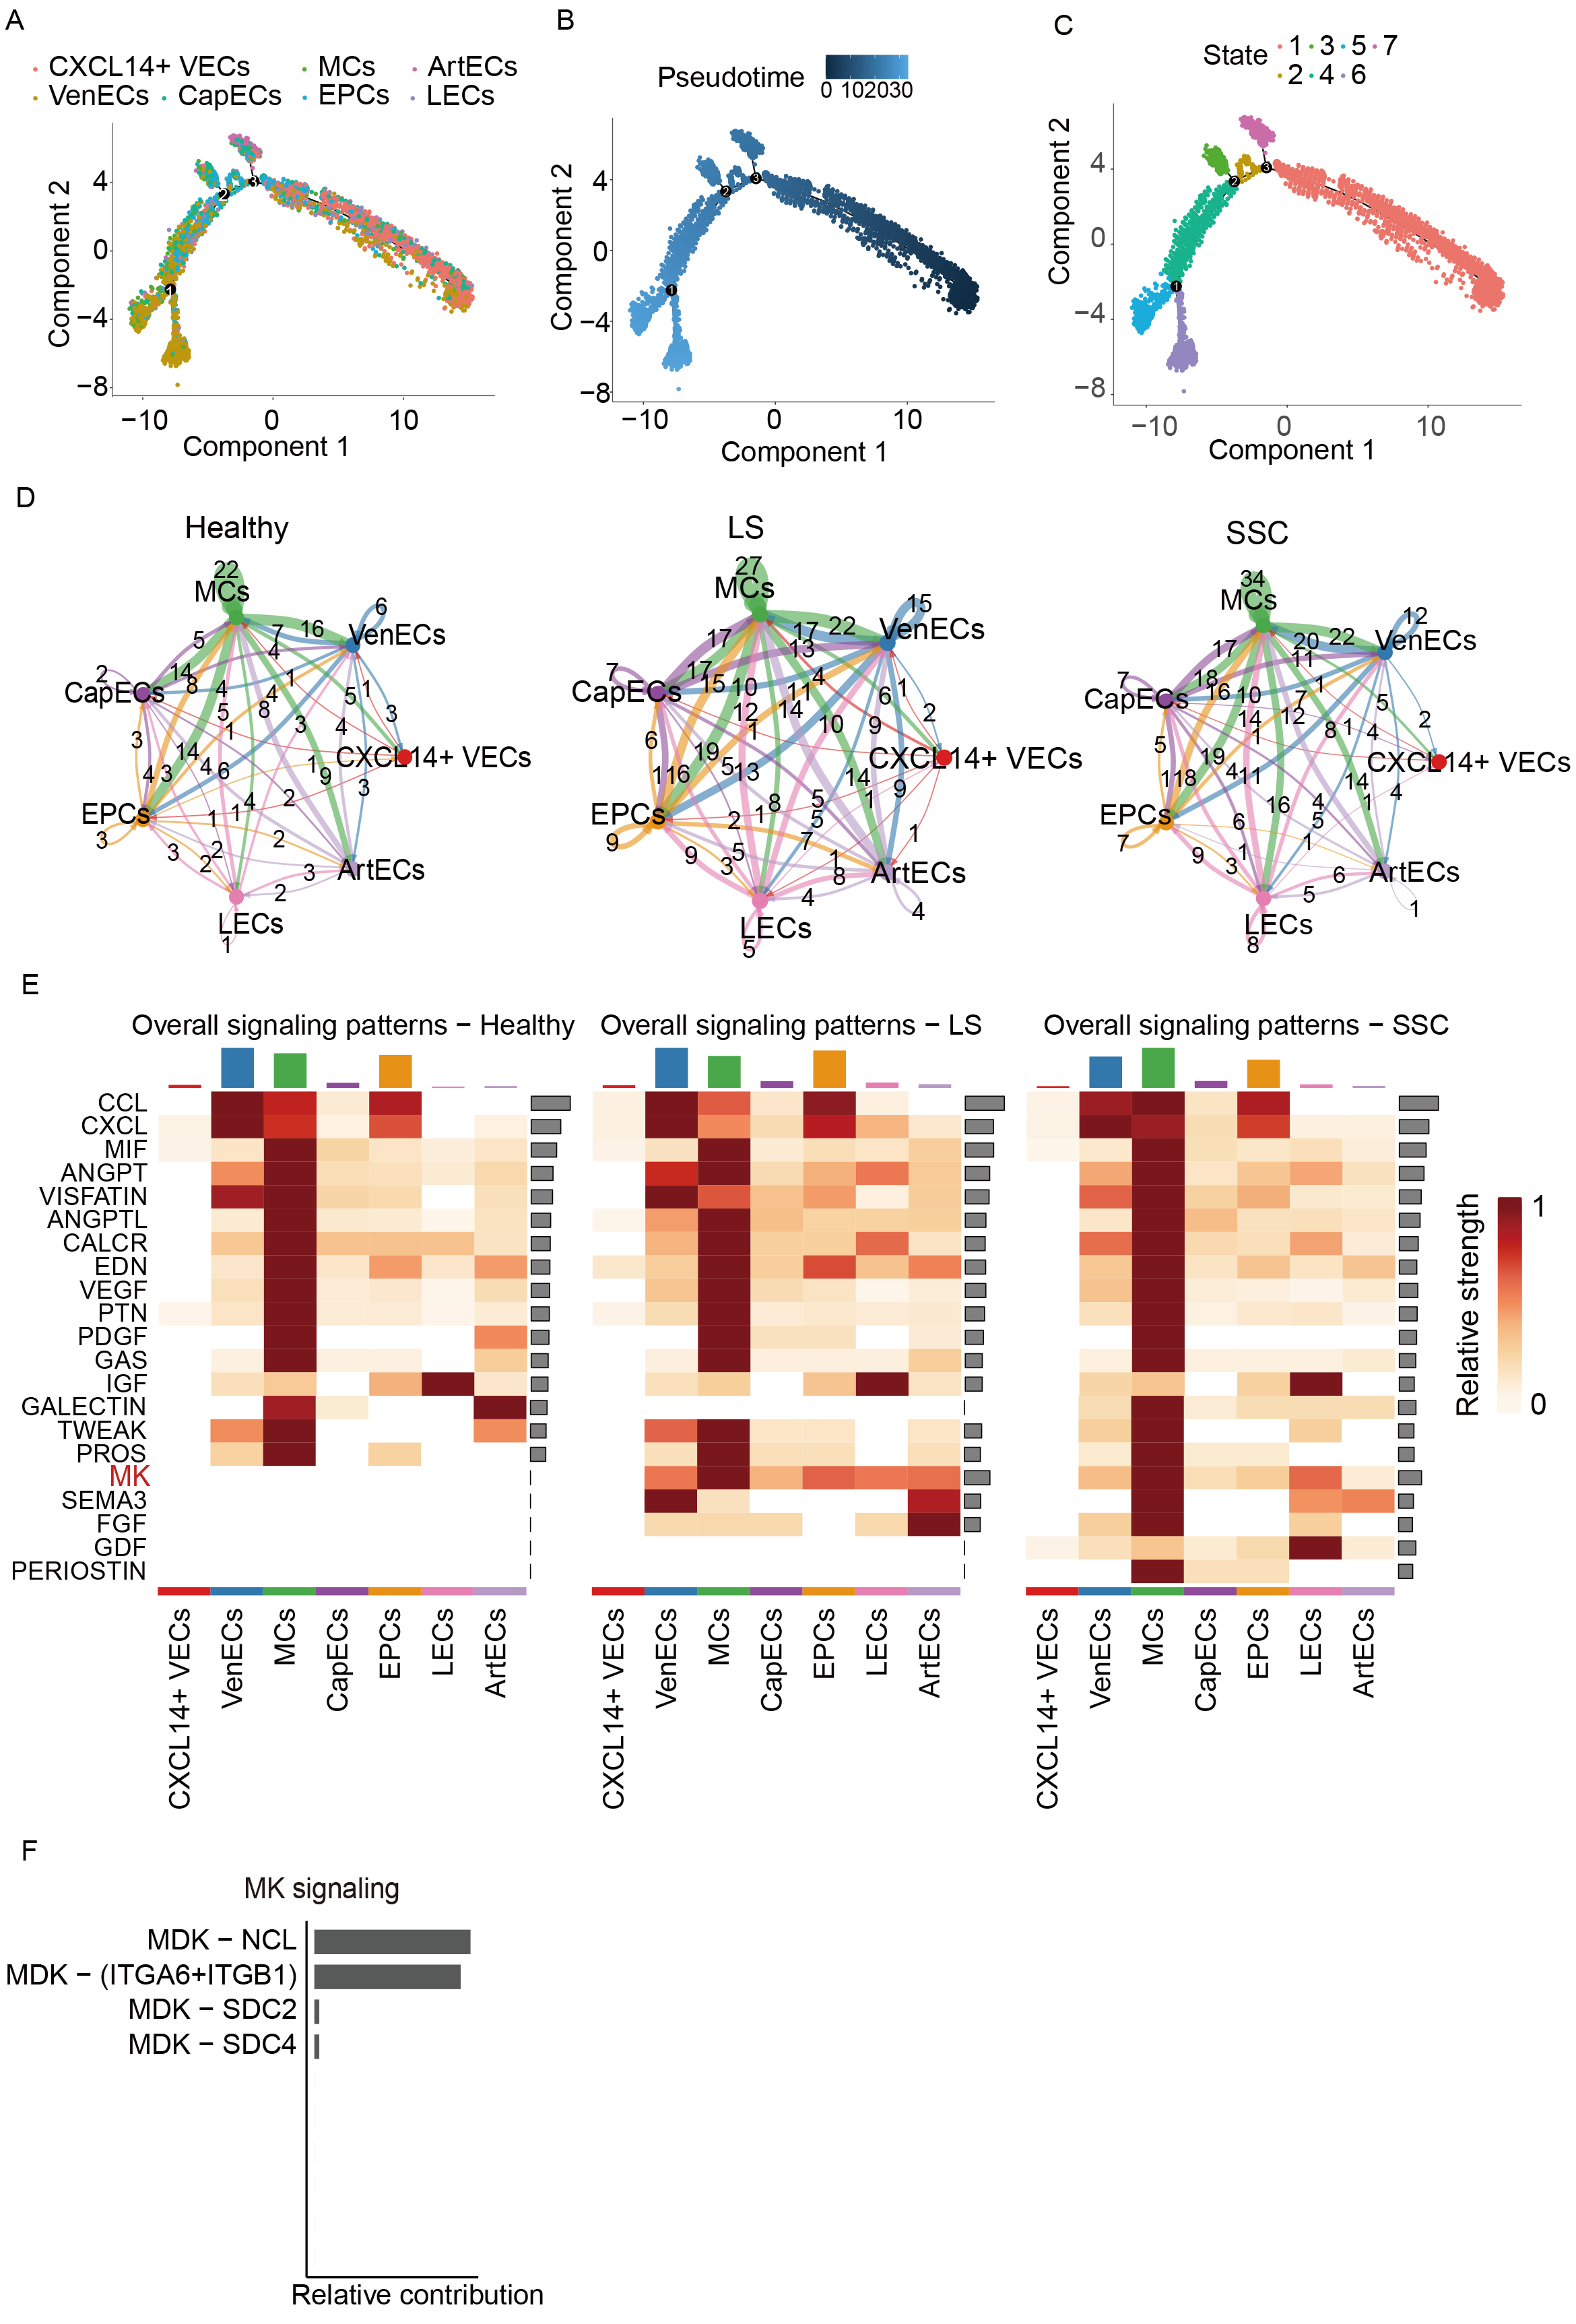
Figure 3. Pseudotime and intercellular communication analysis of EC subclusters. (A) Pseudotime distribution of EC subclusters; (B) Pseudotime value distribution across subclusters; (C) Cell developmental trajectory stages along pseudotime; (D) Cell-cell communication networks between groups; (E) Heatmap showing the expression of signaling pathways across cell-cell interactions; (F) Bar plot illustrating the contribution of specific ligand-receptor pairs within the MK signaling pathway. EC: Endothelial cell; MCs: mural cells; CapECs: capillary ECs; EPCs: endothelial progenitor cells; LECs: lymphatic ECs; CXCL14+ VECs: CXCL14+ vascular ECs; VenECs: venous ECs; ArtECs: arterial ECs; SSC: systemic sclerosis; LS: localized scleroderma; NCL: nucleolin; MK/MDK: midkine; DMK: doppel midkine; CCL: c-c motif chemokine ligand; CXCL: c-x-c motif chemokine ligand; MIF: macrophage migration inhibitory factor; ANGPT: angiopoietin; VISFATIN: visfatin; ANGPTL: angiopoietin-like; CALCR: calcitonin receptor; EDN: endothelin; VEGF: vascular endothelial growth factor; PTN: pleiotrophin; PDGF: platelet-derived growth factor; GAS: gastrin; IGF: insuln-like growth factor; GALECTIN: galectin; TWEAK: tumor necrosis factor-like weak inducer of apoptosis; PROS: protein s; SEMA3: semaphorin 3; FGF: fibroblast growth factor; GDF: growth differentiation factor; PERIOSTIN: periostin.


