


fig2
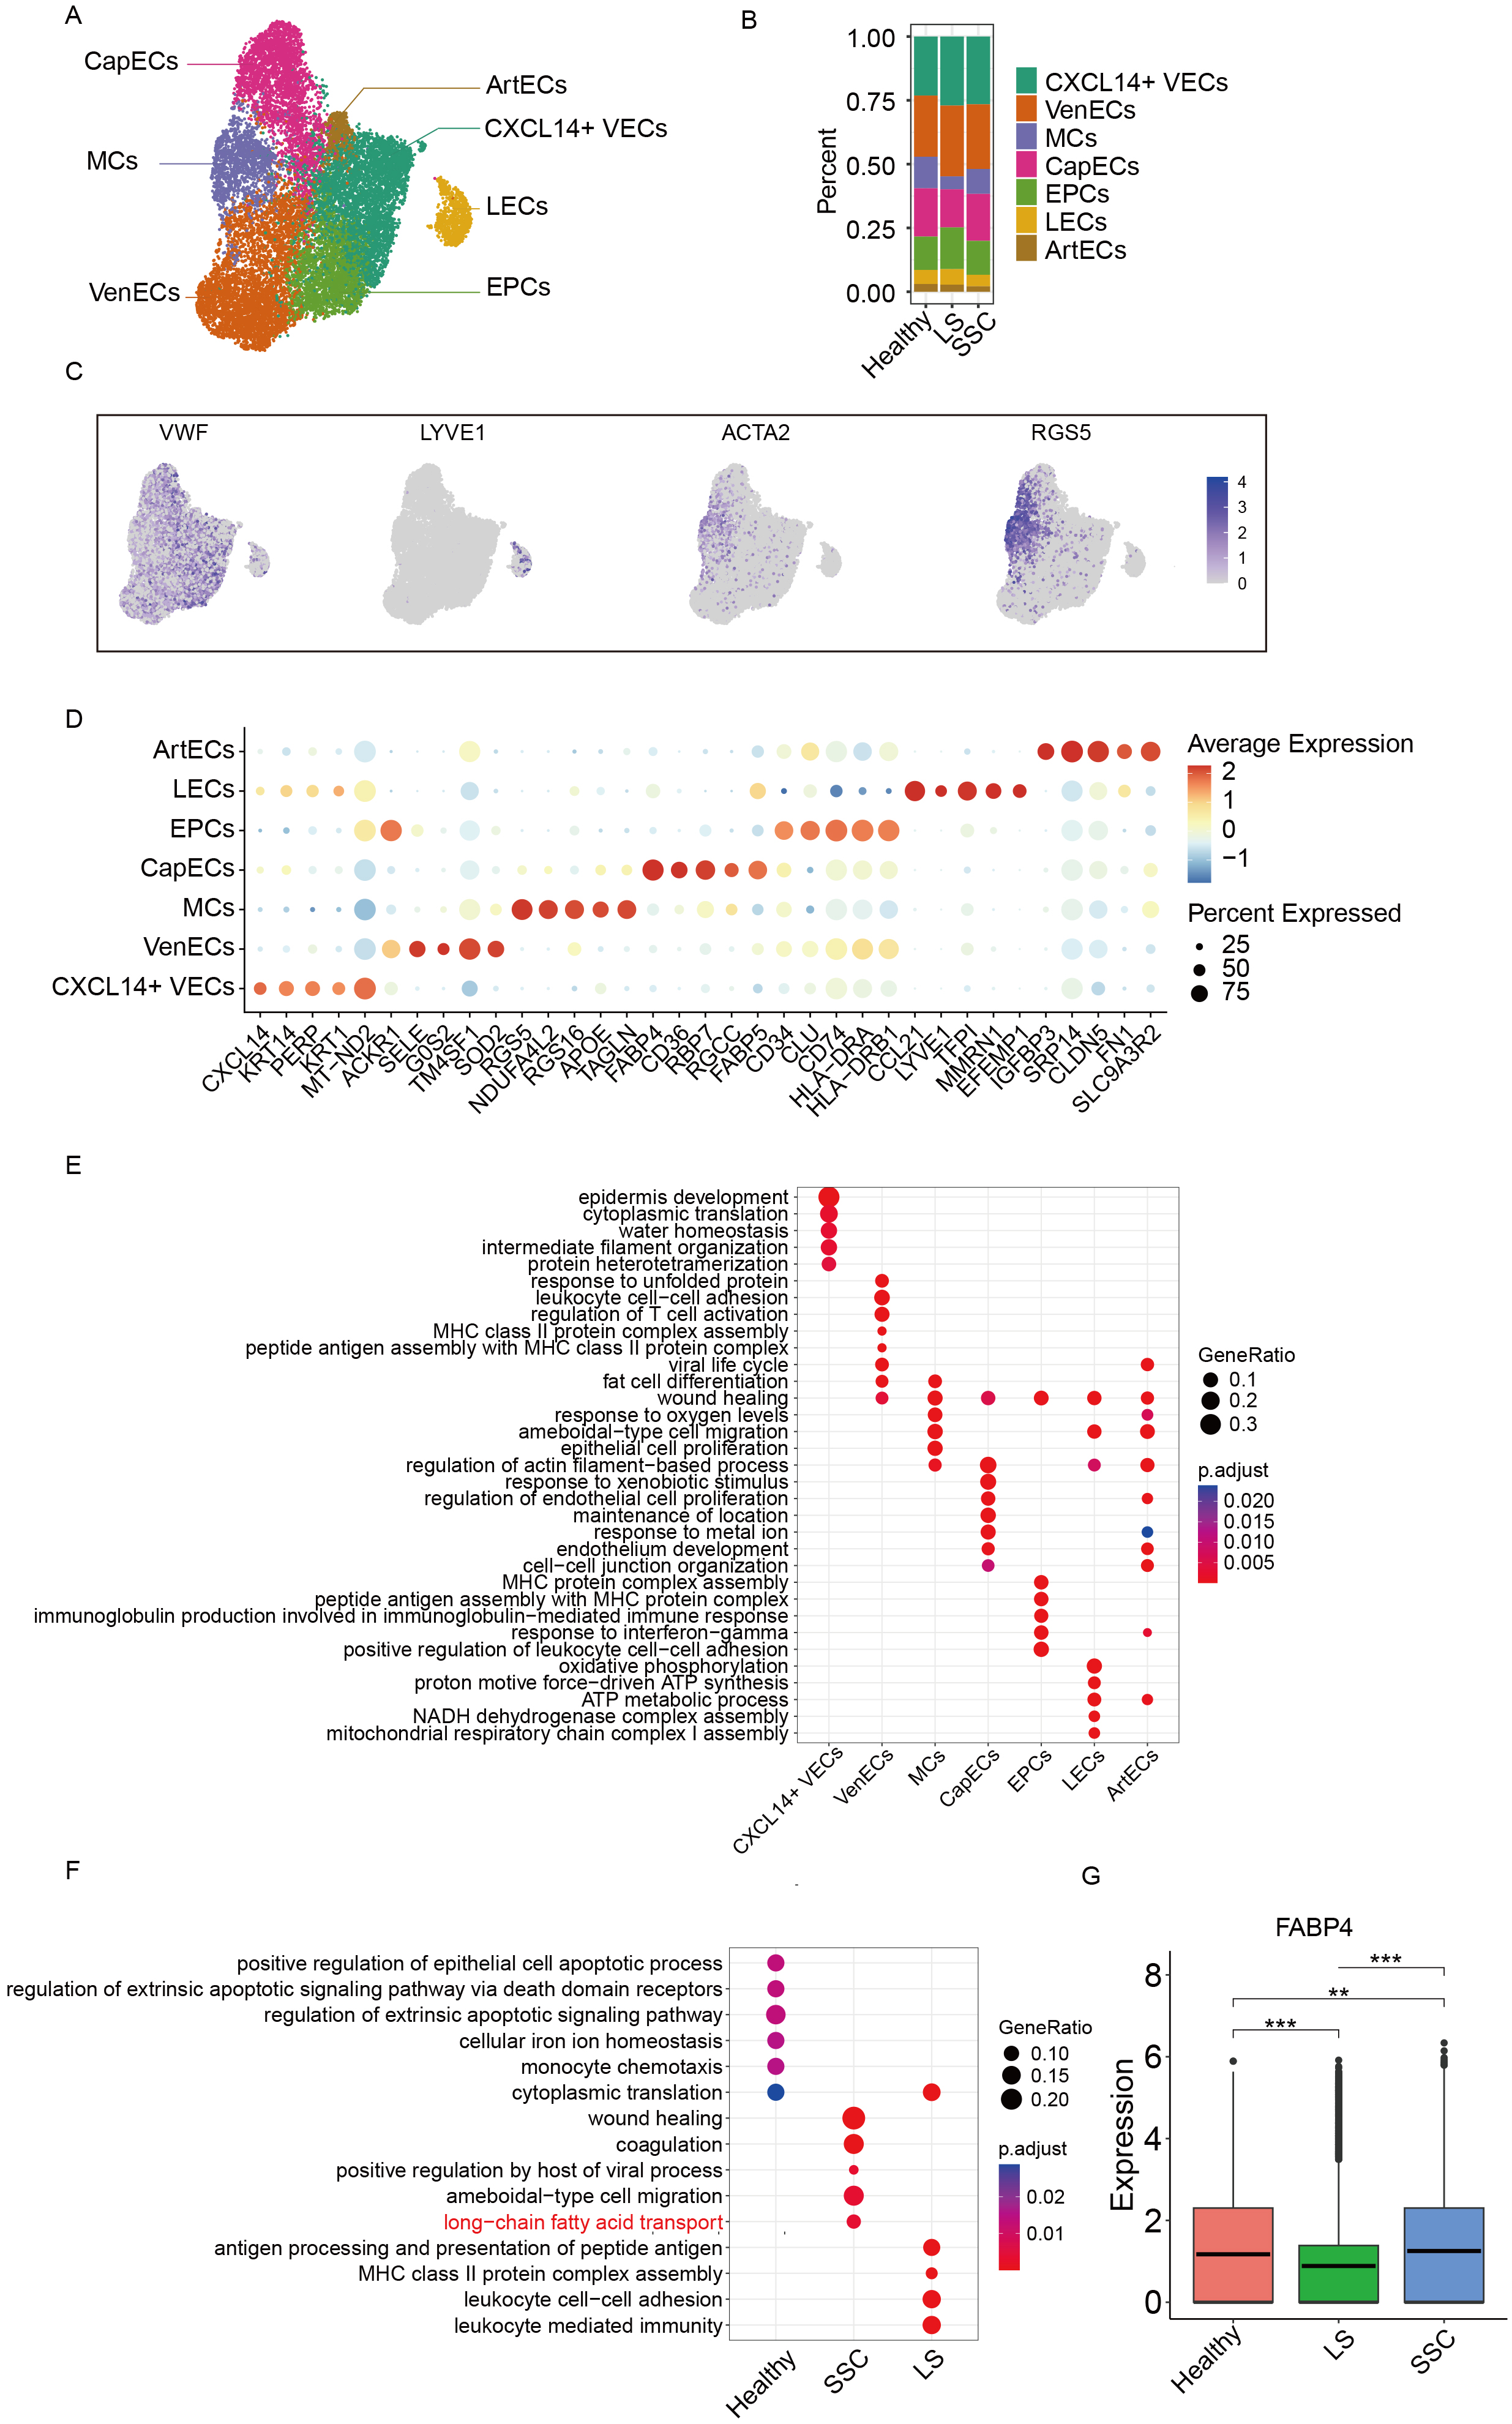
Figure 2. Subclustering analysis of ECs. (A) UMAP plot showing the annotation of EC subclusters; (B) Bar plot showing the proportion of EC subclusters across groups; (C) UMAP plot displaying marker gene expression for each cell subtype; (D) Dot plot of canonical marker genes used for subcluster annotation; (E) Functional enrichment analysis of DEGs among EC subclusters; (F) Functional enrichment analysis of DEGs between groups; (G) Box plot showing the expression of FABP4 across different groups with asterisks denoting levels of statistical significance where *** signifies a P value of less than 0.001, ** signifies a P value of less than 0.01, and * signifies a P value of less than 0.05. UMAP: Uniform manifold approximation and projection; ECs: endothelial cells; DEGs: differentially expressed genes; FABP4: fatty acid binding protein 4; MCs: mural cells; CapECs: capillary ECs; EPCs: endothelial progenitor cells; LECs: lymphatic ECs; CXCL14+ VECs: CXCL14+ vascular ECs; VenECs: venous ECs; ArtECs: arterial ECs; SSC: systemic sclerosis; LS: localized scleroderma; MHC: major histocompatibility complex; NADH: nicotinamide adenine dinucleotide + hydrogen; ATP: adenosine triphosphate; VWF: von willebrand factor; LYVE1: lymphatic vessel endothelial hyaluronan receptor 1; ACTA2: actin alpha 2; RGS5: regulator of g-protein signaling 5.


