


fig4
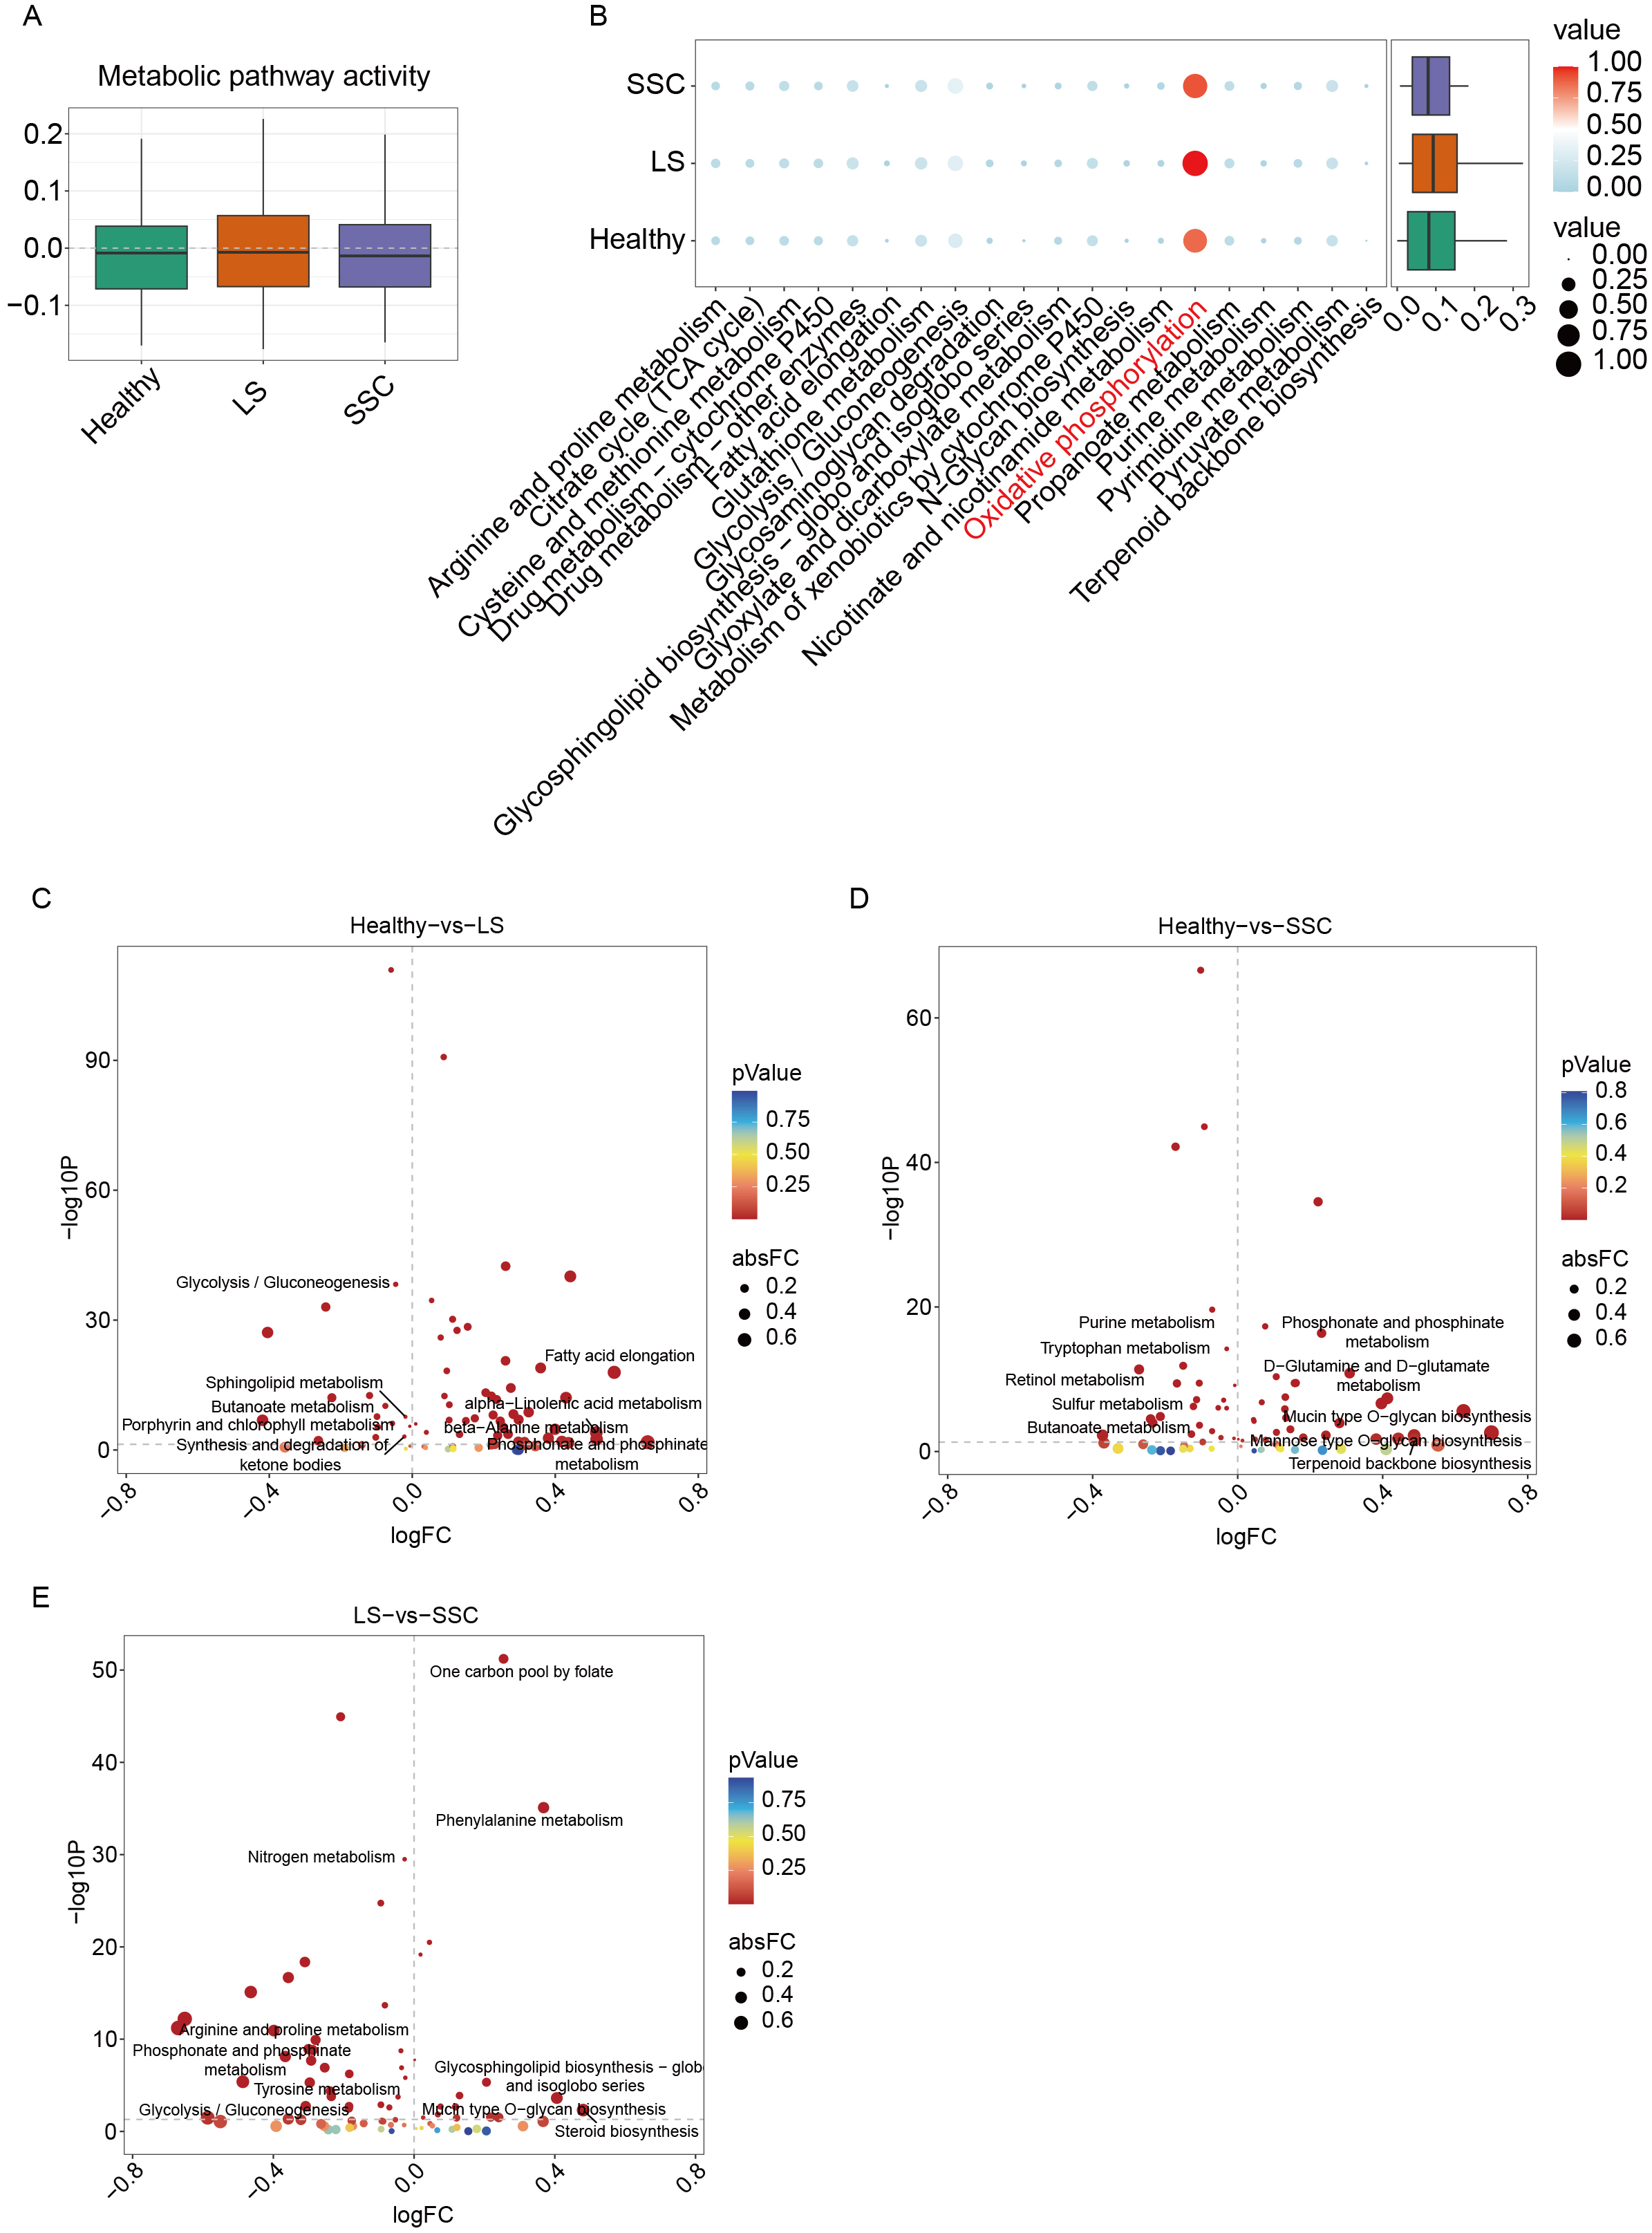
Figure 4. Metabolic activity assessment in ECs. (A) Box plot comparing metabolic activity across groups; (B) Dot plot showing differential expression of metabolic pathways between groups; (C) Differential metabolic pathway analysis between the normal and LS groups; the x-axis represents log fold change (logFC), and the y-axis represents -log10P values. The top five pathways ranked by fold change are labeled; (D) Differential analysis of metabolic pathway between the normal and SSC groups; (E) Differential analysis of metabolic pathway between the LS and SSC groups. ECs: Endothelial cells; SSC: systemic sclerosis; LS: localized scleroderma; TCA: tricarboxylic acid.


