


fig1
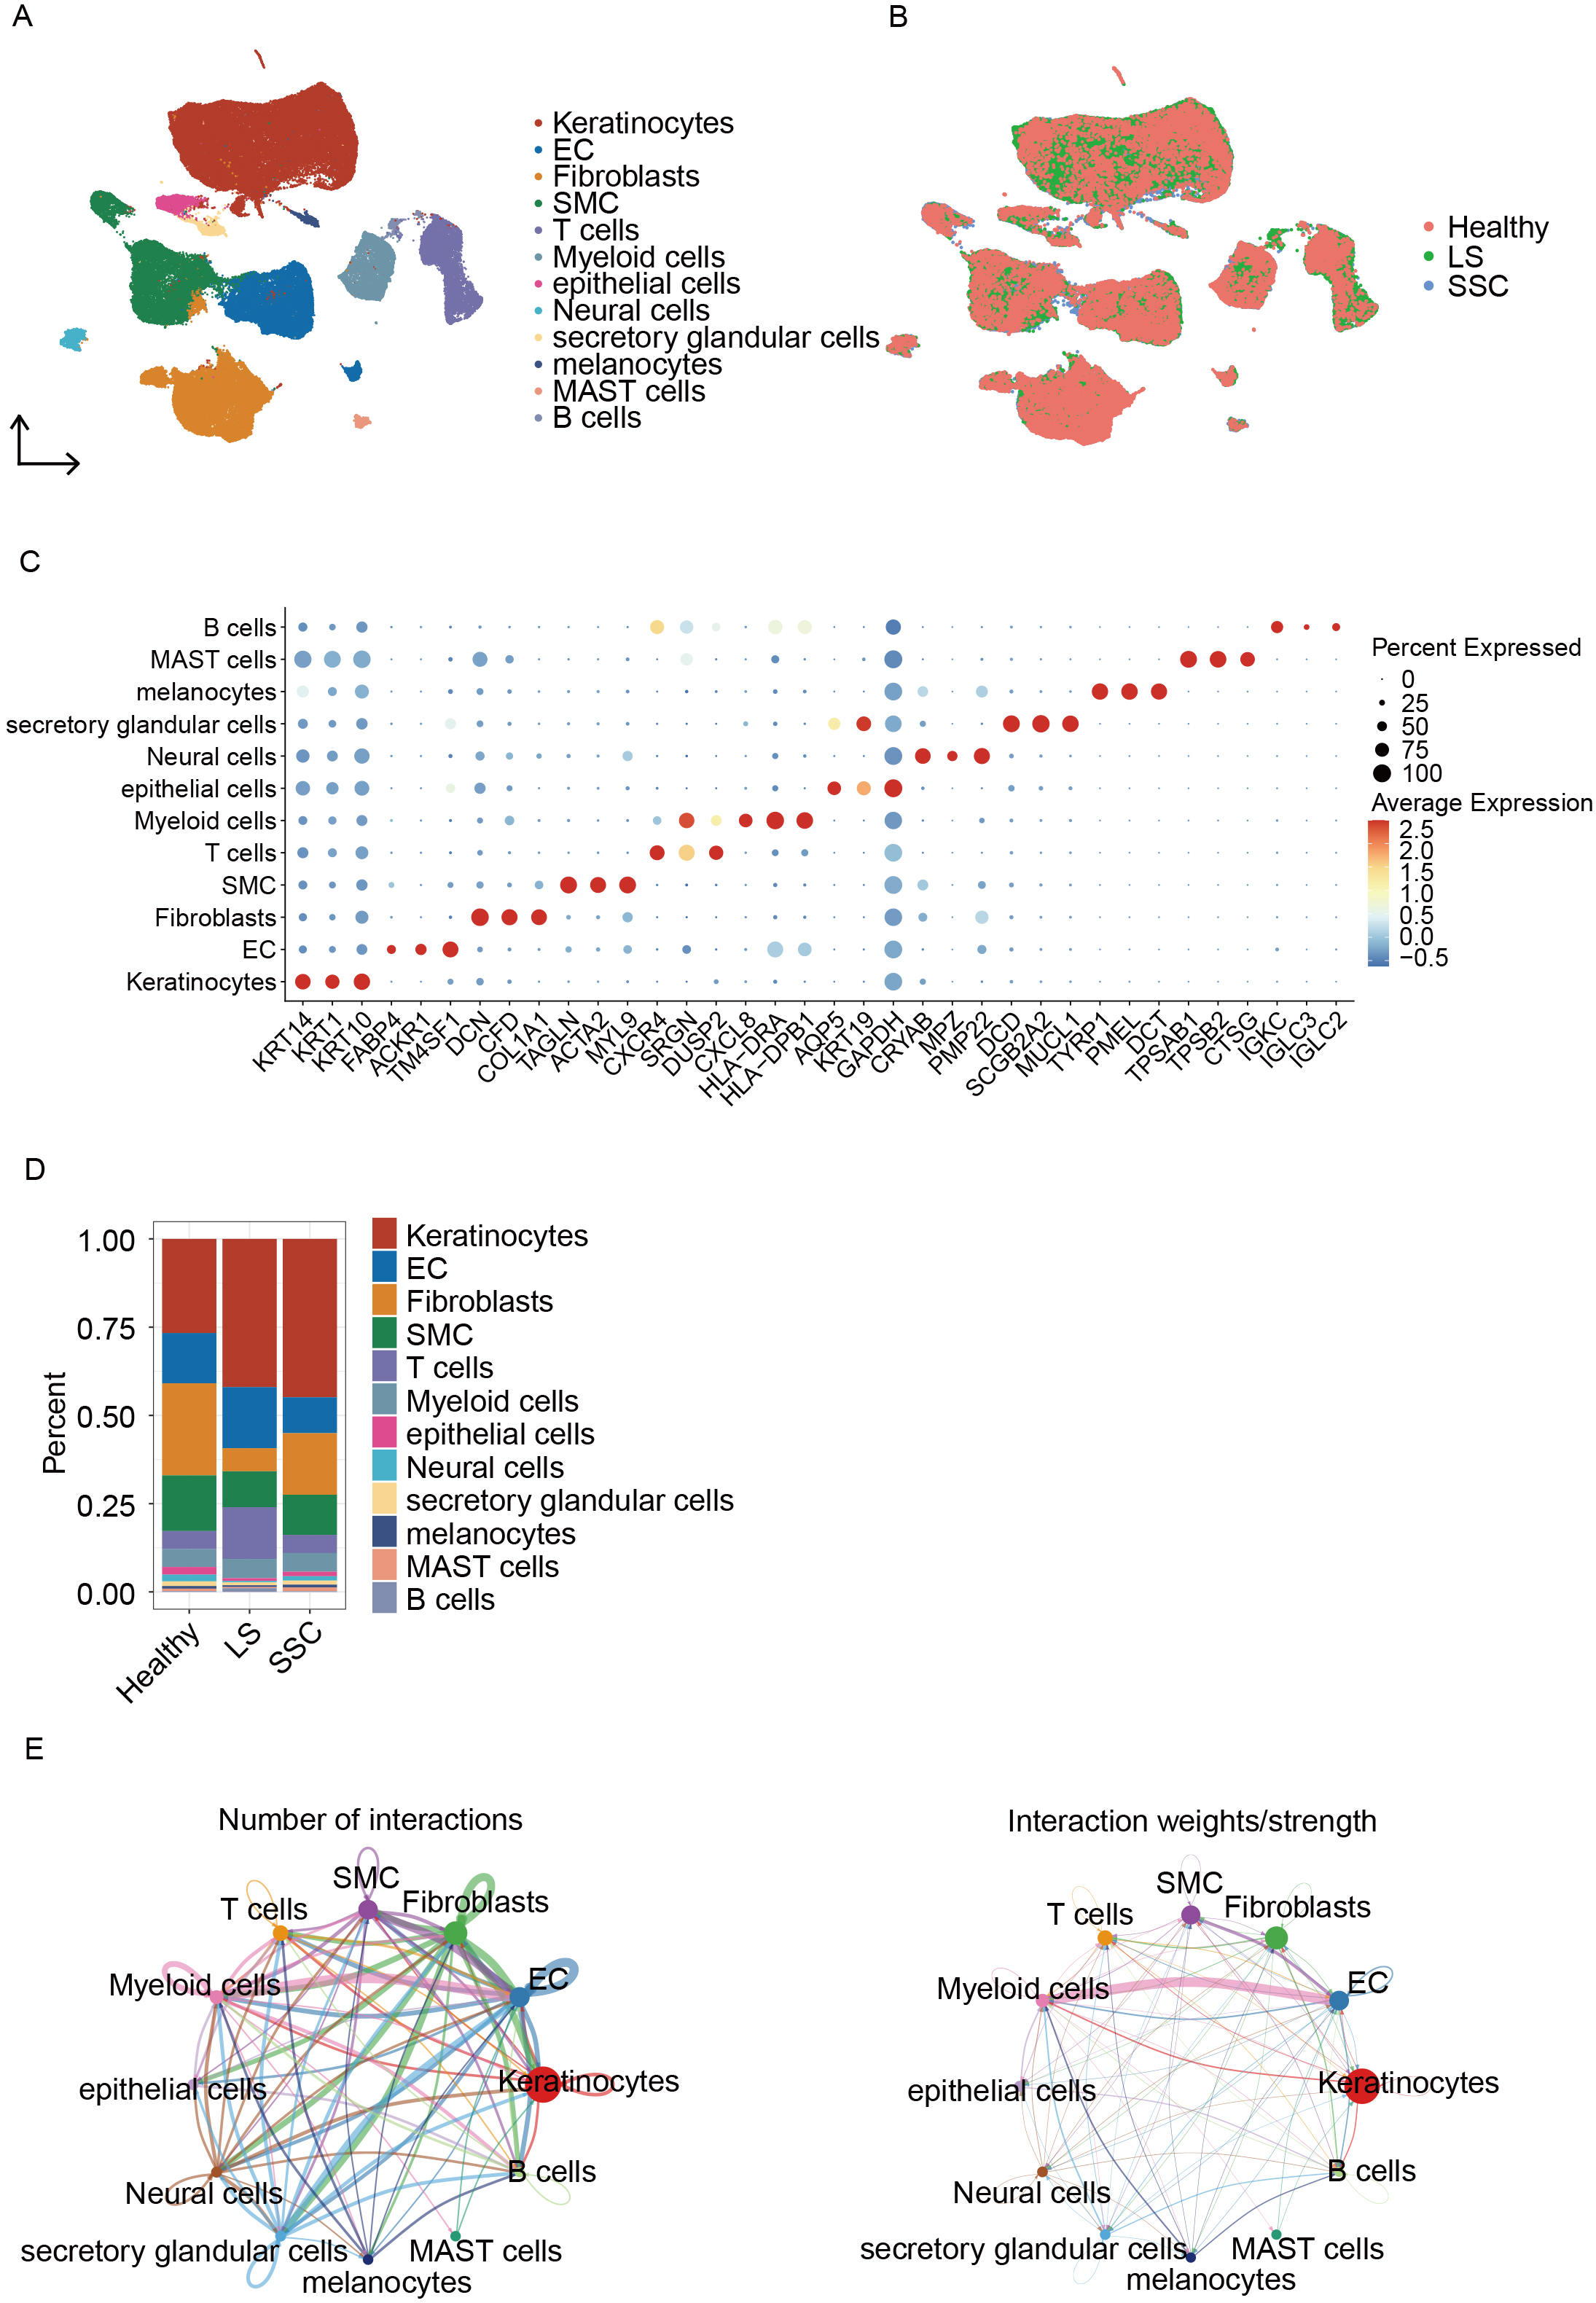
Figure 1. Single-cell analysis and intercellular interactions in scleroderma. (A) UMAP plot showing cell type annotations; (B) UMAP plot displaying cell distribution across groups; (C) Dot plot of marker genes used for cell annotation; (D) Bar plot showing the proportion of cell types in each sample; (E) Cell-cell interaction network diagrams: the left panel shows the total number of interactions and the right panel shows the weighted interaction network. UMAP: Uniform manifold approximation and projection; EC: endothelial cell; SMCs: smooth muscle cells; SSC: systemic sclerosis; LS: localized scleroderma; MAST: mastocytes.


