

Exploratory whole-tumor and habitat radiomic associations with study-documented Clonorchis sinensis status in hepatocellular carcinoma
 0
 , ...
Graphical Abstract
Abstract
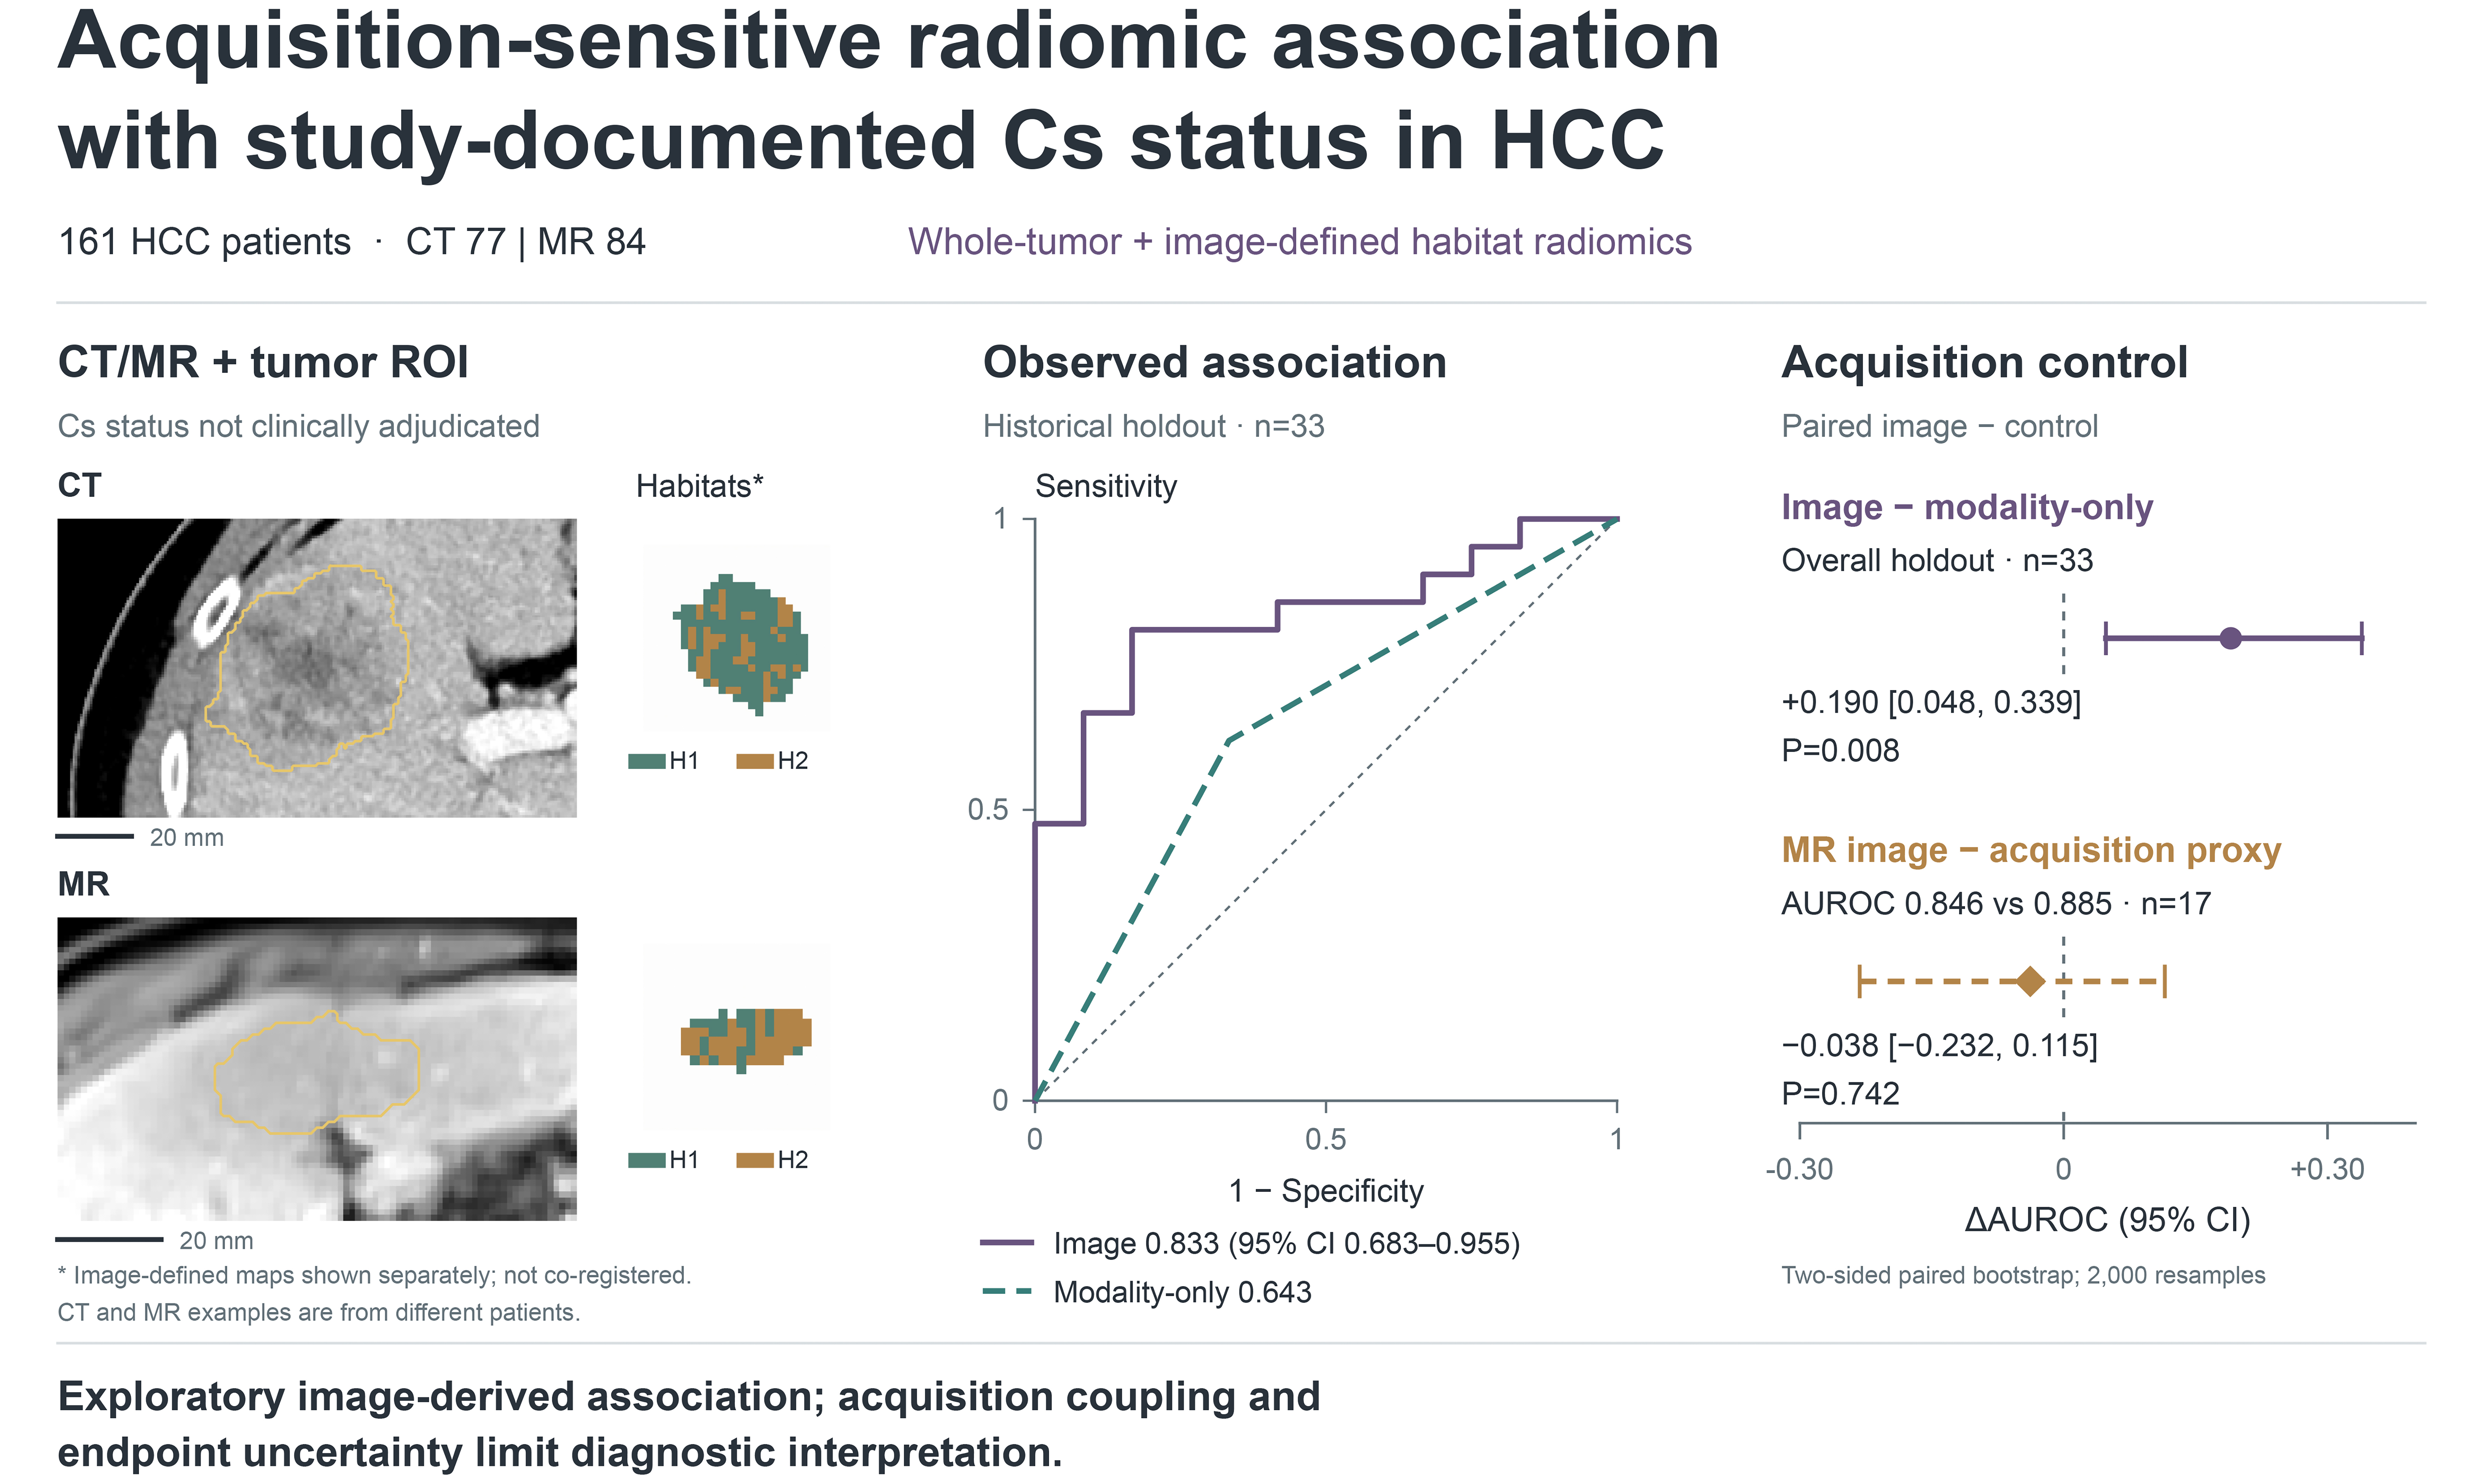
Aim: To explore associations of whole-tumor and habitat radiomics with study-documented Clonorchis sinensis (Cs) status in hepatocellular carcinoma.
Methods: This retrospective study included 161 patients: 77 with computed tomography (CT) and 84 with magnetic resonance (MR) imaging. A patient-level split yielded 128 training and 33 internal holdout patients. Modality-specific habitats were constructed from training voxels with patient-balanced sampling. An ExtraTrees model combined whole-tumor features and label-invariant habitat summaries. Modality-only and MR acquisition-only controls were compared on the same holdout. Additional MR analyses examined resampling and acquisition sensitivity. Case-level infection ascertainment and clinical covariates were unavailable.
Results: Holdout area under the receiver operating characteristic curve (AUROC) was 0.833 [95% confidence interval (CI): 0.683-0.955]. The model exceeded the modality-only control (AUROC 0.643; paired difference +0.190, 95%CI: 0.048-0.339; P = 0.008). The pooled-model MR subgroup did not outperform the acquisition control (AUROC 0.846 vs. 0.885; difference -0.038, 95%CI: -0.232-0.115; P = 0.742). Among 90 MR development patients, AUROC from probabilities averaged across three nested cross-validation repeats was 0.854 (95%CI: 0.765-0.926); 14 patients overlapped the original holdout. Restriction to shared acquisition support yielded AUROC 0.684 in 34 patients.
Conclusion: Radiomics showed exploratory associations with study-documented Cs status. Acquisition coupling, endpoint uncertainty, unmeasured clinical confounding and reused evaluation data prevent interpretation as infection diagnosis or independent validation.
Keywords


 Download PDF
INTRODUCTION
Hepatocellular carcinoma (HCC) is a heterogeneous malignancy whose imaging phenotype is shaped by tumor-intrinsic variation, liver background, and regional etiologic exposures. Computed tomography (CT) and magnetic resonance (MR) imaging are central to HCC assessment, but qualitative interpretation does not fully quantify spatial variation within a lesion or the broader disease context[1-3]. In endemic regions, Clonorchis sinensis (Cs) is a relevant hepatobiliary exposure. Its established carcinogenic association is strongest for cholangiocarcinoma[4]. Genomic and host-interaction studies have characterized this parasite[5,6], while epidemiologic, molecular, and tumor-microenvironment studies have examined its association with HCC[7-9].
Radiomics transforms medical images into quantitative descriptors of intensity, shape, and texture[10-13]. In HCC, radiomics has been evaluated for recurrence, microvascular invasion, treatment response, molecular phenotype, and prognosis[14-22]. Conventional whole-tumor radiomics treats a lesion as one region of interest (ROI), which is operationally simple but may average together spatially distinct components such as viable tumor, necrosis, fibrosis, vascular remodeling, and inflammatory change. Habitat imaging extends this representation by partitioning an ROI into imaging-defined subregions before feature extraction[23-25]. Related intratumoral and peritumoral radiomics studies have examined spatial heterogeneity in HCC[26,27].
A previous MR radiomics study examined Cs-related HCC and cytokeratin 7/19 expression[10]. Related habitat studies have evaluated voxel-wise feature reproducibility in lung CT[23], multi-habitat MR imaging for treatment response in cervical cancer[24], and tumoral and peritumoral habitat radiomics in lung adenocarcinoma[25]. These studies motivate spatially resolved analysis, but do not establish whether a study-documented Cs label can be distinguished from differences in modality and acquisition within the present cohort.
We therefore examined whether whole-tumor and habitat radiomics were associated with study-documented Cs status in a retrospective CT/MR cohort. We compared an image-only model with modality-only and MR acquisition-only controls, then examined the sensitivity of a separate MR radiomics analysis to resampling and acquisition support. Our aim was to characterize the observed association and determine how strongly it could be distinguished from modality and acquisition composition.
METHODS
Study design and endpoint
This retrospective exploratory study evaluated HCC patients with a binary Cs label in the study dataset. Ethical approval and the authors’ consent-waiver statement are provided in the Declarations (2025-E0322; 24 April 2025). We use “study-documented Cs status” to describe this project label, rather than a clinically adjudicated infection endpoint. Case-level diagnostic methods, assessment dates, treatment history, diagnostic certainty, and a negative reference standard were unavailable. The study used a binary study-documented Cs label. Although the historical project description cited WS309-2009, case-level diagnostic methods and the application of these criteria to individual patients could not be reconstructed.
Labels 1 and 0 are retained as dataset codes. Their operational contrast is documented Cs positivity vs. no documented Cs positivity; label 0 does not establish that infection was actively excluded, and label 1 does not establish current active infection. Counts by stool examination, serology, biliary examination, pathology or prior treatment, and a certainty-restricted analysis could not be obtained. These limitations also prevent determining the timing of Cs assessment relative to HCC diagnosis and imaging.
Patients and evaluation cohorts
The analysis included 161 feature-complete patients: 77 with CT and 84 with MR imaging, with 103 label-1 and 58 label-0 patients. A fixed patient-level 80/20 split provided 128 training patients (61 CT, 67 MR) and 33 internal holdout patients (16 CT, 17 MR), with no overlap. Age, sex, hepatitis B virus (HBV)/hepatitis C virus (HCV) status, other liver-disease etiologies, cirrhosis, liver function, alpha-fetoprotein, tumor size, number and stage, histological differentiation, prior treatment, and imaging institution were unavailable in the analysis dataset. Clinical baseline comparisons and adjusted or combined clinical-radiomic models were therefore not estimable (see the clinical-variable availability Table in the Supplementary Materials).
The 33-patient holdout was reused across exploratory model comparisons. The responsible author confirmed that holdout results were not viewed before model selection; their possible influence on later manuscript decisions was not separately documented. We therefore treat holdout performance as internal exploratory evaluation. Additional MR sensitivity analyses used a different feature representation and split, described in Section “Sensitivity and robustness analyses”, and do not constitute independent validation.
Imaging, tumor segmentation and preprocessing
CT/MR images and tumor masks were obtained from the existing study dataset. Each original pooled-model record represents one patient using their available imaging modality; the exact historical sequence-selection and aggregation rule could not be reconstructed. The original segmentation description cited nnU-Net with physician review[28], and the available checkpoint was compatible. This discrepancy prevents definitive identification of the executed segmentation workflow. Reader expertise, correction frequency, blinding to Cs status, multifocal-lesion selection, and independent reference masks were undocumented. Accordingly, the available masks support feature extraction but do not establish segmentation accuracy or inter-reader reproducibility.
Cohort-wide CT phase, MR sequence/contrast phase, scanner and acquisition parameters were incomplete. Detailed Digital Imaging and Communications in Medicine (DICOM) metadata were available for one MR examination and cannot establish the settings used across the cohort. The exact historical extraction configuration, runtime and mapping between feature columns and ROI definitions were also incomplete. Available acquisition, preprocessing, and segmentation records, the original feature inventory, and the current MR extraction configuration are provided in Supplementary Methods. Current settings are distinguished from those used for the original pooled model.
Whole-tumor and habitat representations
Whole-tumor radiomics summarizes intensity and texture within the supplied tumor ROI. Habitat radiomics partitions the ROI into imaging-defined subregions using voxel-level features. CT and MR habitat models were fitted separately with training voxels, then applied to training and holdout images. In the patient-balanced construction, no more than 3,000 tumor voxels per training patient contributed to clustering, reducing the influence of large tumors. Actual training samples contained 145,174 CT and 110,876 MR voxels. Holdout voxels were excluded from centroid fitting.
Because habitat identities are modality-specific, pooled modeling used label-invariant summaries of per-habitat features, including central tendency, dispersion, extrema, and fraction-weighted quantities. These were concatenated with whole-tumor features. The saved fused representation contained 20 whole-tumor columns (19 radiomic descriptors and one voxel count) and 153 habitat-summary columns, totaling 173 columns for each evaluated cluster number (K). Each unsummarized habitat has the same 19 named radiomic descriptors plus its voxel count and tumor fraction (21 columns); the additional fraction, rather than an additional radiomic descriptor, explains the 20- vs.-21 difference. The full lists are supplied in Supplementary Methods. Habitat indices do not imply corresponding tissue compartments across CT and MR. The study design and image-derived workflow are shown in Figure 1.
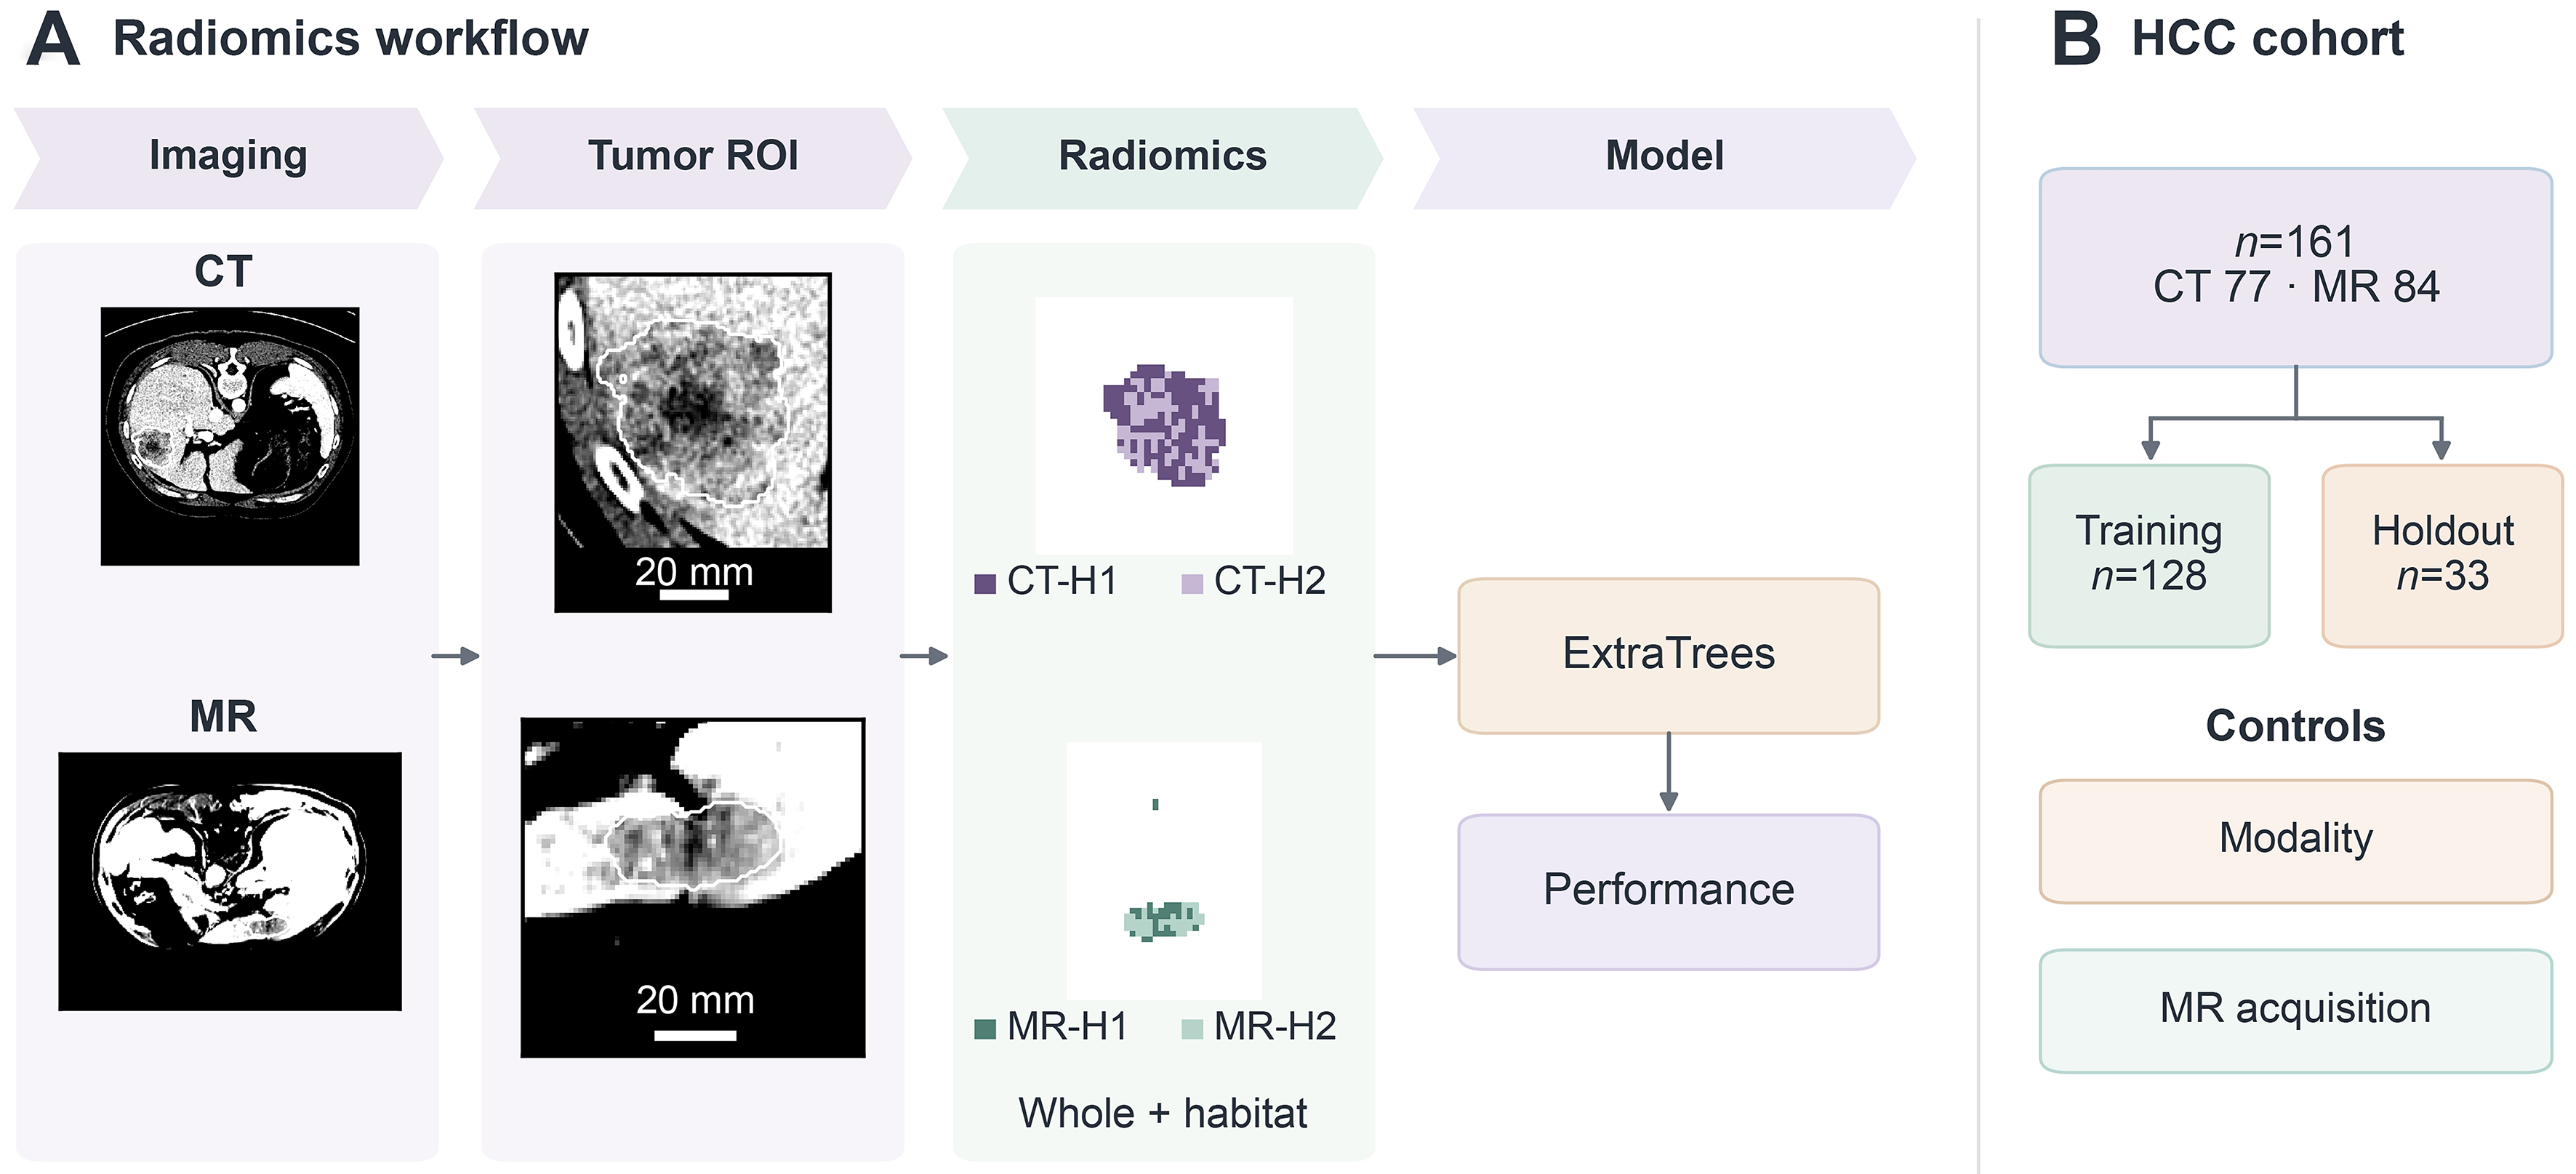
Figure 1. Study design. (A) CT and MR slices, tumor ROIs and two-cluster (K = 2) habitat maps illustrate whole-tumor and habitat feature extraction. Each patient contributes their available modality. Habitats were fitted separately by modality using patient-balanced training voxels; label-invariant summaries were combined with whole-tumor features for an ExtraTrees classifier. CT-H1/CT-H2 and MR-H1/MR-H2 are image-defined labels with no assumed cross-modality or histologic equivalence. ROI crops carry 20-mm bars derived from source spacing; maps retain their own processing grids without an assumed raw-to-map registration or scale bar. Display-case selection, intensity rescaling, and map cropping are described in Supplementary Methods; (B) the cohort comprised 161 patients with HCC, including 77 CT and 84 MR patients, split into training (n = 128) and internal holdout (n = 33) sets without shared patients. Modality-only and MR acquisition-only controls were compared with the image model on the same holdout. The endpoint is study-documented binary Cs status: labels 0 and 1 do not establish clinically verified absence or presence of active infection. The holdout was reused in exploratory analyses. CT: Computed tomography; Cs: Clonorchis sinensis; HCC: hepatocellular carcinoma; K: number of clusters; MR: magnetic resonance; ROI: region of interest; H1/H2: habitat 1/habitat 2.
Model development and exploratory comparisons
Candidate pipelines combined training-side preprocessing, correlation pruning, feature selection and classification. Selectors included K-best, L1 regularization and elastic-net methods; classifiers included logistic regression, support vector machine (SVM), random forest (RF) and ExtraTrees. The training selection score was mean cross-validated area under the receiver operating characteristic curve (AUROC) minus 0.5 times its standard deviation. The patient-balanced combined model used K = 2, ExtraTrees, and elastic-net selection (enet10), with five-fold cross-validation (CV) repeated three times during training. Modality and acquisition identifiers were excluded from its predictor set.
K = 2 was retained from the original training-based model selection. It was among K = 2-6 evaluated for patient-balanced clustering; validity indices did not uniformly favor it, and the 173-column output dimension was constant across K. Thus, K = 2 reflects a model-development choice, without evidence of biological optimality or resampling stability. Whole-tumor, habitat-only, and combined alternatives are presented as descriptive comparisons on the reused holdout. Cluster-validity results for both the original K = 2-9 and patient-balanced K = 2-6 constructions are distinguished in Supplementary Figure 1 and Supplementary Table 1. The feature schemas are illustrated in Supplementary Figure 2. Model-search details are provided in Supplementary Methods; the full inventory is cited with the Results comparisons.
Modality and acquisition controls
A modality-only control used CT/MR membership to assess discrimination attributable to modality composition on the same 33-patient holdout. An MR acquisition-only control used filename-derived protocol categories on the 17-patient MR holdout. These categories are acquisition proxies rather than verified contrast phases or complete scanner metadata. Paired image-minus-control comparisons tested whether the image model exceeded these limited acquisition descriptors.
CT and MR subgroup estimates were calculated from the same pooled image model. Separately trained modality-specific models were identified separately in the Supplementary Materials. Neither control adjusts for clinical covariates. AUROC was not estimated within an acquisition category containing only one study label.
Sensitivity and robustness analyses
Additional MR analyses used 107 original radiomic features from 207 matched image/mask pairs representing 106 patients. Features from multiple sequences were averaged within patient, without using labels or acquisition metadata as predictors. The MR split provided 90 development patients (70 label-1, 20 label-0) and 16 reserved patients excluded from these analyses. Of the 90 development patients, 69 also belonged to the original cohort, including 14 in its holdout; their labels agreed. This analysis uses a separate MR feature representation and does not reevaluate the original fused CT/MR habitat model.
Three repeats of five-fold outer CV used inner CV to select among four classifiers and five feature-count settings. Median imputation, standardization, and feature selection were fitted within resampling. Discrimination was summarized for each repeat and from each patient’s mean out-of-fold probability across repeats. Acquisition-signature controls and a radiomics analysis restricted to signatures containing both labels assessed sensitivity to acquisition composition. Habitat construction and K selection were not repeated. Batch harmonization was not performed because a defensible cohort-wide scanner or institution variable was unavailable.
Complementary analyses assessed contour perturbation, selection variability, and learning curves. The contour analysis used baseline masks and 16 synthetic variants on the 207 pairs. Forty patients contributed multiple pairs, so the pair-level intraclass correlation coefficient (ICC) intervals do not account for patient clustering and are not interpreted as patient-level inference. Feature sensitivity does not measure reader agreement or prediction robustness. Full extraction settings, perturbations, resampling procedures, and training sizes are provided in Supplementary Methods; detailed results are provided in the Supplementary Figures and Supplementary Tables.
Statistical analysis and software
Discrimination was summarized by AUROC with 95% confidence intervals (CIs) from 2,000 patient-level resamples, excluding one-class samples. The two acquisition-control comparisons used paired resampling. Two-sided bootstrap P values were twice the smaller zero-tail proportion with a one-count correction, capped at 1; seeds and numerical conventions are specified in Supplementary Methods. Estimates are conditional on the saved predictions and do not account for the complete model search or multiplicity. The comparisons are exploratory and use no confirmatory significance threshold. No prospective registration or sample-size calculation was documented.
Calibration and decision-curve analysis (DCA) were descriptive. The Brier score, expected calibration error (ECE), and Hosmer-Lemeshow statistic were reported without claiming validated clinical thresholds or utility. Precision was interpreted from the actual denominators and intervals rather than post-hoc observed-effect power. Feature-extraction and reporting context followed the radiomics literature[29-31]. The additional MR analyses used Python 3.10.19, scikit-learn 1.7.2, and PyRadiomics 3.0.1; the complete available software versions and extraction settings are supplied in Supplementary Methods.
RESULTS
Cohort and acquisition composition
The 161-patient cohort included 103 label-1 and 58 label-0 patients. The internal holdout contained 21 label-1 and 12 label-0 patients: CT had 8/8 and MR had 13/4 label-1/label-0 patients. Among MR acquisition categories, MR_OTHER contained only label-1 patients (n = 10), whereas T1_VIBE_FS contained both labels (n = 7). Table 1 and Figure 2 show the cohort composition and the uneven acquisition support; Table 2 summarizes the holdout protocol support.
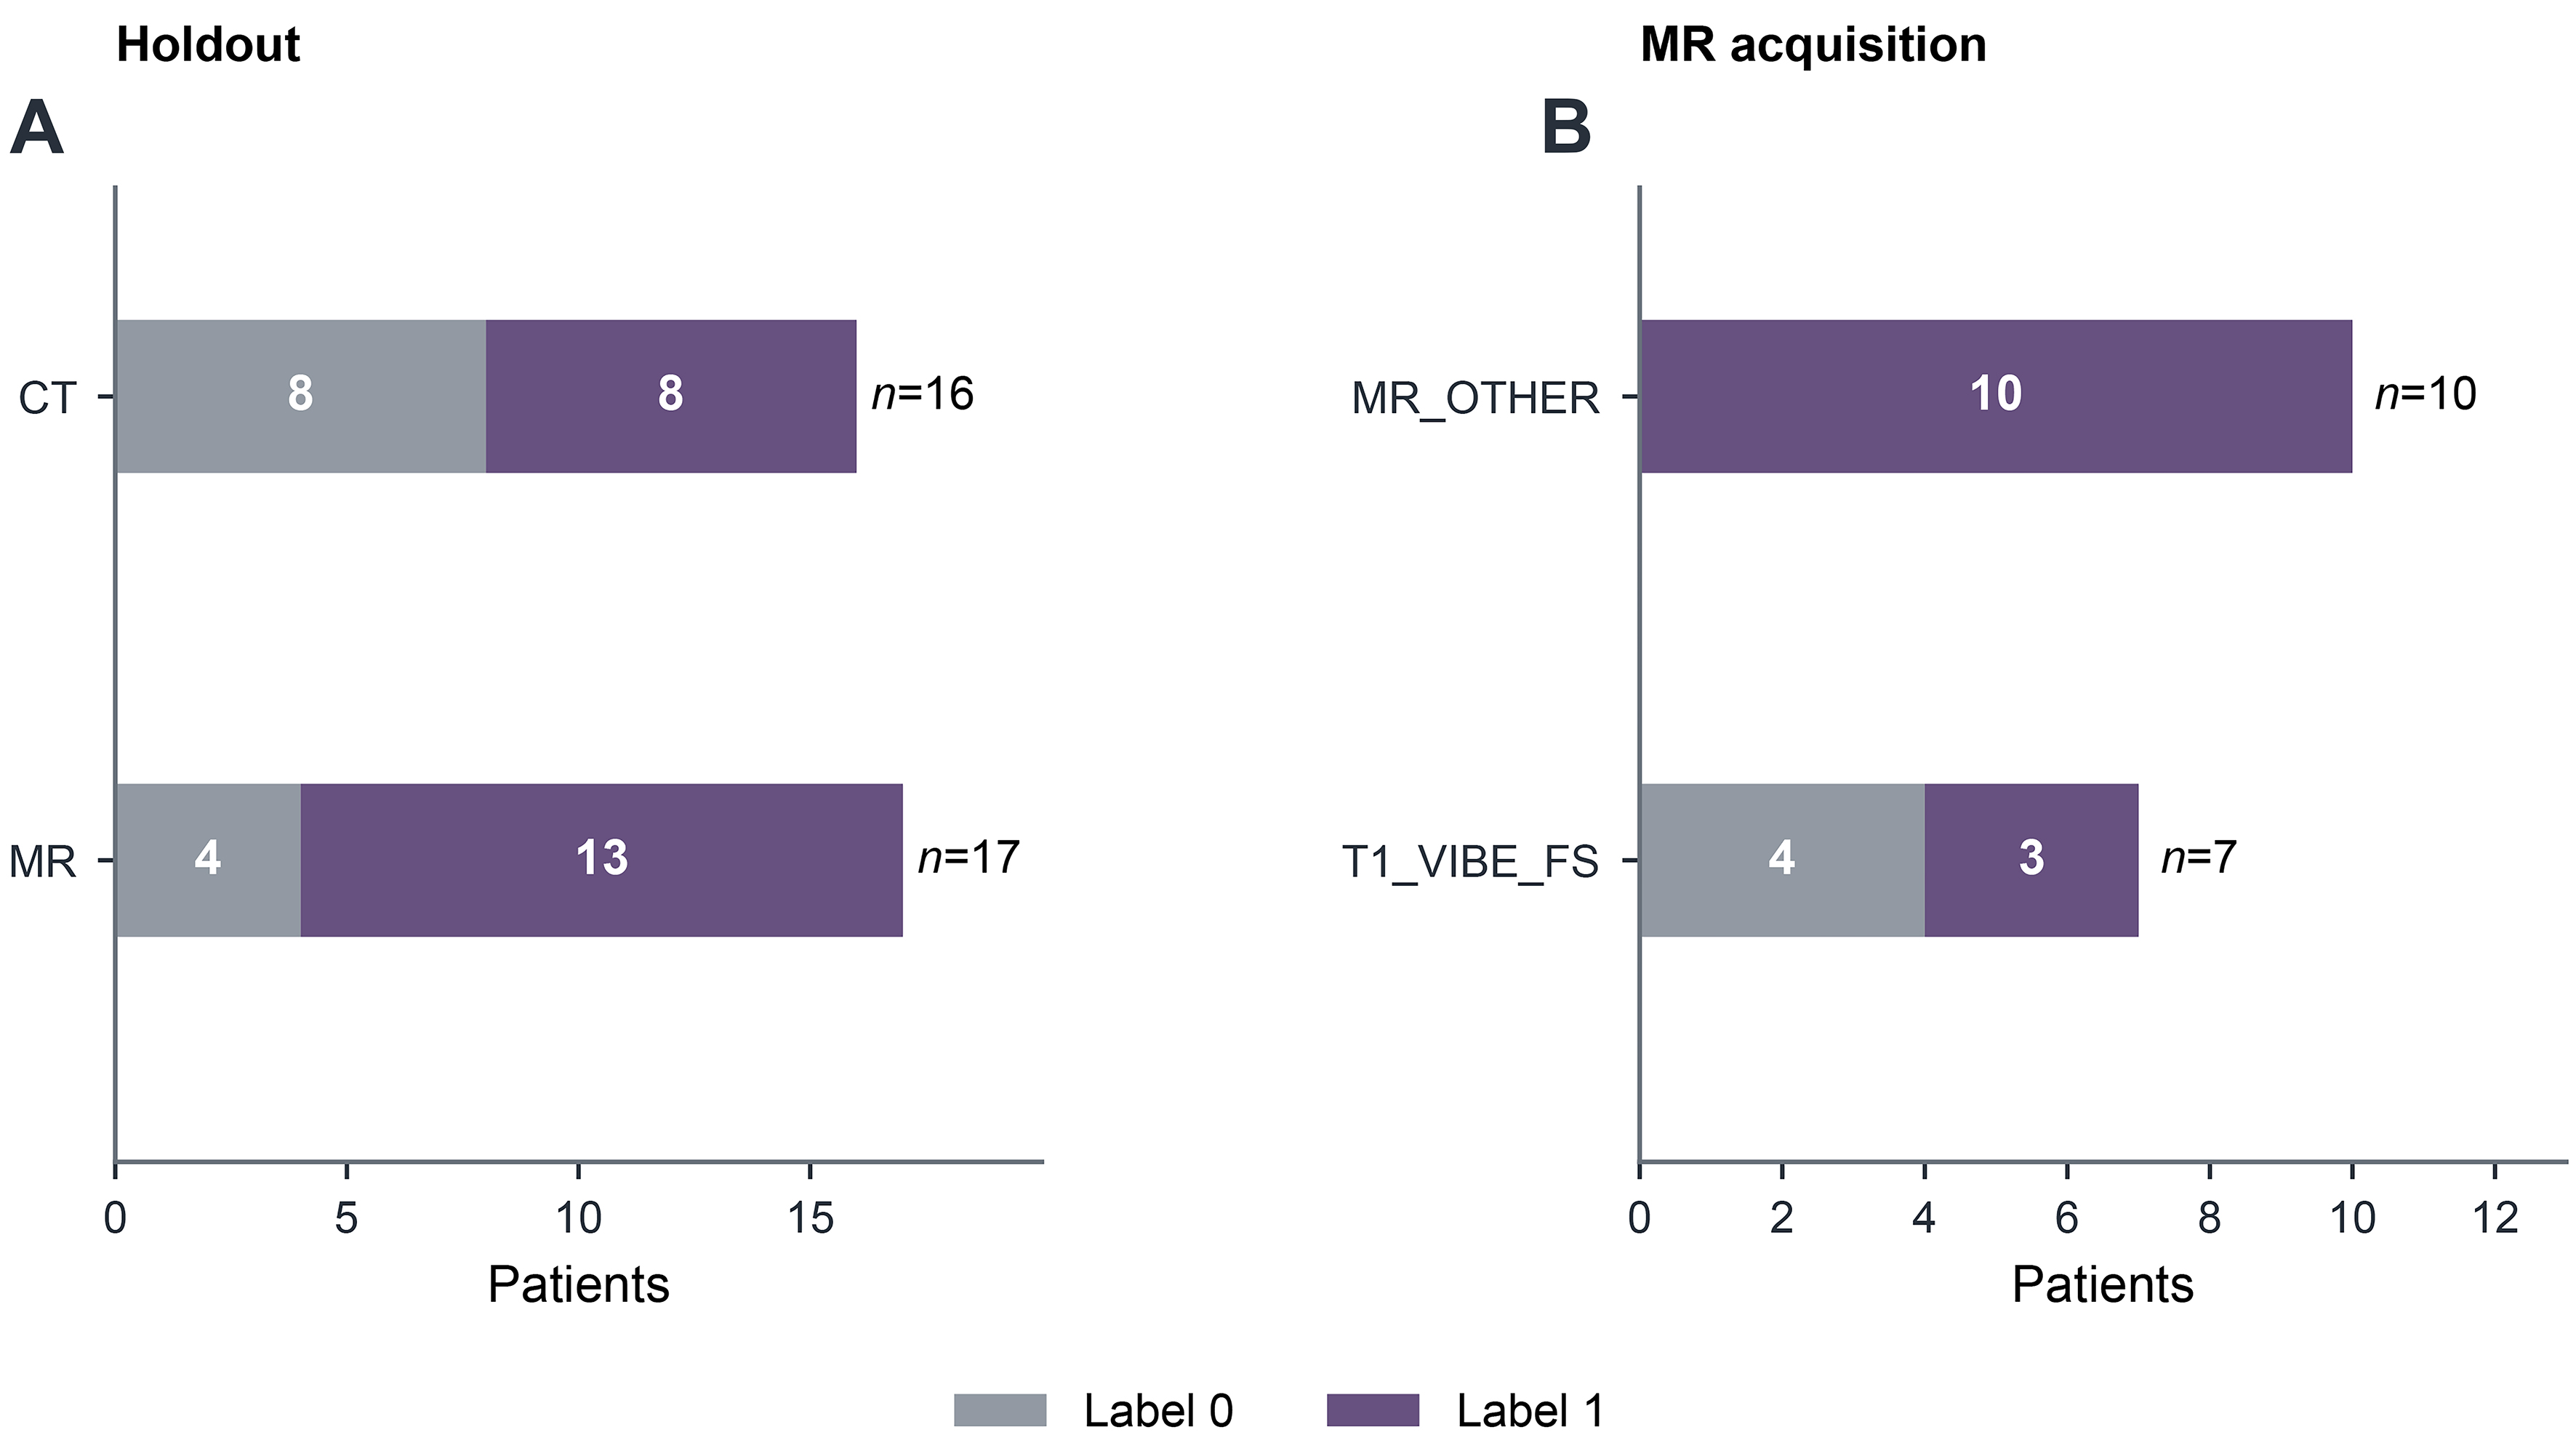
Figure 2. Cohort and acquisition support. (A) Internal holdout label counts for CT (n = 16, 8 label-0 and 8 label-1) and MR (n = 17, 4 label-0 and 13 label-1); (B) filename-derived MR acquisition categories: MR_OTHER contains 10 label-1 and no label-0 patients, so its AUROC is not estimable; T1_VIBE_FS contains 3 label-1 and 4 label-0 patients (n = 7). These identifiers are acquisition proxies and do not establish contrast phases. Labels denote study-documented Cs status, not verified infection-negative and infection-positive groups. AUROC: Area under the receiver operating characteristic curve; CT: computed tomography; Cs: Clonorchis sinensis; MR: magnetic resonance; MR_OTHER and T1_VIBE_FS: filename-derived MR acquisition-category identifiers, not verified imaging protocols or contrast phases.
Cohort composition and patient-level split
| Split | CT label 1 | CT label 0 | MR label 1 | MR label 0 | Total |
| Training | 30 | 31 | 52 | 15 | 128 |
| Internal holdout | 8 | 8 | 13 | 4 | 33 |
| All feature-complete patients | 38 | 39 | 65 | 19 | 161 |
Holdout protocol support
| Holdout support item | Label 1 | Label 0 | n | Interpretation |
| MR_OTHER | 10 | 0 | 10 | AUROC not estimable |
| T1_VIBE_FS | 3 | 4 | 7 | Exploratory sensitivity only |
Exploratory comparison of radiomic representations
Holdout AUROCs were 0.690 for whole-tumor, 0.738 for habitat-only, 0.710 for the combined representation without patient-balanced reclustering, and 0.833 for the patient-balanced combined model. The latter had a training CV AUROC of 0.6915 ± 0.0887. Table 3 and Figure 3 show these descriptive comparisons; the shared holdout and model-search history prevent interpreting their ordering as independently established superiority.
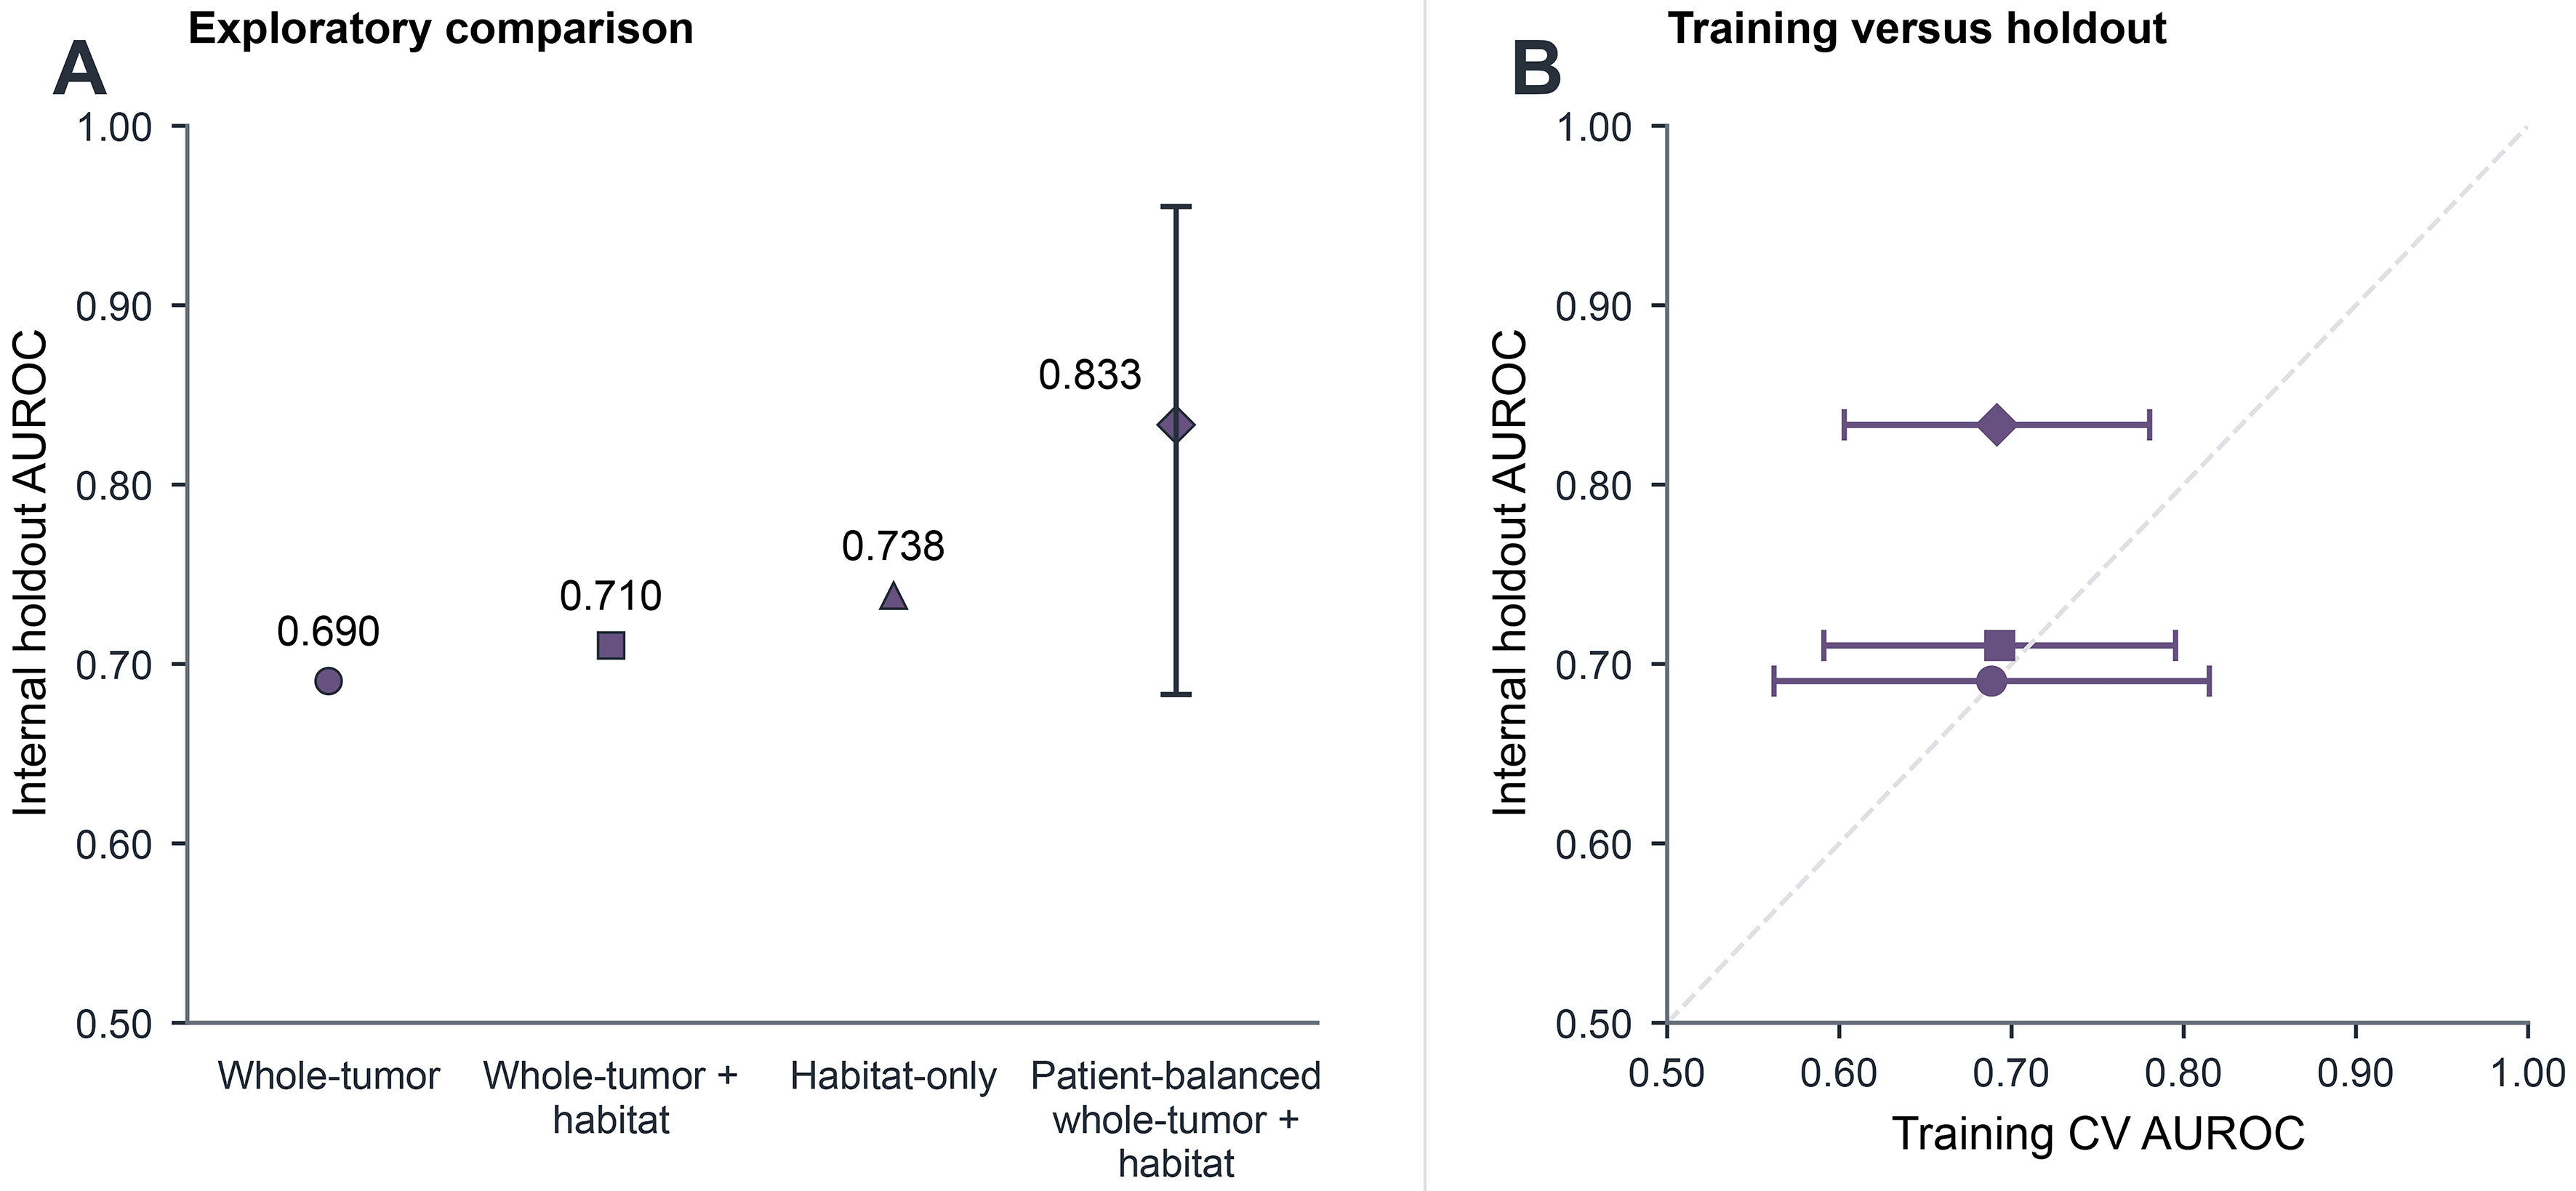
Figure 3. Exploratory representation comparison. (A) Internal holdout AUROC for whole-tumor (0.690), whole-tumor plus habitat (0.710), habitat-only (0.738), and patient-balanced whole-tumor plus habitat (0.833; 95%CI: 0.683-0.955) models, displayed in representation order. Equal marker sizes and a shared color avoid emphasizing a winning model. Intervals were unavailable for the three comparators; (B) training CV mean vs. holdout AUROC; horizontal bars show CV standard deviations. The patient-balanced model had training CV AUROC 0.6915 ± 0.0887. Marker shapes identify the same models in both panels: circle, whole-tumor; square, whole-tumor plus habitat; triangle, habitat-only; diamond, patient-balanced combination. Habitat-only CV results were unavailable. Both panels use AUROC axes from 0.50 to 1.00, and the dashed diagonal denotes equal training and holdout estimates. All models were evaluated on the same reused 33-patient holdout; the comparisons are descriptive, without multiplicity correction or independent model validation. AUROC: Area under the receiver operating characteristic curve; CI: confidence interval; CV: cross-validation; MR_OTHER and T1_VIBE_FS: filename-derived MR acquisition-category identifiers, not verified imaging protocols or contrast phases; n: number of patients.
Exploratory comparison of radiomic models
| Radiomic representation | K | Classifier | Holdout n | Training CV mean ± SD | Holdout AUROC (95%CI) |
| Original habitat | 6 | RF | 33 | - | 0.738 |
| Whole tumor | 0 | SVM | 33 | 0.6885 ± 0.1264 | 0.690 |
| Whole tumor plus habitat | 2 | RF | 33 | 0.6931 ± 0.1021 | 0.710 |
| Patient-balanced whole tumor plus habitat | 2 | ExtraTrees | 33 | 0.6915 ± 0.0887 | 0.833 (0.683-0.955) |
Cluster-validity indices did not uniformly support K = 2 across modalities [Supplementary Figure 1 and Supplementary Table 1]. The original 173-column fused representation and the separate 107-feature MR representation are illustrated in Supplementary Figure 2.
Discrimination and acquisition controls
The patient-balanced combined model achieved holdout AUROC 0.833 (95%CI: 0.683-0.955; n = 33). Subgroup AUROCs were 0.766 for CT (n = 16; 95%CI: 0.483-1.000) and 0.846 for MR (n = 17; 95%CI: 0.617-1.000). Figure 4 shows the empirical receiver operating characteristic (ROC) curve and subgroup AUROC estimates with intervals. The unweighted macro CT/MR AUROC was 0.806 [Supplementary Table 2]. The full model-search inventory is provided in Supplementary Table 3.
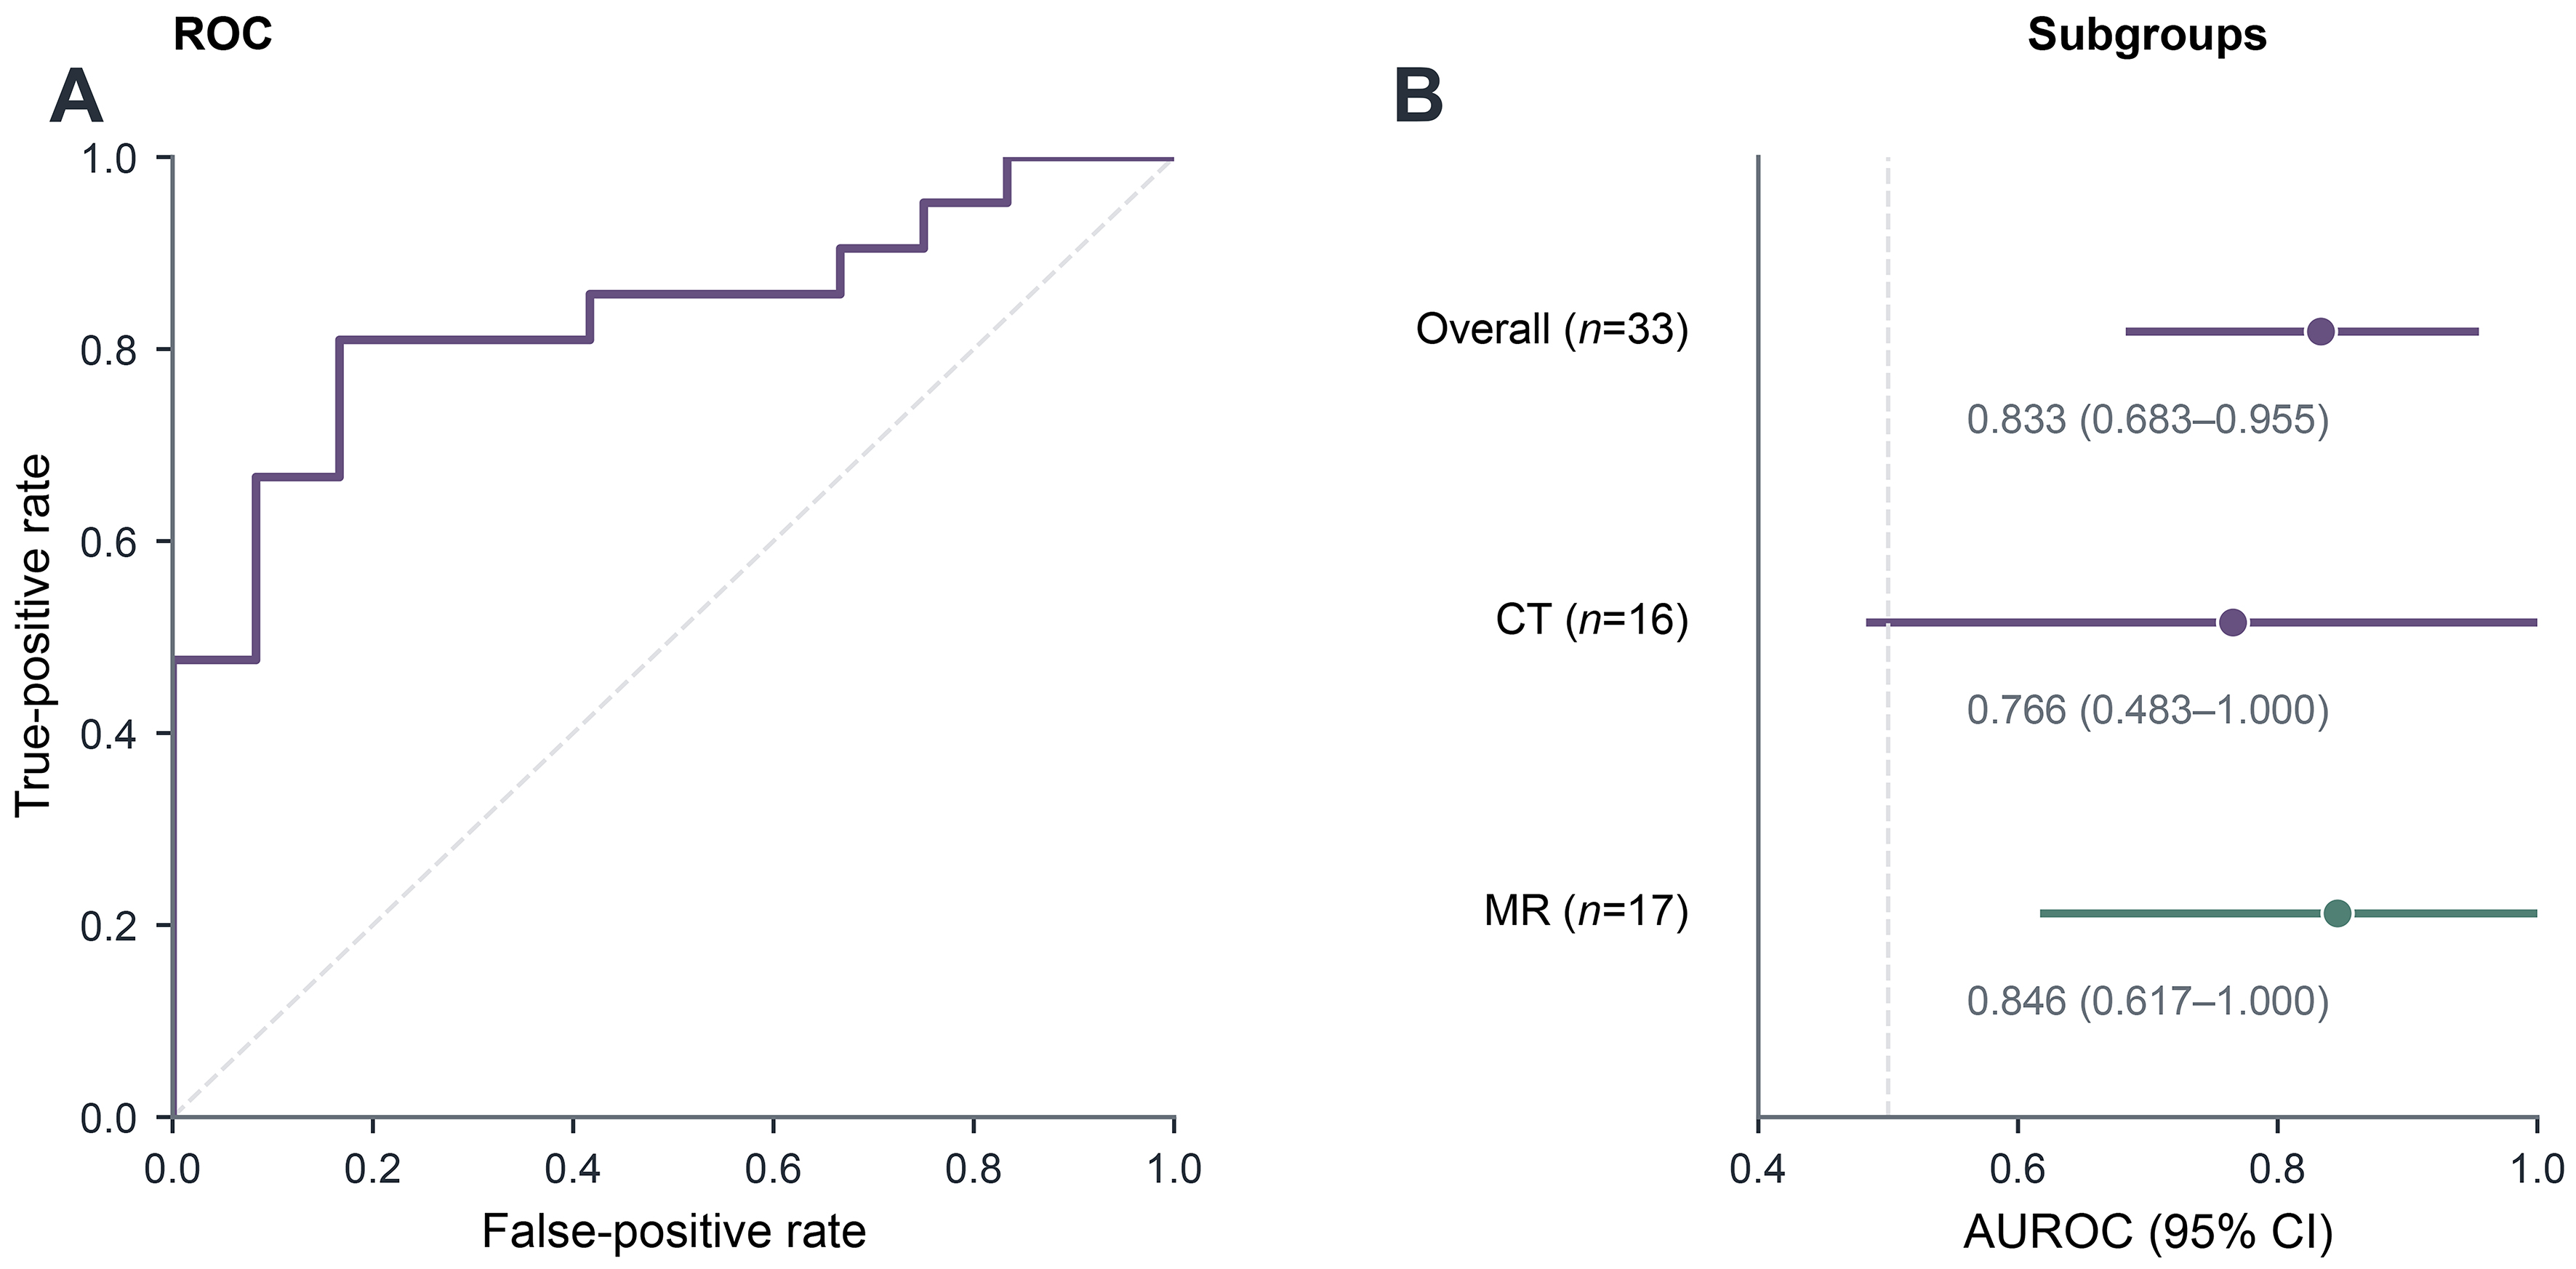
Figure 4. Model discrimination. (A) Overall empirical ROC curve for the historical 33-patient holdout (AUROC 0.833; 95%CI: 0.683-0.955); (B) overall and modality-specific point estimates with bootstrap intervals. The overall AUROC was 0.833 (n = 33), the CT subgroup AUROC was 0.766 (n = 16; 95%CI: 0.483-1.000), and the MR subgroup AUROC was 0.846 (n = 17; 95%CI: 0.617-1.000). Subgroup estimates use the same patient-balanced pooled whole-tumor-plus-habitat candidate and are not separately fitted modality-specific models; the unweighted macro CT/MR mean is retained in Supplementary Table 2 rather than plotted as an independent estimate. The dashed diagonal in (A) denotes chance discrimination. AUROC: Area under the receiver operating characteristic curve; CI: confidence interval; CT: computed tomography; MR: magnetic resonance; ROC: receiver operating characteristic.
The modality-only control achieved AUROC 0.643; the paired image-minus-control difference was +0.190 (95%CI: 0.048-0.339; P = 0.008). Within MR, the acquisition-only control achieved AUROC 0.885, compared with 0.846 for the pooled image model; the paired difference was -0.038 (95%CI: -0.232-0.115; P = 0.742). Thus, discrimination exceeded simple modality membership but did not exceed the MR acquisition proxy. Figure 5 and Table 4 present both comparisons.
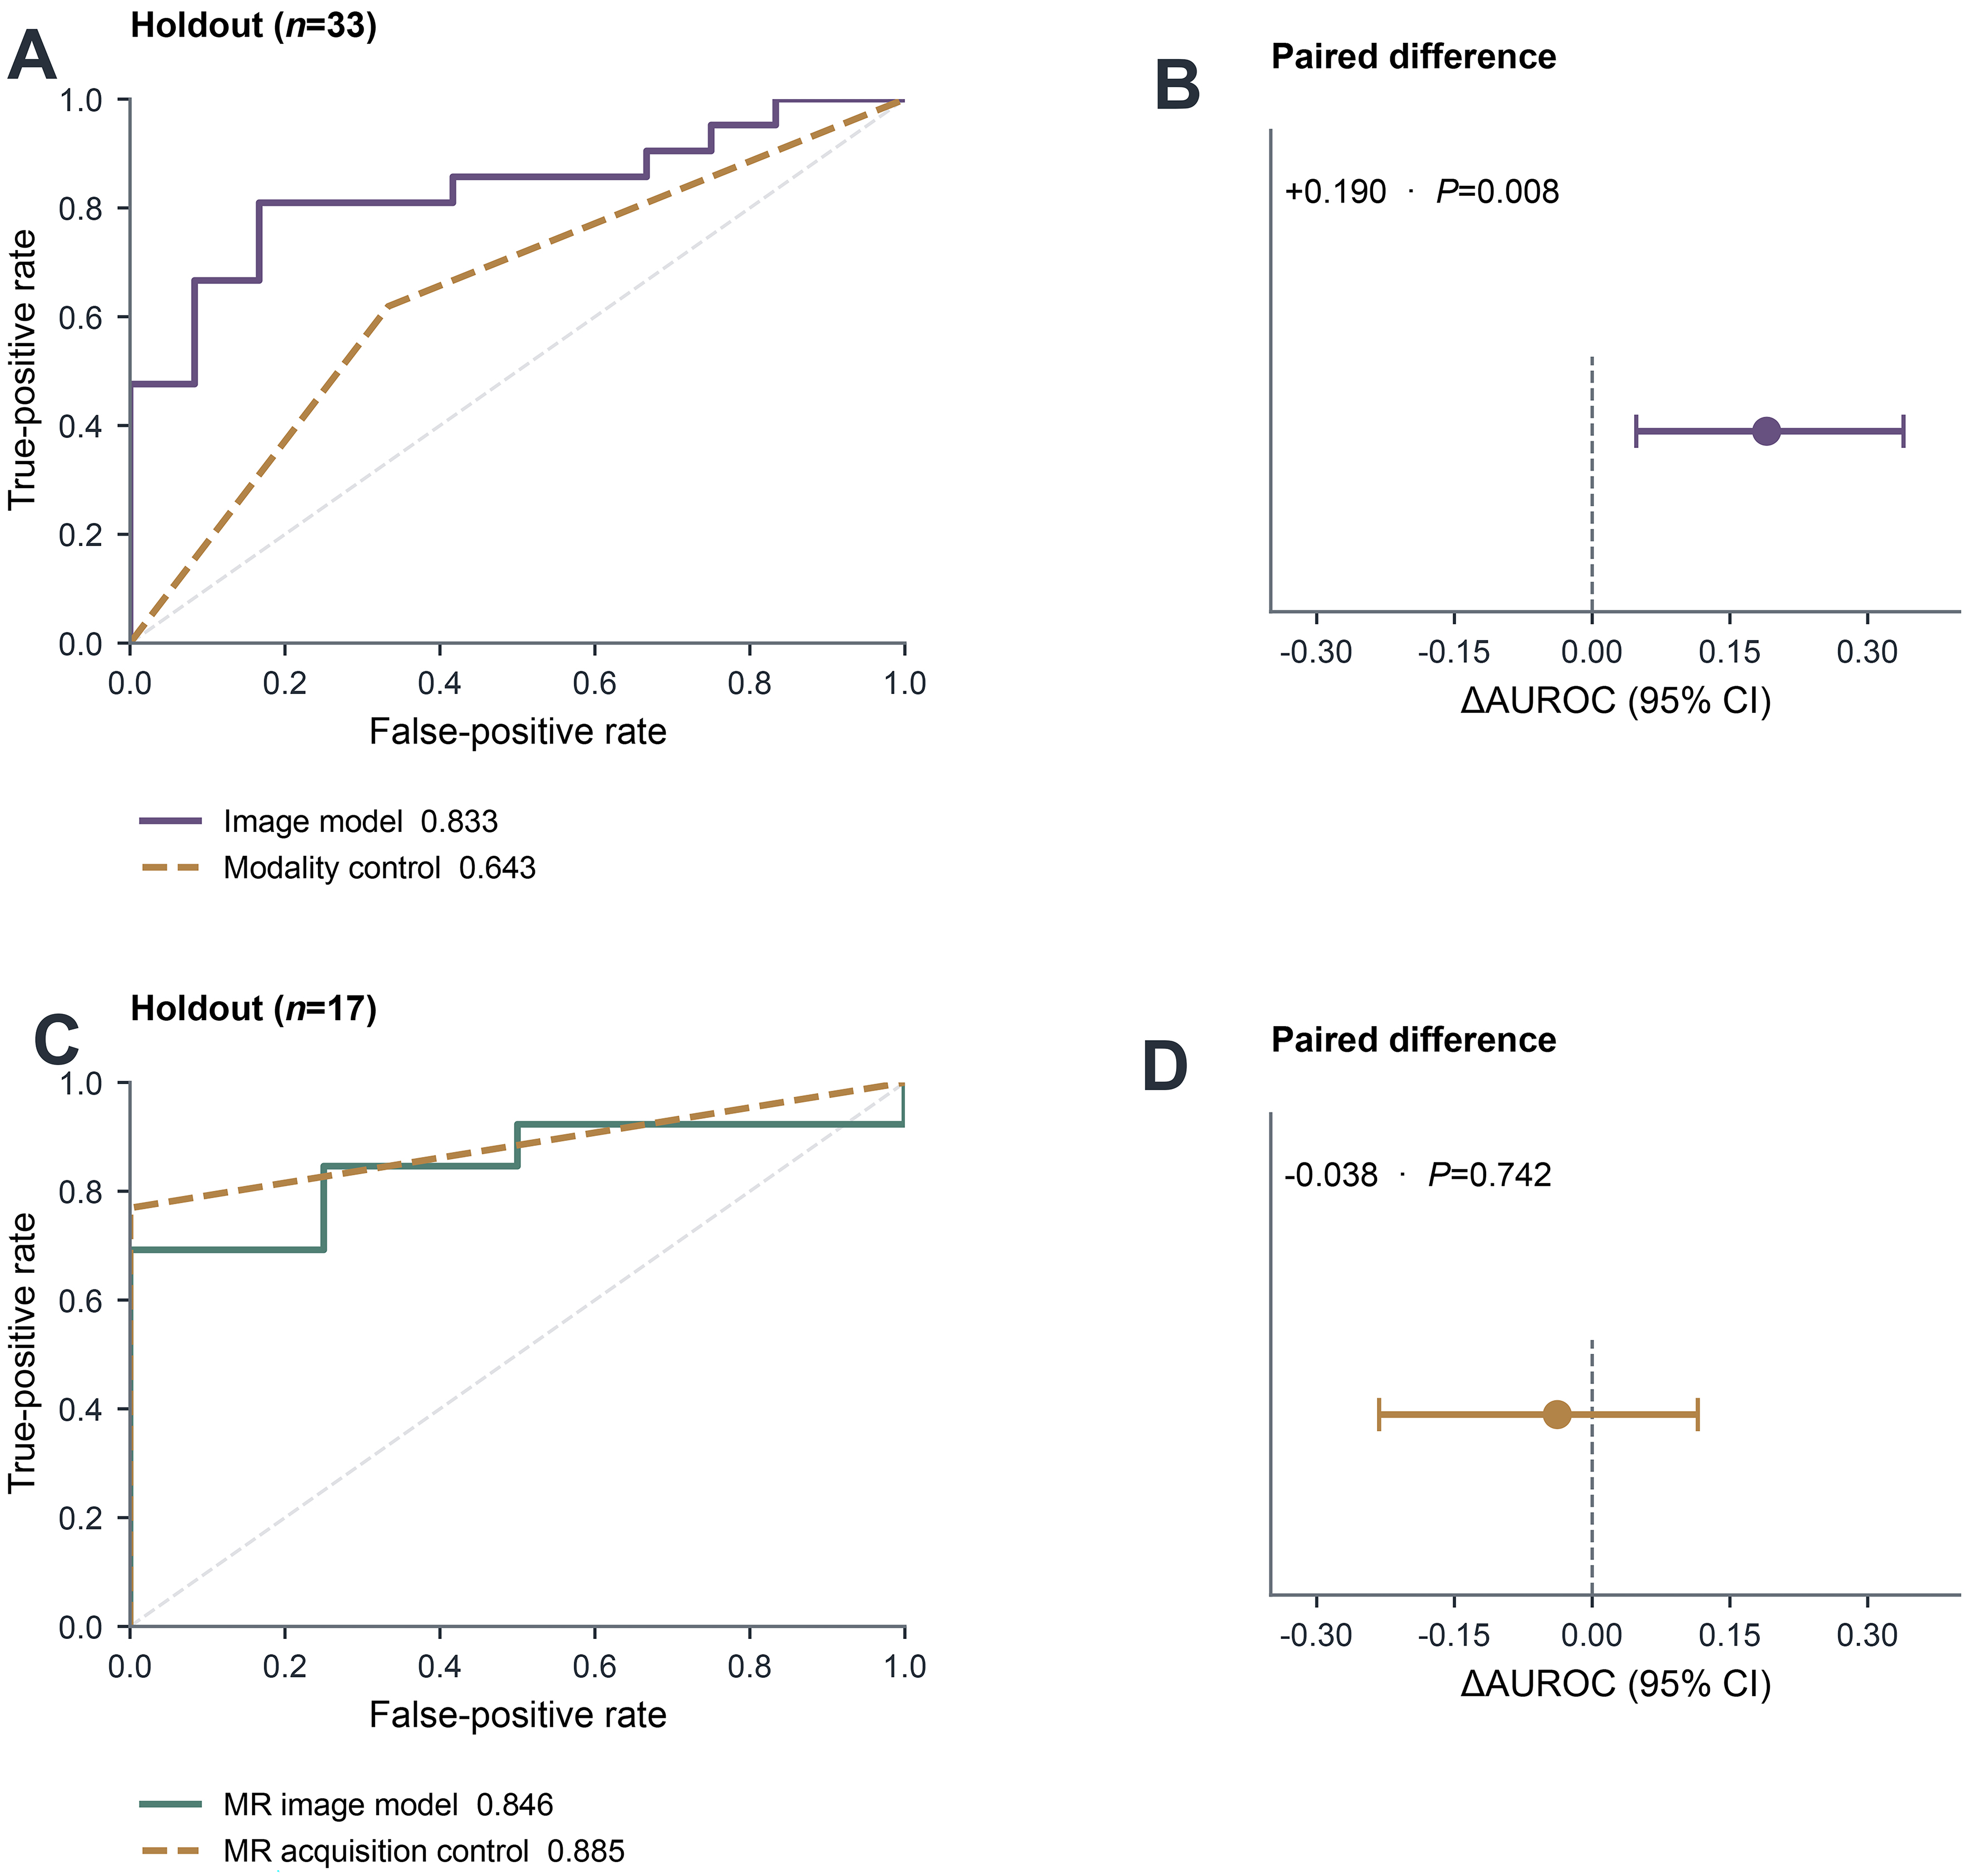
Figure 5. Image and acquisition controls. (A) Empirical pooled candidate and modality-only ROC curves on the same n = 33 holdout (AUROC 0.833 vs. 0.643); (B) paired candidate-minus-modality difference, ΔAUROC +0.190 (95%CI: 0.048-0.339; P = 0.008); (C) empirical pooled-model MR and filename-derived protocol-only ROC curves on the same n = 17 MR holdout (AUROC 0.846 vs. 0.885); (D) paired pooled-MR minus protocol-only difference, ΔAUROC -0.038 (95%CI: -0.232-0.115; P = 0.742). The acquisition-only result limits interpretation of the MR association as independent of acquisition. The dashed ROC diagonals denote chance discrimination; vertical dashed lines in the paired-difference panels mark zero. Paired intervals and two-sided bootstrap P values use 2,000 patient resamples as described in Section 2.8 and Supplementary Methods. AUROC: Area under the receiver operating characteristic curve; CI: confidence interval; CT: computed tomography; ΔAUROC: difference in area under the receiver operating characteristic curve; MR: magnetic resonance; ROC: receiver operating characteristic.
Modality and MR protocol controls
| Analysis | Evaluation subset | n | AUROC (95%CI) | Image-minus-control comparison | Note |
| Patient-balanced pooled image model | Pooled | 33 | 0.833 (0.683-0.955) | - | K = 2; ExtraTrees; elastic-net feature selection |
| Modality-only control | Pooled | 33 | 0.643 (0.477-0.798) | +0.190 (0.048-0.339); P = 0.008 | CT/MR membership only |
| MR subgroup of pooled image model | MR | 17 | 0.846 (0.617-1.000) | - | Same pooled model; no MR-specific refitting |
| MR acquisition-proxy control | MR | 17 | 0.885 (0.767-1.000) | -0.038 (-0.232-0.115); P = 0.742 | Filename-derived acquisition categories |
The pooled image model and modality-only control were compared in the same 33-patient historical internal holdout. Within the 17-patient MR subset, predictions from the same pooled image model were compared with a filename-derived MR acquisition-proxy control. The paired image-minus-control differences in area under the receiver operating characteristic curve (ΔAUROC) were +0.190 (95%CI: 0.048-0.339; P = 0.008) for the modality comparison and -0.038 (95%CI: -0.232-0.115; P = 0.742) for the MR acquisition-proxy comparison. These analyses are exploratory and are based on the reused historical holdout. The acquisition categories are filename-derived internal proxies and do not establish verified imaging protocols or contrast phases. Labels 0 and 1 denote study-documented Cs status; label 0 does not establish active exclusion of infection, and label 1 does not establish active infection.
AUROC was not estimable within the one-class MR_OTHER category (10 label-1 and 0 label-0 patients). Exploratory T1_VIBE_FS sensitivity analyses are reported separately in Supplementary Table 4. Descriptive calibration and DCA results are provided in Supplementary Figures 3 and 4, and Supplementary Table 5; given the small reused holdout, these analyses are not interpreted as evidence of validated calibration, clinical threshold selection, or clinical utility.
Sensitivity and robustness analyses
In the separate 90-patient MR development analysis, AUROC from probabilities averaged across three nested CV repeats was 0.8536 (95%CI: 0.7650-0.9257), with repeat-specific AUROCs from 0.7550 to 0.8771. Acquisition-only controls achieved AUROCs of 0.8000, 0.8004, and 0.7829 for ExtraTrees, logistic regression, and RF, respectively. Only 34 patients (18 label-1, 16 label-0) had acquisition signatures containing both labels. Radiomics AUROC in this subset was 0.6840 (95%CI: 0.4861-0.8523). Figure 6 summarizes the resampling and acquisition findings.
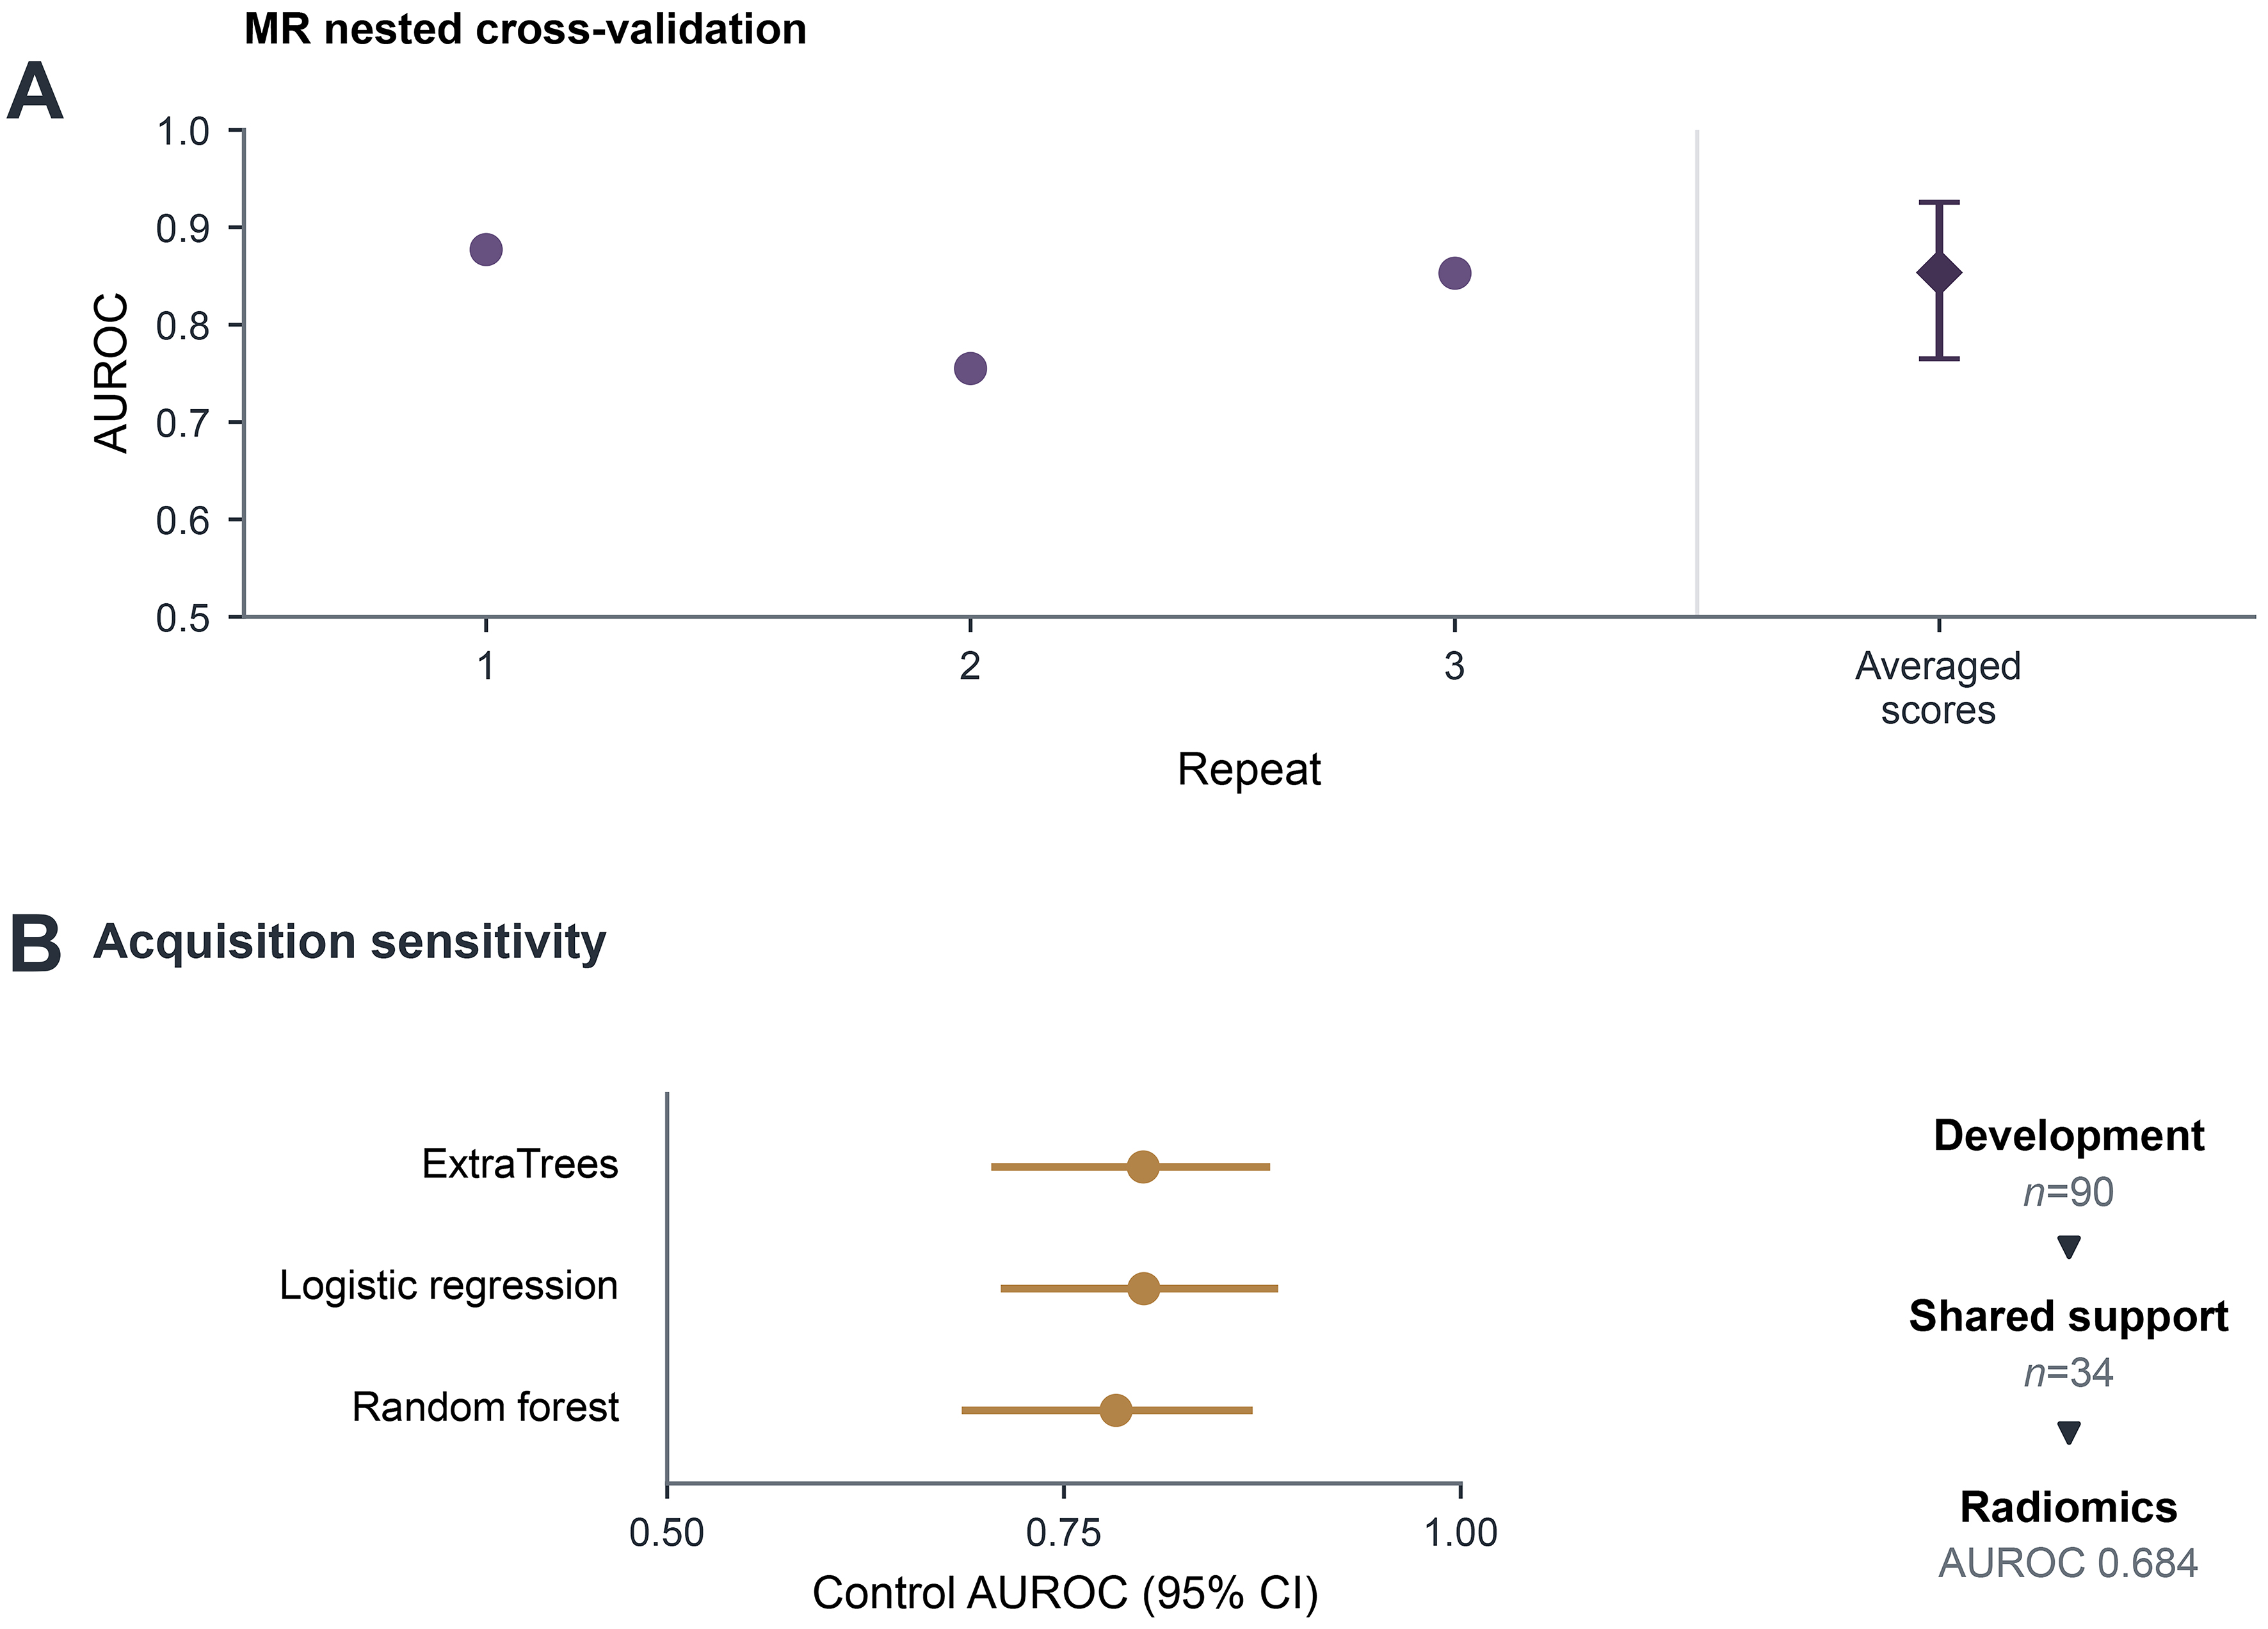
Figure 6. Sensitivity and robustness analyses. (A) Nested CV using 107 original radiomic features from 90 MR development patients, with three repeats of five outer folds. Circles show repeat-specific AUROCs. The diamond and interval show AUROC from each patient’s mean out-of-fold probability across repeats (0.854; bootstrap 95%CI: 0.765-0.926); (B) acquisition-only control AUROCs with 95%CIs, alongside the reduction to 34 patients whose acquisition signatures contain both study labels; nested radiomics AUROC in this subset was 0.684. The separate 16-patient MR holdout was excluded, but 14 development patients overlapped the original 33-patient holdout. These MR analyses use a separate feature representation and do not independently validate the original whole-tumor-plus-habitat model. Contour sensitivity, feature-selection stability, learning curves, and signature-level support are shown in Supplementary Figures 5-7. The study labels do not establish clinically verified infection status. AUROC: Area under the receiver operating characteristic curve; CI: confidence interval; CV: cross-validation; MR: magnetic resonance.
Across 24 features linked to saved MR models, median contour-perturbation ICCs ranged from 0.8613 to 0.9713 and median relative changes from 0.0141 to 0.1126. Median pairwise feature-selection Jaccard was 0.2991 [interquartile range (IQR): 0.2991-1.0000], indicating variation in selected features. Learning-curve performance was nonmonotonic across training sizes of 18-72 patients. Feature-family details and unavailable clinical variables are documented in Supplementary Tables 6 and 7. Detailed contour, feature-selection, learning-curve, and acquisition-support results are in Supplementary Figures 5-7 and Supplementary Table 8. Supplementary Figure 8 summarizes the available supporting records and their scope.
DISCUSSION
Main findings
Whole-tumor and habitat radiomics showed an exploratory association with study-documented Cs status in this retrospective HCC cohort. Three findings frame its interpretation. First, the combined image model discriminated the study labels on internal evaluation, although the estimate was imprecise. Second, it exceeded a modality-only control but did not exceed the acquisition-only control within MR. Third, the separate MR analysis showed lower discrimination after restriction to acquisition signatures containing both labels. Together, these observations suggest that image-derived associations in this dataset cannot be separated confidently from acquisition composition and endpoint uncertainty.
The positive paired comparison with CT/MR membership indicates information beyond that single descriptor. It does not establish incremental clinical value, because liver-disease etiology, tumor burden, and other clinical predictors were unavailable. Likewise, the difference between whole-tumor and combined models cannot establish a benefit from habitats after extensive exploratory model development. The strongest conclusion is an observed association whose clinical and biological specificity remains unresolved.
Relation to previous work
The closest disease-specific reference is Liu et al., who studied 134 HCC patients with gadoxetic acid-enhanced MR imaging and developed radiomics models for liver-fluke infection and cytokeratin 7/19 expression[10]. That work provides a relevant disease and imaging context, but differences in endpoint ascertainment, pooled CT/MR composition, and acquisition controls limit direct performance comparisons.
Bernatowicz et al. evaluated voxel-wise radiomics repeatability and reproducibility in lung CT, including test-retest data, and showed why habitat construction can be sensitive to feature stability[23]. Fang et al. used multi-habitat MR imaging signatures to predict treatment response in locally advanced cervical cancer[24]. Shang et al. evaluated tumoral and peritumoral habitat radiomics in a large multicenter lung CT study with internal validation and external test sets[25]. These studies support the methodological relevance of spatial heterogeneity and reproducibility assessment. Their disease sites, endpoints, acquisition settings, and validation structures differ from the present exploratory association with study-documented Cs status, so no priority or superiority claim is made.
Imaging and methodological interpretation
Habitat summaries offer a way to describe spatial variation that whole-tumor averages can obscure. Chronic hepatobiliary inflammation, epithelial injury, biliary remodeling, and immune-context differences are plausible links between Cs exposure and imaging phenotype[4,6,8,9], but those mechanisms were not measured in this cohort. Separate CT and MR clustering and label-invariant summaries avoid equating habitat indices across modalities, but they do not identify necrosis, inflammation, or a Cs-specific tissue process without histologic correspondence. Contour sensitivity and variation in feature selection further caution against assigning biological meaning to a single fitted feature ranking.
Acquisition controls are especially informative when exposure labels are unevenly distributed across imaging categories. Here, the MR acquisition control discriminated the labels at least as well as the pooled image model, while several signatures contained only one class. Restriction to shared support reduced the sample and the observed AUROC. This pattern is compatible with acquisition-label coupling; it does not prove that acquisition alone caused the image association, because restriction also changes the patient sample and yields a wide interval.
Limitations and future evaluation
Case-level Cs ascertainment, timing, treatment history, and a verified negative reference standard were unavailable. Study labels may mix active infection, previous infection, and classification error. Missing clinical covariates prevent adjustment for major HCC etiologies, liver disease and tumor burden. The results therefore cannot establish infection diagnosis or a Cs-specific imaging phenotype.
The internal holdout was small, reused across model comparisons; protection from all later analytical decisions could not be established. Its performance may be optimistic relative to independent external validation. Its AUROC exceeded the selected model’s training CV mean, and conditional bootstrap intervals do not capture the full model-selection uncertainty. The separate MR development cohort included 14 original holdout patients and used a different feature representation; its nested estimates neither independently validate nor correct the original habitat-model result. No external, temporal, prospective, or center-held-out cohort was available.
Acquisition metadata were incomplete, the MR holdout contained only four label-0 patients, and one acquisition category contained a single class. The shared-support estimate was also imprecise. Neither the controls nor subgroup analyses establish scanner-, sequence-, or institution-independent performance.
The historical segmentation description and available checkpoint could not be fully reconciled. Reader expertise, correction practices, blinding, and multifocal-lesion selection were undocumented. The exact original extraction configuration and feature-to-ROI mapping were incomplete. Synthetic perturbations assessed feature sensitivity rather than reader agreement or model prediction robustness; repeated image/mask pairs were not accounted for in pair-level uncertainty estimates. These limitations restrict reproducibility and biological interpretation.
Future evaluation should prioritize clinically adjudicated Cs endpoints, linked clinical covariates, complete acquisition and segmentation documentation, patient-level isolation and prespecified model development, followed by independent validation. Acquisition-balanced or sequence-matched evaluation would help determine whether the association persists beyond imaging practice. Calibration and decision curves from the current small reused holdout cannot establish clinical utility.
Conclusion
Whole-tumor and habitat radiomics were associated with study-documented Cs status in this retrospective HCC cohort. Discrimination exceeded a modality-only control but did not exceed an MR acquisition-only control, and the separate MR shared-support analysis yielded a lower AUROC. These findings support a narrow exploratory association under substantial acquisition coupling and endpoint uncertainty, requiring clinically verified labels, clinical adjustment and independent evaluation before diagnostic interpretation.
DECLARATIONS
Authors’ contributions
Conceptualization: Huang Y, Xie Y, Cai J, Peng T
Methodology: Huang Y, Xie Y, Cai J
Formal analysis: Huang Y
Data curation: Huang L, Zhang H
Dataset provision and clinical research direction: Peng T
Validation and interpretation of the radiomics workflow and study limitations: Huang Y, Xie Y, Cai J
writing - original draft: Huang Y
writing - review and editing: Huang Y, Huang L, Zhang H, Xie Y, Cai J, Peng T
Supervision and project administration: Xie Y, Cai J, Peng T
All authors reviewed and approved the manuscript and accept responsibility for the work.
Availability of data and materials
Patient-level images, masks, labels, and prediction files are not publicly available because the project data are confidential. Public release of the analysis code and additional derived data has not been authorized. Aggregate results are provided in the manuscript and Supplementary Materials.
AI and AI-assisted tools statement
During the preparation of this manuscript, Codex (OpenAI) was used to assist with language editing, figure and document scripts, and verification of consistency between stored outputs and their presentation. The authors identify ChatGPT (OpenAI; GPT-5.6 Sol, released 2026-07-09) as the writing tool. In addition, ImageGen (OpenAI; GPT-Image, version 2.0, released 2026-04-21) was used to produce layout concepts for Figures 1-6, Supplementary Figures 1-8, and the Graphical Abstract. All final medical images, regions of interest (ROIs), habitat maps, and statistical plots were rendered deterministically from project source images or saved numerical outputs; generated medical pixels and numerical observations were not used as scientific results. The authors reviewed and verified all AI-assisted text, scripts, and figure layouts and retained responsibility for all scientific decisions and the final content.
Financial support and sponsorship
None.
Conflicts of interest
Xie Y and Peng T are Guest Editors of the special issue entitled “New Imaging Perspectives for HCC in the Era of Personalized Medicine and Artificial Intelligence” in Hepatoma Research. Peng T is also an Editorial Board Member of Hepatoma Research. Xie Y and Peng T were not involved in any steps of editorial processing, notably including reviewers’ selection, manuscript handling, and decision-making. The other authors declare no conflicts of interest.
Ethical approval and consent to participate
The study was approved by the Medical Ethics Committee of the First Affiliated Hospital of Guangxi Medical University (reference 2025-E0322; 24 April 2025) and was conducted in accordance with the Declaration of Helsinki. The authors confirm that this approval covers the present retrospective CT/MR radiomics analysis and that the requirement for patient informed consent was waived because the study used previously collected de-identified data without additional intervention or patient contact.
Consent for publication
Not applicable.
Copyright
© The Author(s) 2026.
Supplementary Materials
REFERENCES
1. Marrero JA, Kulik LM, Sirlin CB, et al. Diagnosis, staging, and management of hepatocellular carcinoma: 2018 Practice Guidance by the American Association for the Study of Liver Diseases. Hepatology 2018;68:723-50.
2. Choi JY, Lee JM, Sirlin CB. CT and MR imaging diagnosis and staging of hepatocellular carcinoma: part I. Development, growth, and spread: key pathologic and imaging aspects. Radiology 2014;272:635-54.
3. Chernyak V, Fowler KJ, Kamaya A, et al. Liver imaging reporting and data system (LI-RADS) version 2018: imaging of hepatocellular carcinoma in at-risk patients. Radiology 2018;289:816-30.
4. Kim TS, Pak JH, Kim JB, Bahk YY. Clonorchis sinensis, an oriental liver fluke, as a human biological agent of cholangiocarcinoma: a brief review. BMB Rep 2016;49:590-7.
5. Huang Y, Chen W, Wang X, et al. The carcinogenic liver fluke, Clonorchis sinensis: new assembly, reannotation and analysis of the genome and characterization of tissue transcriptomes. PLoS One 2013;8:e54732.
6. Koda S, Zhu XQ, Zheng KY, Yan C. Molecular mechanisms of clonorchis sinensis-host interactions and implications for vaccine development. Front Cell Dev Biol 2021;9:781768.
7. Yang QL, Lu XW, Fang ZL, et al. The association between Clonorchis sinensis seropositivity and hepatocellular carcinoma in an endemic area: a study in Guangxi, China. BMC Infect Dis 2025;25:270.
8. Lin Q, Tang Z, Qin Y, et al. Clonorchis sinensis infection amplifies hepatocellular carcinoma stemness, predicting unfavorable prognosis. PLoS Negl Trop Dis 2024;18:e0011906.
9. Chen J, Wei C, Huang W, et al. Clonorchis sinensis-infected hepatocellular carcinoma exhibits distinct tumor microenvironment and molecular features. Front Immunol 2025;16:1526699.
10. Liu JQ, Wang J, Huang XL, et al. A radiomics model based on magnetic resonance imaging to predict cytokeratin 7/19 expression and liver fluke infection of hepatocellular carcinoma. Sci Rep 2023;13:17553.
11. Lambin P, Rios-Velazquez E, Leijenaar R, et al. Radiomics: extracting more information from medical images using advanced feature analysis. Eur J Cancer 2012;48:441-6.
12. Aerts HJ, Velazquez ER, Leijenaar RT, et al. Decoding tumour phenotype by noninvasive imaging using a quantitative radiomics approach. Nat Commun 2014;5:4006.
13. Lambin P, Leijenaar RTH, Deist TM, et al. Radiomics: the bridge between medical imaging and personalized medicine. Nat Rev Clin Oncol 2017;14:749-62.
14. Ji GW, Zhu FP, Xu Q, et al. Machine-learning analysis of contrast-enhanced CT radiomics predicts recurrence of hepatocellular carcinoma after resection: a multi-institutional study. EBioMedicine 2019;50:156-65.
15. Ji GW, Zhu FP, Xu Q, et al. Radiomic features at contrast-enhanced CT predict recurrence in early stage hepatocellular carcinoma: a multi-institutional study. Radiology 2020;294:568-79.
16. Park HJ, Kim JH, Choi SY, et al. Prediction of therapeutic response of hepatocellular carcinoma to transcatheter arterial chemoembolization based on pretherapeutic dynamic CT and textural findings. AJR Am J Roentgenol 2017;209:W211-20.
17. Chen Y, Xia Y, Tolat PP, et al. Comparison of conventional gadoxetate disodium-enhanced MRI features and radiomics signatures with machine learning for diagnosing microvascular invasion. AJR Am J Roentgenol 2021;216:1510-20.
18. Feng ST, Jia Y, Liao B, et al. Preoperative prediction of microvascular invasion in hepatocellular cancer: a radiomics model using Gd-EOB-DTPA-enhanced MRI. Eur Radiol 2019;29:4648-59.
19. Wang Q, Sheng Y, Jiang Z, Liu H, Lu H, Xing W. What imaging modality is more effective in predicting early recurrence of hepatocellular carcinoma after hepatectomy using radiomics analysis: CT or MRI or both? Diagnostics 2023;13:2012.
20. Castaldo A, De Lucia DR, Pontillo G, et al. State of the art in artificial intelligence and radiomics in hepatocellular carcinoma. Diagnostics 2021;11:1194.
21. Harding-Theobald E, Louissaint J, Maraj B, et al. Systematic review: radiomics for the diagnosis and prognosis of hepatocellular carcinoma. Aliment Pharmacol Ther 2021;54:890-901.
22. Brancato V, Cerrone M, Garbino N, Salvatore M, Cavaliere C. Current status of magnetic resonance imaging radiomics in hepatocellular carcinoma: a quantitative review with Radiomics Quality Score. World J Gastroenterol 2024;30:381-417.
23. Bernatowicz K, Grussu F, Ligero M, Garcia A, Delgado E, Perez-Lopez R. Robust imaging habitat computation using voxel-wise radiomics features. Sci Rep 2021;11:20133.
24. Fang M, Kan Y, Dong D, et al. Multi-habitat based radiomics for the prediction of treatment response to concurrent chemotherapy and radiation therapy in locally advanced cervical cancer. Front Oncol 2020;10:563.
25. Shang Y, Zeng Y, Luo S, et al. Habitat imaging with tumoral and peritumoral radiomics for prediction of lung adenocarcinoma invasiveness on preoperative chest CT: a multicenter study. AJR Am J Roentgenol 2024;223:e2431675.
26. Shan QY, Hu HT, Feng ST, et al. CT-based peritumoral radiomics signatures to predict early recurrence in hepatocellular carcinoma after curative tumor resection or ablation. Cancer Imaging 2019;19:11.
27. Zhang Y, Wang S, Song M, et al. MRI-based intra- and peritumoral heterogeneity in hepatocellular carcinoma for microvascular invasion prediction and prognostic risk stratification. Radiol Imaging Cancer 2025;7:e250066.
28. Isensee F, Jaeger PF, Kohl SAA, Petersen J, Maier-Hein KH. nnU-Net: a self-configuring method for deep learning-based biomedical image segmentation. Nat Methods 2021;18:203-11.
29. van Griethuysen JJM, Fedorov A, Parmar C, et al. Computational radiomics system to decode the radiographic phenotype. Cancer Res 2017;77:e104-7.
30. Zwanenburg A, Vallières M, Abdalah MA, et al. The image biomarker standardization initiative: standardized quantitative radiomics for high-throughput image-based phenotyping. Radiology 2020;295:328-38.
Cite This Article
 Open Access
How to Cite
Huang Y, Huang L, Zhang H, Xie Y, Cai J, Peng T. Exploratory whole-tumor and habitat radiomic associations with study-documented Clonorchis sinensis status in hepatocellular carcinoma. Hepatoma Res. 2026;12:65. https://dx.doi.org/10.20517/2394-5079.2026.64
Download Citation
If you have the appropriate software installed, you can download article citation data to the citation manager of your choice. Simply select your manager software from the list below and click on download.
Export Citation File
Type of Import
Tips on Downloading Citation
Citation Manager File Format
Type of Import
Direct Import: When the Direct Import option is selected (the default state), a dialogue box will give you the option to Save or Open the downloaded citation data. Choosing Open will either launch your citation manager or give you a choice of applications with which to use the metadata. The Save option saves the file locally for later use.
Indirect Import: When the Indirect Import option is selected, the metadata is displayed and may be copied and pasted as needed.
About This Article
Special Topic
Copyright

Data & Comments
Data
0











Comments
Comments must be written in English. Spam, offensive content, impersonation, and private information will not be permitted. If any comment is reported and identified as inappropriate content by OAE staff, the comment will be removed without notice. If you have any queries or need any help, please contact us at [email protected].