
fig4
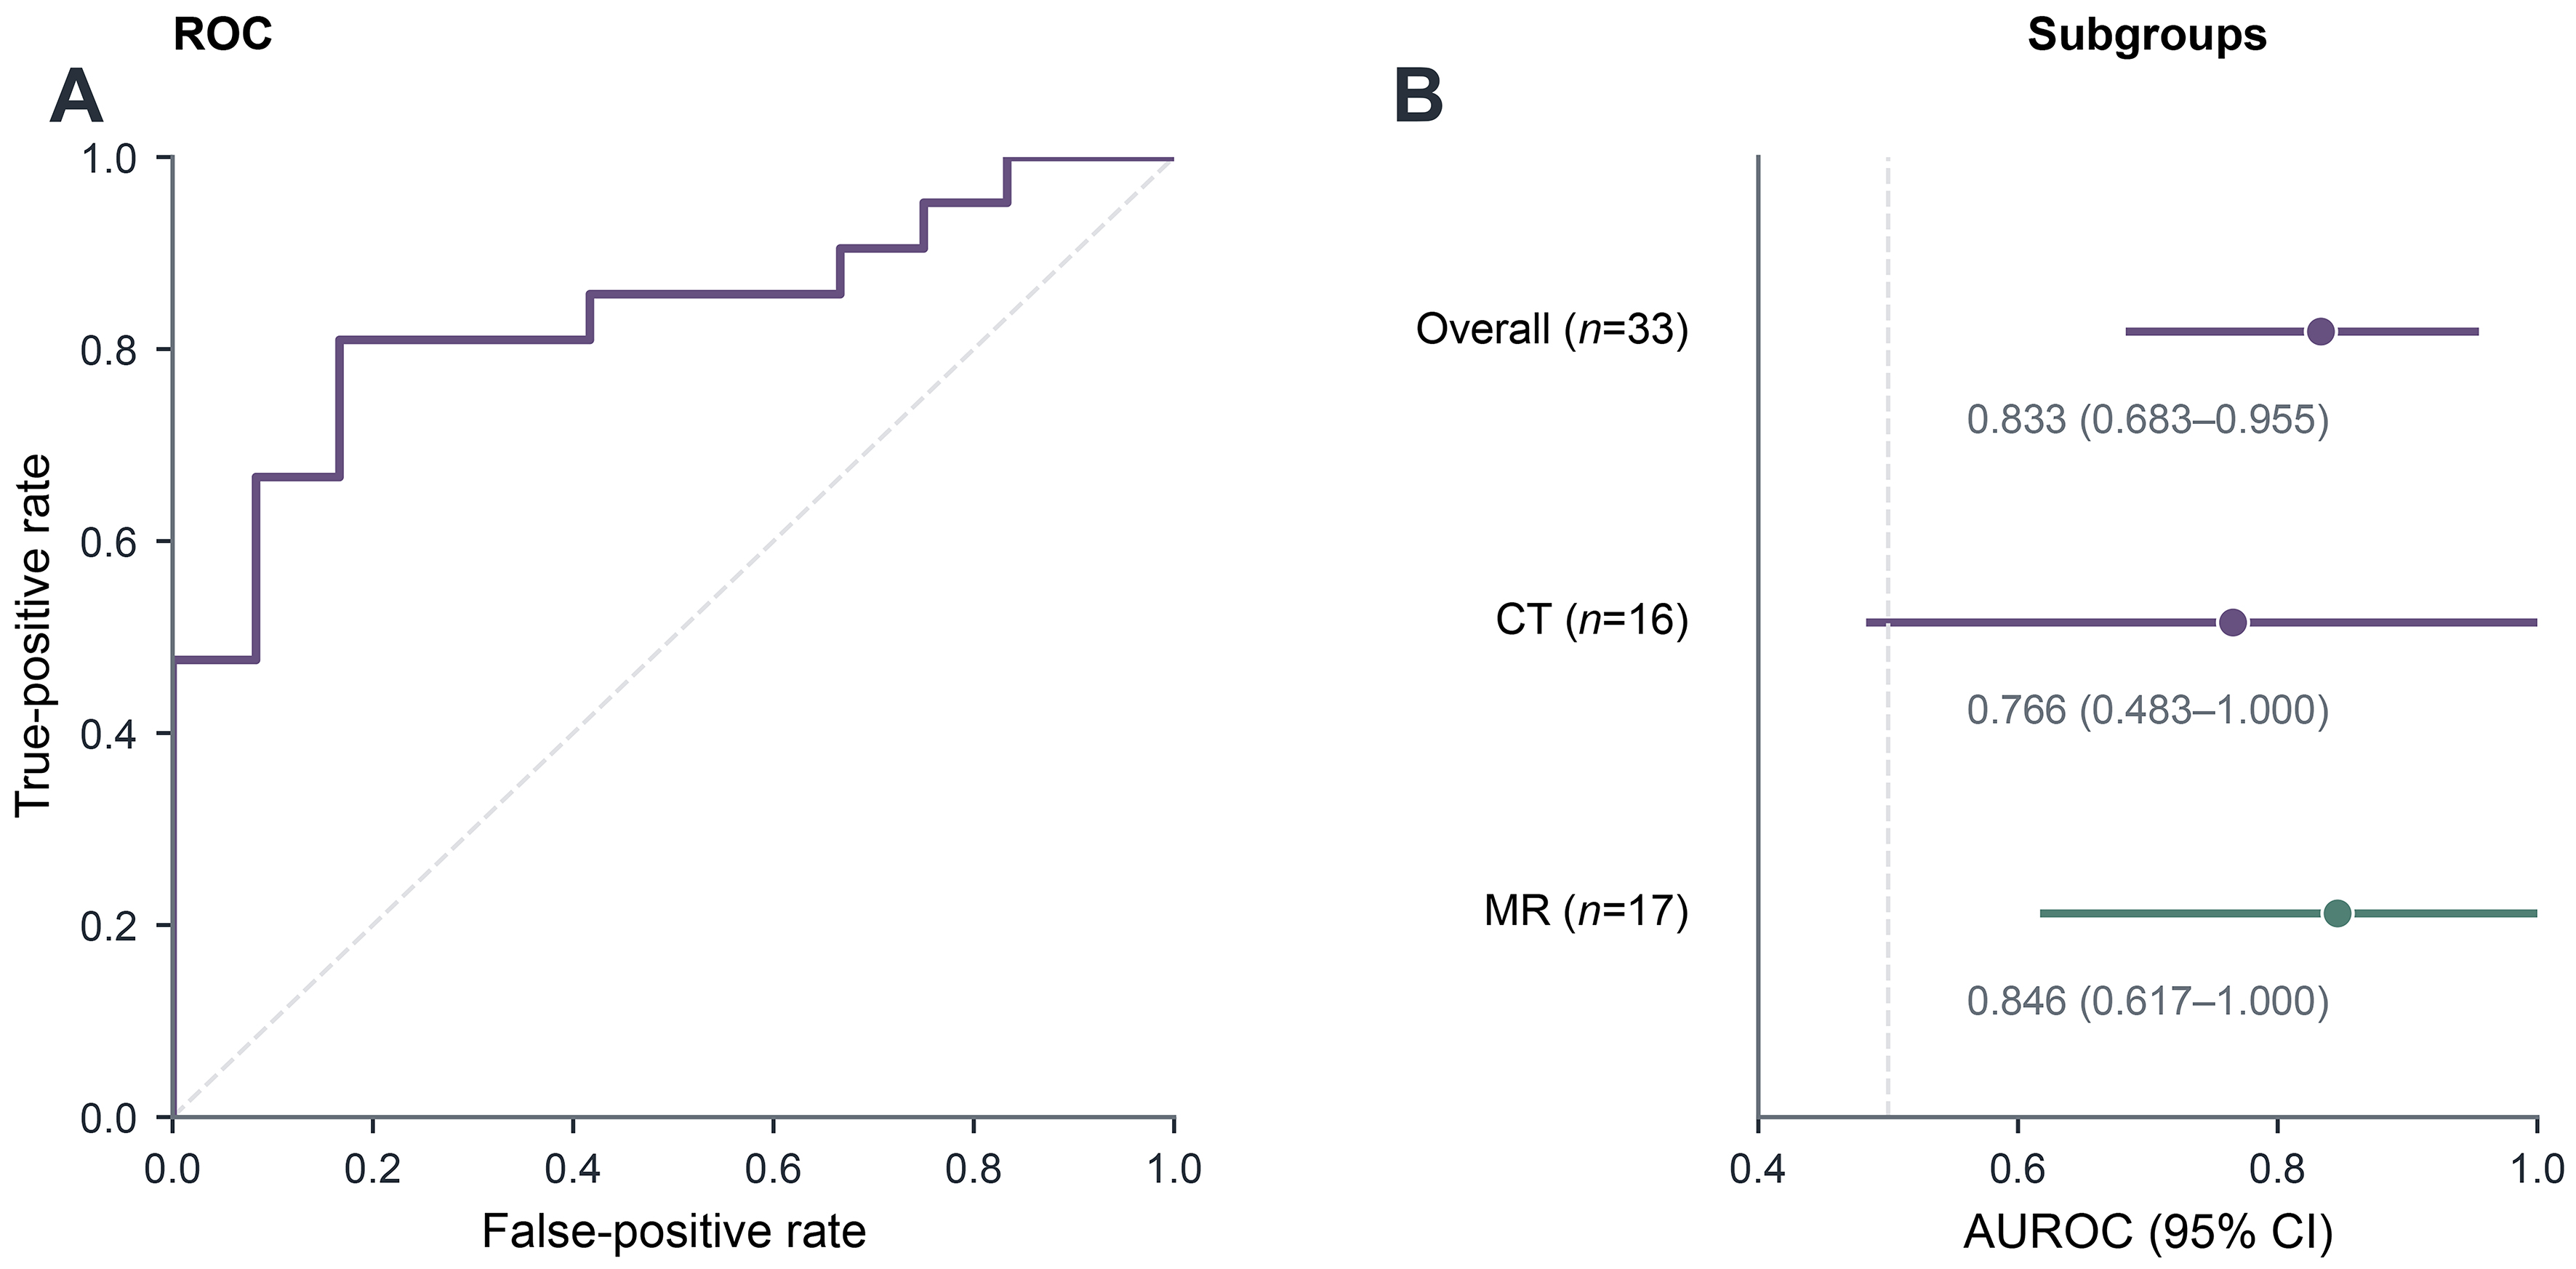
Figure 4. Model discrimination. (A) Overall empirical ROC curve for the historical 33-patient holdout (AUROC 0.833; 95%CI: 0.683-0.955); (B) overall and modality-specific point estimates with bootstrap intervals. The overall AUROC was 0.833 (n = 33), the CT subgroup AUROC was 0.766 (n = 16; 95%CI: 0.483-1.000), and the MR subgroup AUROC was 0.846 (n = 17; 95%CI: 0.617-1.000). Subgroup estimates use the same patient-balanced pooled whole-tumor-plus-habitat candidate and are not separately fitted modality-specific models; the unweighted macro CT/MR mean is retained in Supplementary Table 2 rather than plotted as an independent estimate. The dashed diagonal in (A) denotes chance discrimination. AUROC: Area under the receiver operating characteristic curve; CI: confidence interval; CT: computed tomography; MR: magnetic resonance; ROC: receiver operating characteristic.