
fig5
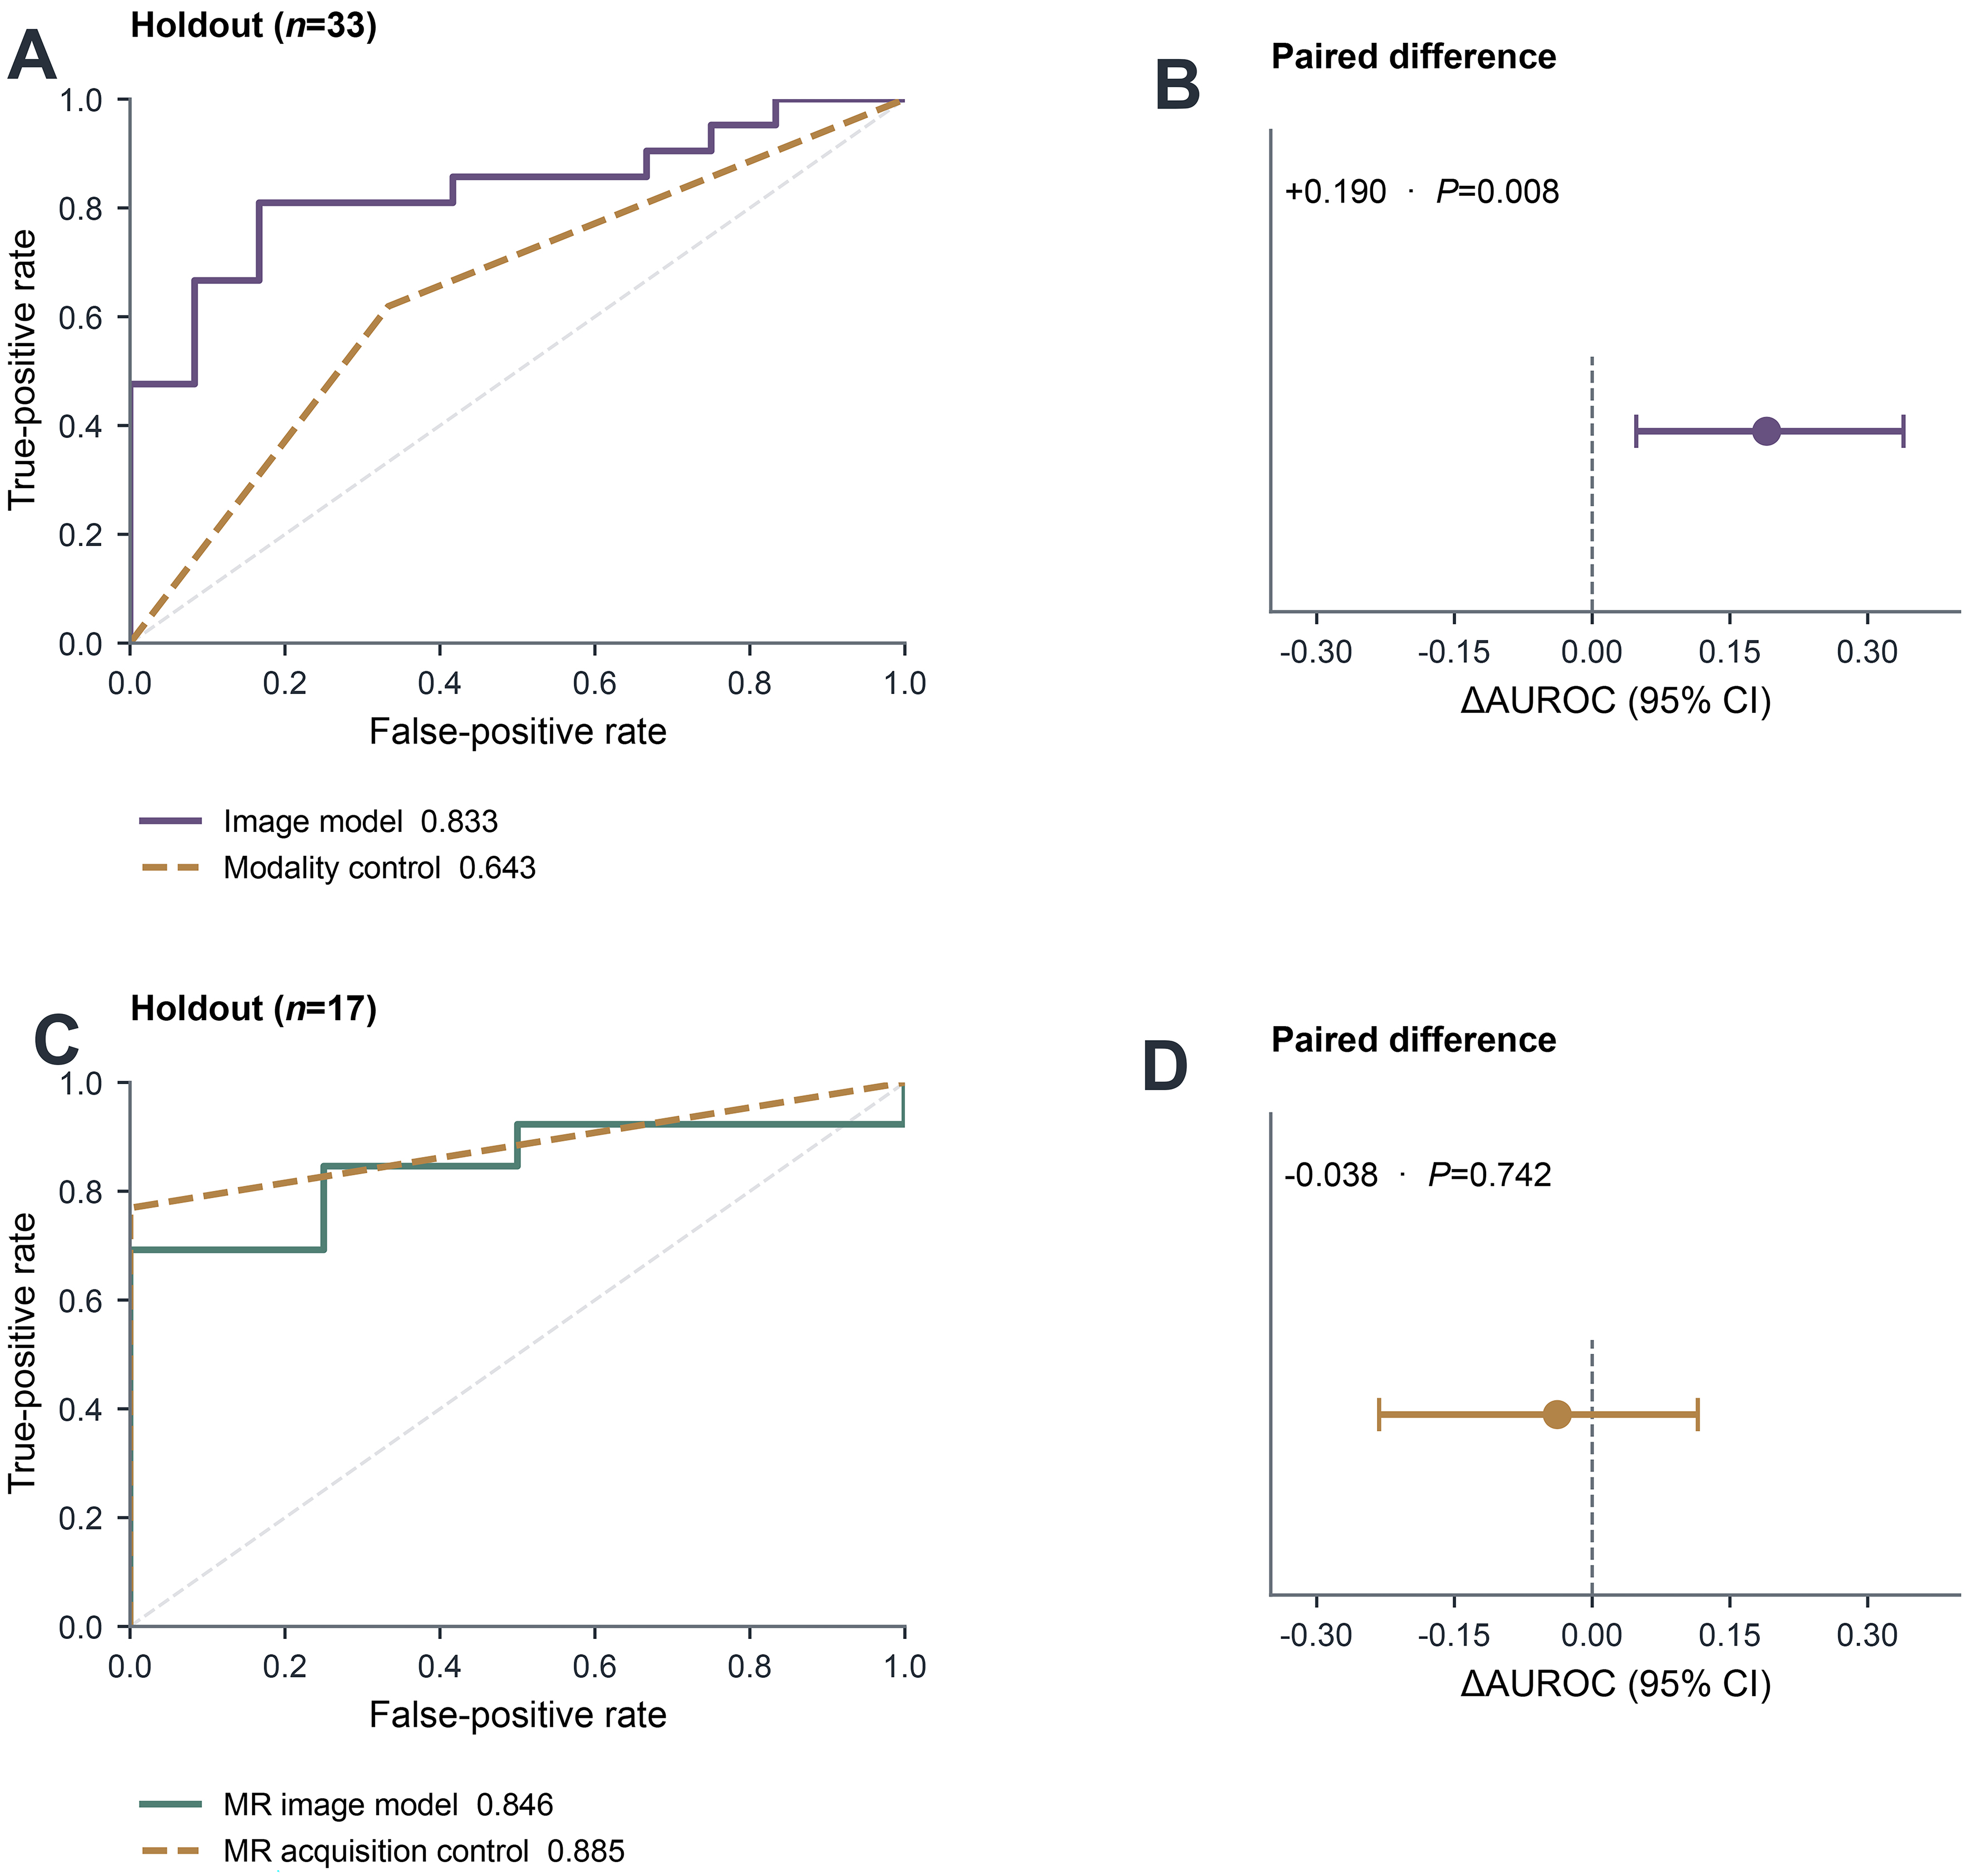
Figure 5. Image and acquisition controls. (A) Empirical pooled candidate and modality-only ROC curves on the same n = 33 holdout (AUROC 0.833 vs. 0.643); (B) paired candidate-minus-modality difference, ΔAUROC +0.190 (95%CI: 0.048-0.339; P = 0.008); (C) empirical pooled-model MR and filename-derived protocol-only ROC curves on the same n = 17 MR holdout (AUROC 0.846 vs. 0.885); (D) paired pooled-MR minus protocol-only difference, ΔAUROC -0.038 (95%CI: -0.232-0.115; P = 0.742). The acquisition-only result limits interpretation of the MR association as independent of acquisition. The dashed ROC diagonals denote chance discrimination; vertical dashed lines in the paired-difference panels mark zero. Paired intervals and two-sided bootstrap P values use 2,000 patient resamples as described in Section 2.8 and Supplementary Methods. AUROC: Area under the receiver operating characteristic curve; CI: confidence interval; CT: computed tomography; ΔAUROC: difference in area under the receiver operating characteristic curve; MR: magnetic resonance; ROC: receiver operating characteristic.