


Censor-aware semi-supervised survival time prediction in lung cancer using clinical and radiomics features
 0
0 Abstract
Aim: Lung cancer remains a major global health challenge, and this study presents a censor-aware semi-supervised learning framework (SSL) that integrates clinical and imaging data to improve prognostic modeling and address biases in handling censored data.
Methods: We analyzed clinical, positron emission tomography (PET), and computed tomography (CT) data from 199 lung cancer patients from public and local databases, focusing on overall survival time as the primary outcome. Handcrafted (HRF) and Deep Radiomics features were extracted after preprocessing using Visualized & Standardized Environment for Radiomics Analysis (ViSERA) software and were combined with clinical features. Features were reduced using Pearson’s correlation coefficient regression (RR) and the F-test for regression (FR), followed by supervised learning (SL) and SSL. In SSL, censored data were pseudo-labeled using the Weibull accelerated failure time (AFT) model to enrich the training data. Seven regressors and three hazard ratio survival analyses (HRSAs) were optimized using five-fold cross-validation, grid search, and holdout test bootstrapping.
Results: For PET-HRFs, the SSL approach reduced the mean absolute error by 14.81%, achieving 1.04 years with FR + AdaBoost Regression (ABR) compared to 1.20 years with SL. For clinical features, SSL with RR + ABR reached a mean absolute error of 1.04 years, outperforming SL (1.09 years) with a 4.9% improvement. In HRSA, CT_HRF combined with principal component analysis (PCA) + Component-Wise Gradient Boosting Survival Analysis yielded an external C-index of 0.65 ± 0.02, effectively distinguishing high- and low-risk groups.
Conclusions: The SSL strategy applied to HRFs from PET imaging significantly enhanced survival prediction compared to SL and uncovered complementary biological information that may remain hidden when only limited labeled data are used.
Keywords
INTRODUCTION
Lung cancer remains the leading cause of cancer-related mortality worldwide, with nearly 2 million cases and deaths reported in 2020 and projections rising to 3.8 million by 2050[1]. Accurate overall survival (OS) prediction is critical for guiding clinical decision making, optimizing treatment strategies, and advancing personalized care[2,3]. Reliable prognostic models also enable patient stratification into risk groups, which supports tailored therapeutic planning and improves clinical outcomes.
Traditional survival analysis methods, such as Cox proportional hazards models and random survival forests, focus on hazard rates but struggle with high-dimensional data and substantial right censoring, leading to biased or unstable predictions[4,5]. While regression-based approaches offer a direct prediction of survival time, they are still limited when censoring is extensive. Censor-aware and semi-supervised learning (SSL) strategies have emerged as promising alternatives, as they leverage censored data, improving prediction accuracy and robustness in clinical settings[6,7].
Supervised learning (SL) methods require large amounts of labeled data, which are often unavailable due to incomplete follow-up or censoring in clinical practice. SSL provides a compelling solution by utilizing both labeled and unlabeled data, enabling censored observations to meaningfully contribute to model training. This approach has demonstrated improved performance in medical imaging, particularly where labels are scarce or incomplete, making it ideal for survival outcome prediction in lung cancer[8].
Clinical features (CFs) such as age, stage, and surgical history are strong predictors of survival, while radiomics offers high-dimensional tumor descriptors from medical images. Handcrafted radiomics features (HRFs) provide standardized measures of tumor texture and morphology, whereas deep radiomics features (DRFs) capture complex, non-linear tumor biology through deep learning models[9-11]. Combining HRFs, DRFs, and CFs has shown superior predictive performance compared to single-modality models, but challenges such as data quality, standardization, and interpretability remain[12,13]. These challenges highlight the need for an integrated, censor-aware SSL framework capable of leveraging both radiomic and clinical features to improve lung cancer survival prediction.
Previous studies on survival prediction have predominantly relied on single-modality data, HRFs, or fully SL methods that exclude censored cases, limiting their ability to leverage the full scope of available information[8,14-19]. To overcome these limitations, we introduce a censor-aware SSL framework that seamlessly integrates HRFs and DRFs from positron emission tomography (PET) and computed tomography (CT) imaging with CFs. A significant innovation of our approach is the incorporation of censored data within an accelerated failure time (AFT) regression framework, enabling the direct prediction of survival times while fully utilizing censored follow-up data, which has been largely ignored in previous models. In addition, we enhance the model’s interpretability and transparency by applying SHapley Additive exPlanations (SHAP), providing a clear understanding of how specific features impact survival predictions. This dual approach not only improves the model’s robustness but also allows for a more nuanced risk stratification by identifying high-risk patients who may benefit from intensified therapy and sparing low-risk patients from unnecessary interventions. We systematically evaluate seven regression algorithms and compare our censor-aware SSL regression with state-of-the-art survival models, demonstrating the complementary value of combining HRFs and DRFs with clinical variables. By leveraging both censored and unlabeled data-a common challenge in clinical settings-our framework significantly enhances treatment personalization, paving the way for more precise and actionable survival predictions.
METHODS AND MATERIALS
Patient demographics and clinical data
We utilized clinical data, as well as PET and CT images from a total of 199 patients, sourced from the BC Cancer database (https://www.bccancer.bc.ca/health-professionals/professional-resources/bc-cancer-registry/request-registry-data) (n = 166) from 2006 to 2016, and Cancer Imaging Archive (TCIA) Radiogenomics[20]
Demographic and clinicopathologic features of patients
| Characteristics | Tumor features | ||
| Source (BC Cancer/TCIA) | 166 (83.5%)/33 (16.5%) | Histology | |
| Sex (male/female) | 100 (51%)/99 (49%) | Non-small cell carcinoma* | 24 (12%) |
| Age (mean ± SD) | Range: 24-87 (68 ± 10.11) | Squamous cell carcinoma | 46 (23%) |
| Ethnicity | Adenocarcinoma | 109 (55%) | |
| Asian | 26 (13%) | Acinar cell carcinoma | 3 (1.5%) |
| Unknown | 173 (87%) | Neuroendocrine | 3 (1.5%) |
| Smoking/Not smoking | 166/33 (Average of 36.4 smoking pack years) | Combined small cell carcinoma | 1 (0.5%) |
| Interventions | Large cell carcinoma | 1 (0.5%) | |
| Adenosquamous | 3 (1.5%) | ||
| Surgery category | Unknown | 9 (4.5%) | |
| Lobectomy | 87 (43%) | Stage at diagnosis | |
| Segmentectomy | 13 (7%) | IA | 32 (16%) |
| Pneumonectomy | 4 (2%) | IIA | 54 (27%) |
| Unknown | 95 (48%) | IIB | 32 (16%) |
| Chemotherapy | lllA | 3 (2%) | |
| Yes | 59 (30%) | Unknown | 78 (39%) |
| No | 140 (70%) | Metastasis | |
| Radiation therapy | Yes | 64 (32%) | |
| Yes | 74 (37%) | No | 102 (51.5%) |
| No | 31 (16%) | Unknown | 33 (16.5%) |
| Unknown | 94 (47%) | ||
Study procedure
In the preprocessing step, PET images were first registered to CT (Figure 1, part i); then the Standardized Uptake Value (SUV) correction (ii) was applied to PET images, and CT images were clipped (iii), and all images were finally normalized by the min/max technique (iv)[21,22]. These are elaborated in Supplementary Section 1.1. Regions of Interest (ROIs), which represented the tumor volume, were outlined by experienced medical experts to extract imaging features (v). Subsequently, two different feature extraction frameworks were employed. A total of 215 HRFs were obtained from the segmented tumor regions in both PET and CT images using the standardized Python-based Standardized Environment for Radiomics Analysis (PySERA) module in Visualized & Standardized Environment for Radiomics Analysis (ViSERA) software[23]. Moreover, 1,024 DRFs were extracted from the same images through a
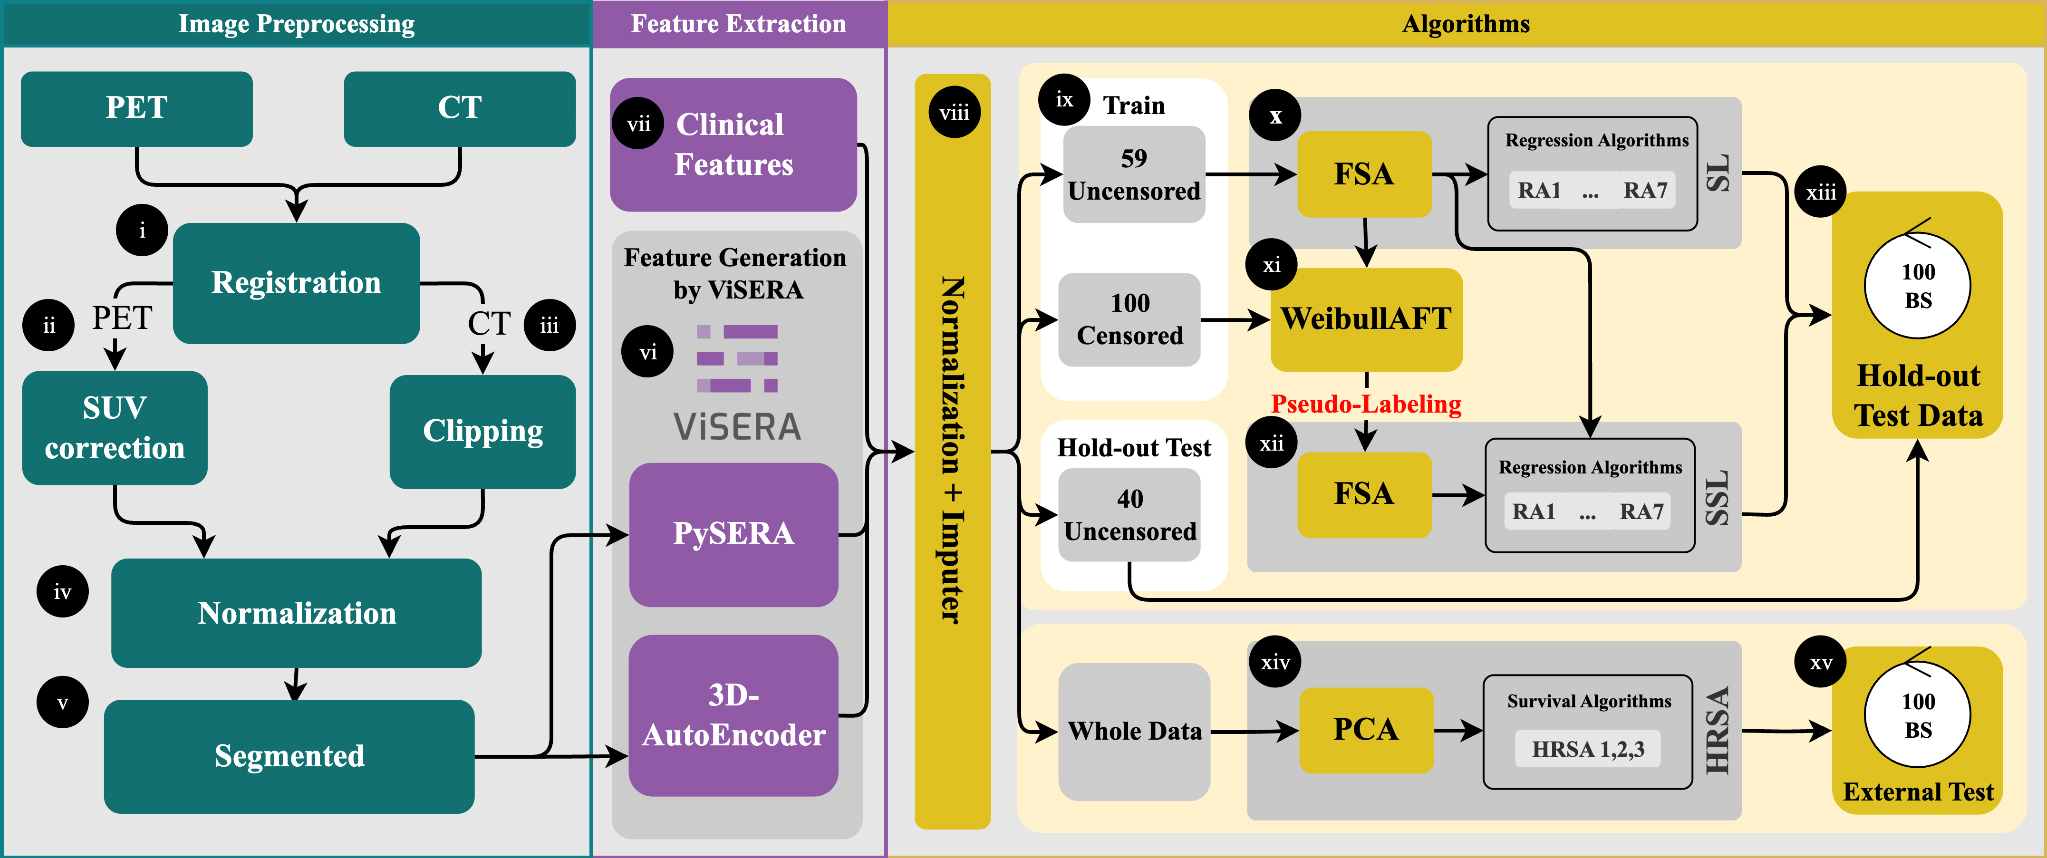
Figure 1. Preprocessing included PET-to-CT registration, SUV correction, CT clipping, and min-max normalization (i-iv). Tumor ROIs were delineated for feature extraction (v), yielding 215 handcrafted radiomics features (HRFs) and 1024 deep radiomics features (DRFs) (vi), which were combined with clinical features (CFs) to generate 13 datasets (vii). After dataset generation, features were normalized, missing values imputed, and the data split into an uncensored holdout set (40 cases) and censored vs. uncensored training sets (100/59 cases) (viii-ix). Feature selection (RR and FR) reduced dimensionality to 20 features, followed by training with seven regression algorithms (x-xii). Survival modeling used both supervised (SL) and semi-supervised (SSL) strategies, with pseudo-labeling applied to censored cases. Model performance was evaluated on the holdout set using MAE, C-index, log-rank tests, and SHAP-based feature importance (xiii-xiv). External validation was conducted on 33 TCIA patients (xv). PET: Positron emission tomography; CT: computed tomography; ROIs: regions of interest; RR: Pearson’s correlation coefficient regression; FR: F-test for regression; MAE: mean absolute error; SHAP: SHapley Additive exPlanations; TCIA: cancer imaging archive.
Then, these 59 uncensored cases were used to train a Weibull AFT model, which learned the relationship between features and survival outcomes (xi). For 100 censored patients, pseudo-survival times were generated by predicting the median survival and adding Gaussian noise scaled by the 10th-90th percentile prediction interval to account for uncertainty. The pseudo-labeled cases were then combined with the labeled training data, and seven regression algorithms were trained on this augmented dataset using
RESULTS
PET imaging Regression
As shown in Table 2, the best performance for the PET_HRF model was obtained using the SSL strategy with F-test for regression (FR) and the ABR algorithm, achieving an MAE of 1.04 years, compared to 1.20 years with the SL strategy. This represents a 14.8% improvement with SSL over SL (P < 0.05, paired t-test). Overall, Figure 2 (box plot) clearly demonstrates the performance differences between SSL and SL across models. Comprehensive regression results are provided in Supplementary Table 2, and the top ten features along with the best grid search parameters are provided in Supplementary Table 3. In summary, the SSL strategy significantly outperformed SL for the PET_HRF and CF models, whereas no improvement was observed for CT_DRF. The SHAP importance of features selected by FSAs is presented in Figure 3A and B: for the SL approach, the three most important features were “Strength from Neighbourhood Grey Tone Difference Matrix (NGTDM)”, “Small distance high grey level emphasis from Distance Zone Matrix (DZM)”, and “Coarseness from NGTDM”, whereas for SSL, the key features were “Geary’s C measure from morphology”, “Intensity at 10% volume from Intensity Volume Histogram (IVH)”, and “Angular second moment from Co-occurrence matrix (CM)”. For the DRF model, the best results were achieved with the SL strategy, where PET_DRF combined with ABR and FR yielded an MAE of 1.00 years, compared to 1.14 years with SSL. This indicates that SL performed better for DRF. For the CF model, using ABR and Pearson’s correlation coefficient regression (RR), the SSL strategy achieved an MAE of 1.04 years, while SL achieved 1.09 years, corresponding to a 4.9% improvement for SSL (P = 0.05, paired t-test). As shown in Figure 3C and D, the three most important features in SL were “smoking pack years”, “age at diagnosis”, and “stage at diagnosis”. In contrast, SSL identified “smoking pack years”, “age at diagnosis”, and “recurrence status” as key predictors.
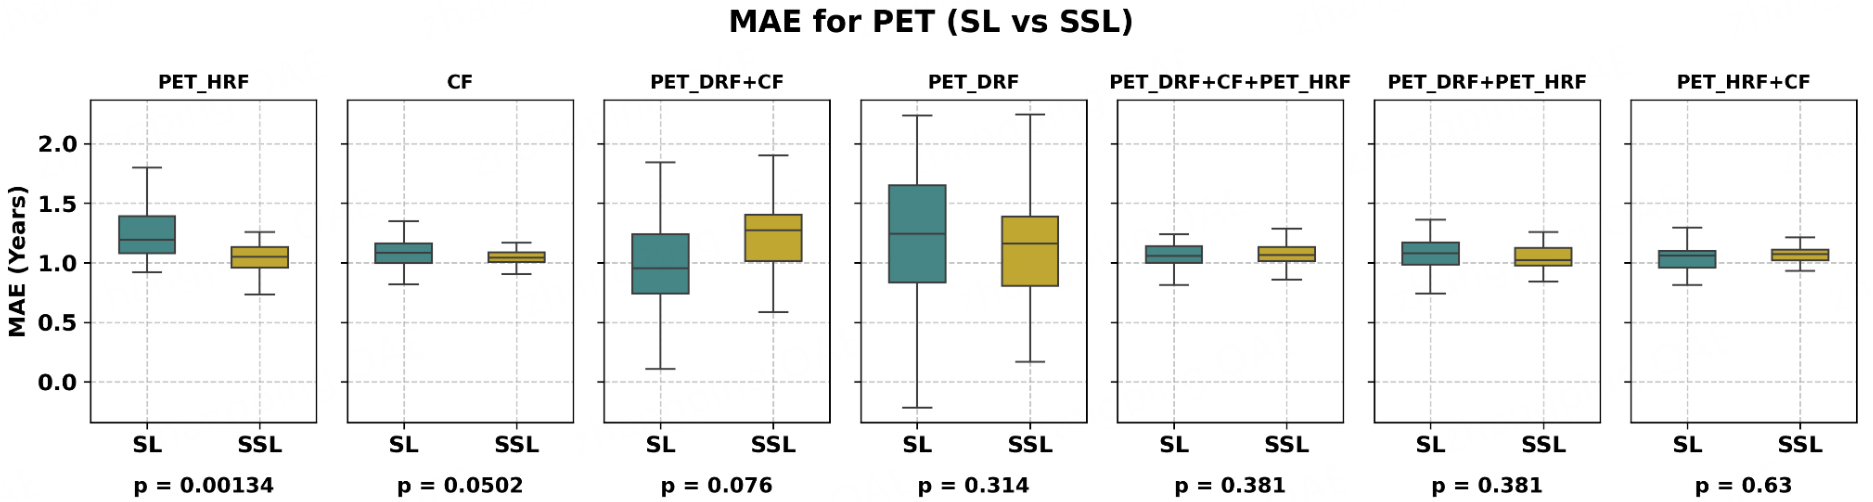
Figure 2. Box plot for PET and clinical data demonstrating comparison between SSL and SL; SSL significantly outperformed SL for PET_HRF and CF features, while improvements for PET_DRF were modest. PET_DRF: Deep radiomics features extracted from PET; PET_HRF: handcrafted radiomics features extracted from PET; CF: clinical features; SL: supervised learning; SSL: semi-supervised learning; MAE: mean absolute error; P: P-value; PET: positron emission tomography; HRF: handcrafted radiomics features.
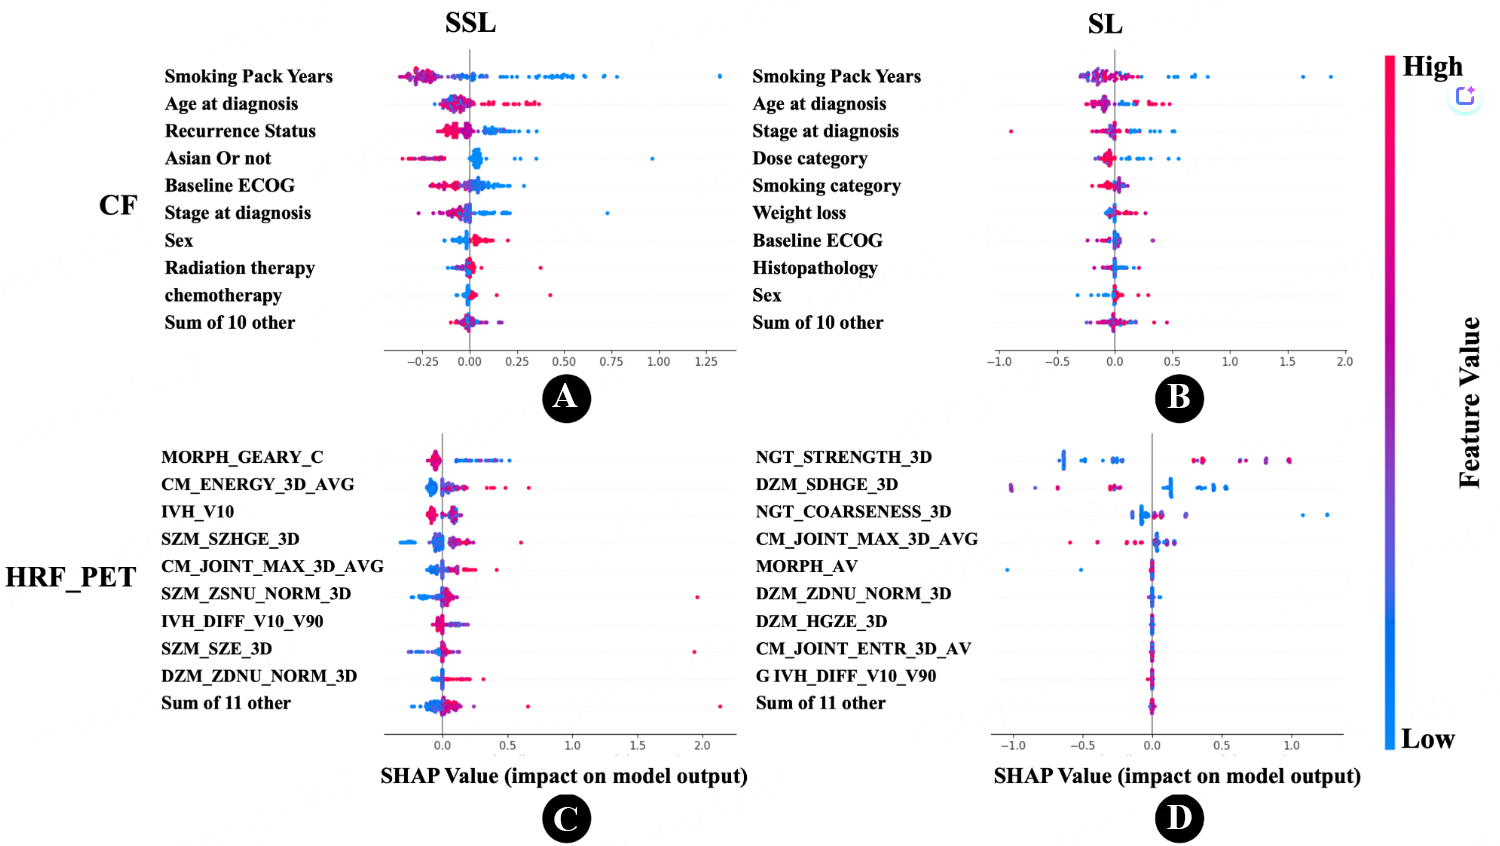
Figure 3. SHapley Additive exPlanations (SHAP) swarm plots illustrating feature importance and impact on model output. (A) Clinical Features (CF) in the Semi-Supervised Learning (SSL) approach. Each point represents an individual patient’s SHAP value for a feature, with color indicating the feature’s magnitude (red for high, blue for low); (B) Clinical Features (CF) in the Supervised Learning (SL) approach; (C) PET-based Radiomics Features (PET_HRF) in the SSL approach. This plot highlights the features derived from PET scans that contribute to the model’s predictions; (D) PET-based Radiomics Features (PET_HRF) in the SL approach. Comparing subfigures (C) and (D) with (A) and (B), respectively, the PET_HRF dataset exhibits a more pronounced distribution of SHAP values under the SSL approach, suggesting more distinct feature contributions when SSL is applied to radiomics data. The complete list of important HRFs, along with their definitions and categories, is provided in Supplementary Table 4. PET: Positron emission tomography; HRF: handcrafted radiomics features.
The best performances provided by semi-supervised (SSL) vs. supervised learning (SL) approaches
| Dataset | FSA | RA | PL C-index | Holdout SL MAE | Holdout SSL MAE | Gain | P-value |
| PET_HRF | FR | ABR | 0.63 | 1.20 ± 0.23 | 1.04 ± 0.15 | 14.81% | 0.001 |
| CF | RR | ABR | 0.56 | 1.09 ± 0.13 | 1.04 ± 0.08 | 4.94% | 0.050 |
| PET_DRF + CF+PET_HRF | RR | KNNR | 0.50 | 1.07 ± 0.14 | 1.05 ± 0.10 | 2.39% | 0.381 |
| PET_DRF + PET_HRF | RR | KNNR | 0.50 | 1.07 ± 0.13 | 1.05 ± 0.09 | 2.39% | 0.381 |
| PET_HRF + CF | FR | SVR | 0.63 | 1.06 ± 0.10 | 1.05 ± 0.06 | 0.91% | 0.630 |
| PET_DRF + CF | FR | RFR | 0.67 | 1.01 ± 0.43 | 1.16 ± 0.28 | - | - |
| PET_DRF | FR | ABR | 0.66 | 1.00 ± 0.67 | 1.14 ± 1.45 | - | - |
CT imaging regression
As shown in Table 3, for CT-derived imaging features, the best performance of CT_DRF was obtained using the SSL strategy, with an MAE of 1.02 years when CT_DRF was combined with FR and ABR. In comparison, the SL strategy with the same features yielded an MAE of 1.13 years, corresponding to a 10.47% improvement with SSL, which was borderline significant (P = 0.069, paired t-test). For CT_HRF combined with CFs, the SSL approach achieved an MAE of 1.02 years, compared to 1.10 years for SL, representing a 9.33% improvement, though not statistically significant (P = 0.093, paired t-test). Regarding feature importance, the SL model identified “smoking pack-years”, “smoking status”, and “Small distance low
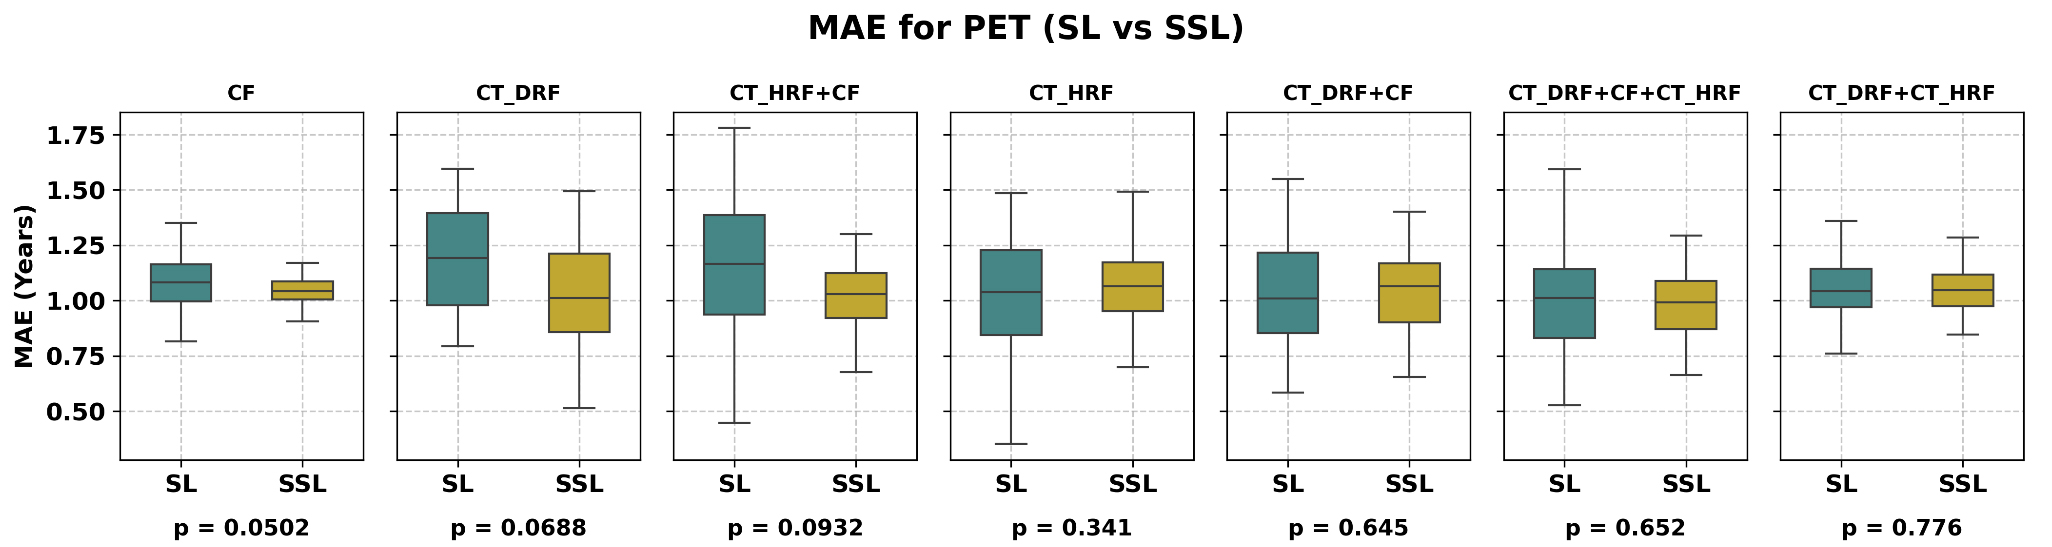
Figure 4. Box plot for CT and clinical data demonstrating comparison between SSL and SL; SSL significantly outperformed SL for CF, while improvements for CT_DRF and CT_HRF were modest. CT_DRF: Deep radiomics features extracted from CT; CT_HRF: handcrafted radiomics features extracted from CT; CF: clinical features; SL: supervised learning; SSL: semi-supervised learning; MAE: mean absolute error, P: P-value; DRFs: deep radiomics features; CT: computed tomography.
CT and clinical data SSL vs SL results
| Dataset | FSA | PL C-index | Algorithm | Holdout SL MAE | Holdout SSL MAE | Gain | P-value |
| CT_DRF | FR | 0.65 | ABR | 1.13 + 0.31 | 1.02 + 0.19 | 10.47% | 0.069 |
| CT_HRF + CF | FR | 0.64 | KNNR | 1.10 + 0.26 | 1.02 + 0.16 | 8.33% | 0.093 |
| CF | RR | 0.56 | ABR | 1.09 + 0.13 | 1.04 + 0.09 | 4.94% | 0.050 |
| CT_DRF + CF + CT_HRF | FR | 0.65 | ABR | 1.03 + 0.21 | 1.01 + 0.14 | 1.83% | 0.652 |
| CT_DRF + CT_HRF | RR | 0.50 | SVR | 1.05 + 0.17 | 1.06 + 0.11 | - | - |
| CT_DRF + CF | FR | 0.65 | ABR | 1.04 + 0.28 | 1.06 + 0.18 | - | - |
| CT_HRF | FR | 0.61 | ABR | 1.02 + 0.30 | 1.07 + 0.20 | - | - |
Results of HRSA
In our survival prediction models, unlike the regression approach, as shown in Table 4, CT-based models demonstrated superior predictive accuracy in external tests. Specifically, the CT_HRF model yielded a
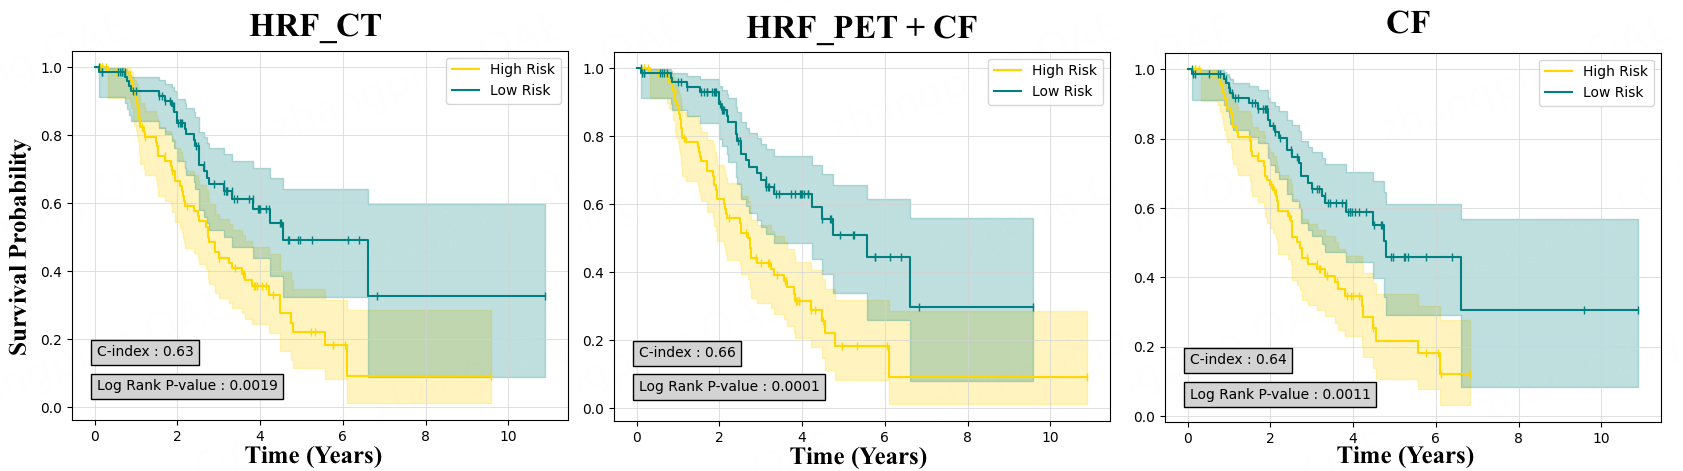
Figure 5. Kaplan-Meier survival curves generated for best performance in PET and CT and clinical data (CF). CT_HRF: Handcrafted radiomics features extracted from CT; PET_HRF: handcrafted radiomics features extracted from PET; PET: positron emission tomography; CT: computed tomography.
Survival analysis results
| Dataset | PCA+ HRSA | FFCV | External test | ||
| C-index ± STD | P-value | C-index | P-value | ||
| CT_HRF | CWGBSA | 0.63 ± 0.08 | 0.002 | 0.656 ± 0.02 | 0.019 |
| CT_HRF + CF | CWGBSA | 0.63 ± 0.08 | 0.002 | 0.653 ± 0.03 | 0.118 |
| CF | FSSVM | 0.64 ± 0.02 | 0.001 | 0.633 ± 0.02 | 0.449 |
| CT_DRF + CT_HRF | RSF | 0.66 ± 0.05 | < 0.05 | 0.632 ± 0.04 | 0.585 |
| PET_HRF + CF | FSSVM | 0.66 ± 0.07 | < 0.05 | 0.598 ± 0.02 | 0.060 |
| CT_DRF + CT_HRF +CF | CWGBSA | 0.66 ± 0.06 | 0.002 | 0.598 ± 0.05 | 0.632 |
| PET_DRF + PET_HRF | RSF | 0.63 ± 0.06 | 0.02 | 0.587 ± 0.03 | 0.207 |
| PET_HRF | RSF | 0.65 ± 0.06 | 0.002 | 0.573 ± 0.04 | 0.628 |
| PET_HRF + CF | RSF | 0.65 ± 0.06 | < 0.05 | 0.569 ± 0.02 | 0.107 |
| PET_DRF + PET_HRF +CF | RSF | 0.62 ± 0.09 | 0.173 | 0.56 ± 0.05 | 0.004 |
| CT_DRF + CF | RSF | 0.61 ± 0.02 | 0.025 | 0.556 ± 0.06 | 0.027 |
| CT_DRF | RSF | 0.61 ± 0.05 | 0.014 | 0.553 ± 0.03 | 0.075 |
| PET_DRF + CF | RSF | 0.58 ± 0.05 | 0.021 | 0.513 ± 0.02 | 0.371 |
DISCUSSION
In this study, we evaluated SSL and SL regression approaches to predict OS in lung cancer using HRF and DRF from PET and CT images, along with CF. SSL significantly improved prediction accuracy over SL for PET HRF and CF datasets, reducing MAE by up to 14.8% for PET_HRF and 4.95% for CF (P ≤ 0.05), while gains for CT-derived features were modest. Hazard ratio survival analysis highlighted CT HRF models as the most predictive (external C-index = 0.656, P = 0.019), with PET-based models showing moderate performance. Key predictors included smoking history, age, tumor stage, and radiomic texture features. Overall, these results demonstrate that integrating SSL with multi-modal data enhances OS prediction, underscoring the role of SSL approaches in survival time prediction.
The SSL strategy is gaining significant attention in cancer research, particularly for lung cancer prognosis, due to challenges in obtaining labeled datasets[14]. While many studies have applied SSL approaches to tasks such as PD-L1 scoring[14] or nodule detection[15,16], few have focused on using SSL for survival prediction. Chai et al. employed an SSL framework (Cox-AFT model) that combined Cox proportional hazards model (CoxPH) and AFT models to predict survival time using genomics data across various cancers, including lung cancer, achieving a 15% reduction in Mean Squared Error (MSE), which highlights the benefits of SSL for genomics data[17]. Hermoza et al. applied pseudo-labeling to predict survival time from pathology and
In the context of survival prediction, this study demonstrates that CT-based imaging models exhibit superior predictive accuracy compared to PET imaging and clinical data alone (P < 0.05, paired t-test). Among the CT-based models, the highest performance was achieved by the CT_HRF model, with a C-index of 0.656 ± 0.02 and a statistically significant P-value. For PET-based models, the best performance was observed with the PET_HRF+CF model, which attained a C-index of 0.598 ± 0.02 and a P-value of 0.06. PET imaging may be more effective in predicting exact survival times using censor-aware SSL approaches, potentially due to its ability to capture subtle metabolic variations that might align closely with time-to-event data[36]. Conversely, CT could perform better in survival prediction tasks, as its detailed structural features might provide patterns that advanced machine learning techniques are better suited to leverage for stratifying risk and predicting broader survival outcomes[37].
The advancement of personalized medicine in cancer management has underscored the unique advantages of PET and CT imaging. Several studies[38-41] have demonstrated that convolutional neural networks trained on pre-treatment PET/CT images can effectively predict lung malignancy progression and OS. Additionally, radiomic signatures derived from PET/CT images have been shown to predict disease-free survival in non-small cell lung cancer (NSCLC) patients. In a study by Kirienko et al., disease-free survival prediction using radiomic and CF revealed that CT performed slightly better than PET[42]. Other research[43] identified variables from CT and PET/CT as strong survival predictors, with Liu et al.[44] suggesting that CT radiomics may outperform PET in certain scenarios. In contrast, our analysis found that while PET imaging demonstrated no better baseline performance in the SL strategy, it achieved greater performance improvements when using the SSL strategy compared to CT, specifically using HRF. The greater improvement of OS prediction for PET compared with CT using SSL likely reflects three main factors. First, PET radiomics features capture metabolic activity, which is more directly linked to tumor aggressiveness and survival, whereas CT primarily provides anatomical information with a weaker prognostic signal. Second, the SSL approach leverages unlabeled or censored data, and this additional information is more informative for PET features, allowing pseudo-labeling to enhance predictive power. Finally, given the limited sample size, SSL disproportionately benefits the modality with stronger survival-related signals, amplifying the advantage of PET over CT in OS prediction.
Our study contributes to the field by integrating diverse feature types and employing both deep learning and traditional feature extraction methods. Recent research[45-48] highlights the potential of DRFs and tensor radiomics to enhance outcome prediction. However, in our study, DRFs achieved better performance for CT imaging. While DRFs offer the advantage of being automatically learned, which can reduce the human biases inherent in HRFs, they often involve managing a larger number of features. For small sample sizes, as in our study, this higher feature complexity can disadvantage DRFs and favor the more concise and interpretable HRFs[49,50]. This underscores the importance of considering dataset size and feature complexity when selecting predictive approaches for survival analysis[51]. It is also important to situate our prognostic radiomics approach within the broader landscape of non-invasive methods. For instance, recent advancements in breath-based diagnostics utilize deep learning to analyze volatile organic compound profiles for early-stage lung cancer detection[52,53]. While such screening methods are powerful for initial diagnosis, our post-diagnosis approach provides complementary information by characterizing tumor phenotypes from standard-of-care imaging to predict patient survival, addressing a different but crucial clinical need.
In the SL setting, the model relied mainly on texture features (such as strength and coarseness from NGTDM and emphasis from DZM), which reflect intratumoral heterogeneity. Such heterogeneity has been consistently associated with aggressive tumor behavior and poor prognosis in lung cancer, as it may capture variations in cell density, necrosis, and microvascular architecture[54,55]. HRFs are interpretable and standardized, as they are specifically designed to capture quantitative tumor descriptors such as texture, morphology, and intensity distributions. These features are often directly tied to well-understood biological processes, such as tumor heterogeneity, cell density, and vascular patterns, making them easier for clinicians to relate to clinical outcomes. In contrast, the SSL framework incorporated censored data, which shifted the model toward more global morphology and intensity features, such as Geary’s C measure from morphology, intensity at 10% volume from IVH, and angular second moment from CM. These features capture broader spatial and structural tumor patterns, such as irregular growth, volumetric distribution of uptake, and uniformity of intensity, which may correspond to underlying biological mechanisms such as tumor invasiveness, metabolic activity gradients, and stromal organization. DRFs, on the other hand, are often non-interpretable due to their high-dimensional and complex nature. These features, learned through deep learning models, capture intricate, non-linear patterns in the data but are typically abstract and not easily linked to specific biological mechanisms or tumor characteristics. While DRFs may improve model performance by extracting subtle patterns, their lack of transparency and explainability can hinder clinical adoption, as clinicians may find it difficult to trust the results or understand the biological relevance of these features.
This distinction suggests that SSL not only improves predictive accuracy but also highlights clinically meaningful descriptors of tumor biology that could inform patient risk stratification and treatment planning. While SL focused on features indicative of tumor heterogeneity, which are linked to aggressive tumor behavior, SSL enables the model to capture a more holistic view of tumor characteristics, improving its ability to assess tumor invasiveness and metabolic activity. The integration of both HRFs and DRFs in the SSL framework provides a comprehensive understanding of tumor biology, enhancing the model’s ability to support personalized treatment decisions and improve clinical outcomes.
Beyond the statistical improvements demonstrated, the clinical utility of our censor-aware SSL framework lies in its ability to significantly enhance patient stratification and treatment tailoring. By incorporating censored and unlabeled data, which are common in clinical practice, our framework provides a more accurate and realistic approach to survival predictions. This enables clinicians to identify high-risk patients who may benefit from intensified therapies, such as chemotherapy or radiation, while sparing low-risk patients from unnecessary treatments. This not only reduces the risk of over-treatment but also improves quality of life by minimizing exposure to potentially harmful interventions. The model’s ability to perform robust risk stratification also supports personalized treatment planning, ensuring that therapies are optimized based on each patient’s unique risk profile.
Additionally, the integration of HRFs, DRFs, and CFs enables a more comprehensive evaluation of patient prognosis. This approach helps clinicians tailor treatment plans to individual patients, enhancing both treatment effectiveness and patient outcomes. A key advantage of our framework is its interpretability, achieved through the use of SHAP. SHAP provides insights into how specific features contribute to survival predictions, fostering trust in the model and facilitating shared decision making between clinicians and patients. By incorporating censored and unlabeled data, our framework not only optimizes resource allocation but also provides data-driven insights that enhance clinical decision making, ultimately improving the precision and efficacy of lung cancer care.
Our study has several limitations that offer opportunities for future research. First, the datasets were limited to specific cancer types (lung cancer) and imaging modalities (CT and PET), restricting generalizability. Validation with diverse datasets, including head and neck, liver, and prostate cancers, is needed to enhance robustness. Nevertheless, when extracting the independent holdout test set, the number of uncensored cases became much lower than the censored cases. While the overall dataset remained balanced, this shift in the test split is not ideal for pseudo-labeling-based training, as it may reduce the stability of survival predictions. The SSL approach relied on pseudo-labeling, which may introduce noise, emphasizing the importance of high-quality pseudo-labels. The limited interpretability of DRFs remains a challenge, as their biological underpinnings are less transparent compared to handcrafted features, which may constrain clinical trust and adoption. Furthermore, the dataset size is relatively modest, which may restrict the robustness of the findings. Although we performed internal validation, the absence of extensive external validation limits the generalizability of our results. Future studies should assess the reproducibility of this approach in larger, independent cohorts across multiple institutions and diverse patient populations. Additionally, incorporating data from different geographic regions, cancer subtypes, and imaging modalities will help evaluate the model’s scalability and performance across varied clinical contexts. Such efforts will be critical in confirming the real-world applicability of the framework and ensuring its clinical utility in diverse healthcare settings. In survival prediction, SSL was not feasible due to its dependency on the last follow-up date, limiting broader applicability. Manual tumor segmentation required expert input, highlighting the potential for automated deep learning-based segmentation. Moreover, the study employed a limited range of RAs and HRSAs; exploring more algorithms could improve predictive accuracy. Future work should focus on diverse datasets with complete follow-up information, additional imaging modalities, and advanced techniques, such as explainable machine learning models, to address these limitations and further advance the field.
CONCLUSION
This study demonstrates the significant advantages of integrating censor-aware SSL for survival time prediction in lung cancer, showing a 14.81% improvement in MAE with the PET_HRF model compared to SL approaches. By combining multi-modality radiomics features (HRFs and DRFs) with CFs, our SSL framework offers a scalable and robust approach for survival prediction, leveraging both labeled and unlabeled data. Clinically, the framework enhances patient stratification, enabling personalized treatment decisions and guiding therapy selection. This integration of radiomics and CFs is a valuable tool for precision oncology, improving predictive accuracy and bridging the gap between research and practice. The approach has broad implications for data-driven, individualized care, offering potential for future advancements in AI-based survival prediction to improve patient outcomes across various malignancies.
DECLARATIONS
Acknowledgments
This study was supported by the Virtual Collaboration Group (VirCollab, www.vircollab.com) and the Technological Virtual Collaboration (TECVICO CORP.) based in Vancouver, Canada.
Authors’ contributions
Conceptualization, supervision, project administration: Salmanpour MR
Methodology, writing - original draft: Salmanpour MR, Groji A, Sanati N, Jouzdani AF
Software: Salmanpour MR, Groji A, Sanati N
Validation, funding acquisition, writing - review and editing: Salmanpour MR, Yuan R, Rahmim A
Formal analysis: Salmanpour MR, Groji A
Investigation: Salmanpour MR, Groji A, Sanati N, Jouzdani AF, Rahmim A
Resources: Salmanpour MR, Rahmim A
Data curation: Groji A, Jouzdani AF, Sanati N, Yuan R
Visualization: Salmanpour MR, Jouzdani AF, Sanati N, Rahmim A, Yuan R
Availability of data and materials
All code (including prediction and dimension reduction algorithms) is publicly shared at: https://github.com/MohammadRSalmanpour/Several-Novel-Machine-Learning-Strategies-for-Lung-Cancer-Survival-Outcome-Prediction.
Financial support and sponsorship
This study was supported by the UBC Department of Radiology 2023 AI Fund, and the Natural Sciences and Engineering Research Council of Canada (NSERC) Discovery Horizons Grant (DH-2025-00119).
Conflicts of interest
Salmanpour MR is affiliated with TECVICO Corp. The remaining authors declared that there are no conflicts of interest.
Ethical approval and consent to participate
This study was approved by the University of British Columbia - BC Cancer Research Ethics Board (Department of Integrative Oncology, BC Cancer Research Institute, Vancouver, BC, Canada; Approval number: H19-02805; Approval date: 2019-10-23). The BC Cancer database was accessed starting from 2020-09-01. The requirement for individual informed consent was waived due to the retrospective nature of the study and the use of anonymized data. Other public datasets were obtained from TCIA (https://www.cancerimagingarchive.net/collection/tcga-lusc/).
Consent for publication
Not applicable.
Copyright
© The Author(s) 2025.
Supplementary Materials
REFERENCES
1. Siegel RL, Miller KD, Wagle NS, Jemal A. Cancer statistics, 2023. CA Cancer J Clin. 2023;73:17-48.
2. Sharma R. Mapping of global, regional and national incidence, mortality and mortality-to-incidence ratio of lung cancer in 2020 and 2050. Int J Clin Oncol. 2022;27:665-75.
3. Jouzdani AF, Abootorabi A, Rajabi M, et al. Impact of clinical features combined with PET/CT imaging features on survival prediction of outcome in lung cancer. J Nucl Med. 2024;65:242130. Available from: https://jnm.snmjournals.org/content/65/supplement_2/242130 [Last accessed on 21 October 2025].
4. Salmanpour MR, Jouzdani AF, Gorji A, et al. Semi-supervised vs. supervised machine learning approaches for improved overall survival prediction: application to lung cancer PET/CT images. J Nucl Med. 2024;65:242097. Available from: https://jnm.snmjournals.org/content/65/supplement_2/242097.abstract [Last accessed on 21 October 2025].
5. Gorji A, Hosseinzadeh M, Jouzdani A F, et al. Region-of-interest and handcrafted vs. deep radiomics feature comparisons for survival outcome prediction: application to lung PET/CT imaging. In: 2023 IEEE Nuclear Science Symposium, Medical Imaging Conference and International Symposium on Room-Temperature Semiconductor Detectors (NSS MIC RTSD); 2023 Nov 4-11; Vancouver, BC, Canada, IEEE; 2023, pp. 1-2.
6. Gorji A, Jouzdani AF, Sanati N, et al. PET-CT fusion based outcome prediction in lung cancer using deep and handcrafted radiomics features and machine learning. J Nucl Med. 2023;64:P1196. Available from: https://jnm.snmjournals.org/content/64/supplement_1/P1196 [Last accessed on 21 October 2025].
7. Dixon D, Sattar H, Moros N, et al. Unveiling the Influence of AI predictive analytics on patient outcomes: a comprehensive narrative review. Cureus. 2024;16:e59954.
8. Salmanpour MR, Gorji A, Mousavi A, et al. Enhanced lung cancer survival prediction using semi-supervised pseudo-labeling and learning from diverse PET/CT datasets. Cancers. 2025;17:285.
9. Zheng S, Guo J, Langendijk JA, et al. Survival prediction for stage I-IIIA non-small cell lung cancer using deep learning. Radiother Oncol. 2023;180:109483.
10. Atlam M, Torkey H, El-Fishawy N, Salem H. Coronavirus disease 2019 (COVID-19): survival analysis using deep learning and Cox regression model. Pattern Anal Appl. 2021;24:993-1005.
11. Guo S, Zeng D. An overview of semiparametric models in survival analysis. J Stat Plan Inference. 2014;151-152:1-16.
12. Schober P, Vetter TR. Survival analysis and interpretation of time-to-event data: the tortoise and the hare. Anesth Analg. 2018;127:792-8.
13. George B, Seals S, Aban I. Survival analysis and regression models. J Nucl Cardiol. 2014;21:686-94.
14. Kapil A, Meier A, Zuraw A, et al. Deep semi supervised generative learning for automated tumor proportion scoring on NSCLC tissue needle biopsies. Sci Rep. 2018;8:17343.
15. Xie Y, Zhang J, Xia Y. Semi-supervised adversarial model for benign-malignant lung nodule classification on chest CT. Med Image Anal. 2019;57:237-48.
16. Shi F, Chen B, Cao Q, et al. Semi-supervised deep transfer learning for benign-malignant diagnosis of pulmonary nodules in chest CT images. IEEE Trans Med Imaging. 2022;41:771-81.
17. Chai H, Li ZN, Meng DY, Xia LY, Liang Y. A new semi-supervised learning model combined with Cox and SP-AFT models in cancer survival analysis. Sci Rep. 2017;7:13053.
18. Hermoza R, Maicas G, Nascimento JC, et al. Censor-aware semi-supervised learning for survival time prediction from medical images. arXiv 2022;arXiv:2205.13226.
19. Haredasht F, Vens C. Predicting survival outcomes in the presence of unlabeled data. Mach Learn. 2022;111:4139-57.
20. Bakr S, Gevaert O, Echegaray S, et al. A radiogenomic dataset of non-small cell lung cancer. Sci Data. 2018;5:180202.
21. Lucignani G, Paganelli G, Bombardieri E. The use of standardized uptake values for assessing FDG uptake with PET in oncology: a clinical perspective. Nucl Med Commun. 2004;25:651-6.
22. Brahim A, Górriz J, Ramírez J, Khedher L. Intensity normalization of DaTSCAN SPECT imaging using a model-based clustering approach. Appl Soft Comput. 2015;37:234-44.
23. Salmanpour MR, Shiri I, Hosseinzadeh M, et al. ViSERA: visualized & standardized environment for radiomics analysis-a shareable, executable, and reproducible workflow generator. In: 2023 IEEE Nuclear Science Symposium, Medical Imaging Conference and International Symposium on Room-Temperature Semiconductor Detectors (NSS MIC RTSD); 2023 Nov 4-11; Vancouver, BC, Canada, IEEE; 2023: pp. 1-2.
24. Freund Y, Schapire RE. A decision-theoretic generalization of on-line learning and an application to boosting. J Comput Syst Sci. 1997;55:119-39.
25. Ho TK. Random decision forests. In: Proceedings of 3rd international conference on document analysis and recognition; 1995 Aug 14-16; Montreal, QC, Canada, IEEE; 1995, pp. 278-82.
26. Srisuradetchai P, Suksrikran K. Random kernel k-nearest neighbors regression. Front Big Data. 2024;7:1402384.
27. Ahmed AM, Rizaner A, Ulusoy AH. A decision tree algorithm combined with linear regression for data classification. In: 2018 International Conference on Computer, Control, Electrical, and Electronics Engineering (ICCCEEE); 2018 Aug 12-14; Khartoum, Sudan, IEEE; 2018, pp. 1-5.
28. Stanton JM. Galton, Pearson, and the peas: a brief history of linear regression for statistics instructors. J Stat Educ. 2001;9:1-13.
29. Cybenko G. Approximation by superpositions of a sigmoidal function. Math Control Signal Systems. 1989;2:303-14.
31. Pölsterl S. scikit-survival: A library for time-to-event analysis built on top of scikit-learn. J Mach Learn Res 2020;21:1-6. Available from: https://www.jmlr.org/papers/volume21/20-729/20-729.pdf?utm_source [Last accessed on 21 October 2025].
32. Pölsterl S. Gradient boosted models. 2020. Available from: https://scikit-survival.readthedocs.io/en/stable/user_guide/boosting.html [Last accessed on 21 October 2025].
33. Pölsterl S. Using random survival forests. 2020. Available from: https://scikit-survival.readthedocs.io/en/stable/user_guide/random-survival-forest.html [Last accessed on 21 October 2025].
34. Goel MK, Khanna P, Kishore J. Understanding survival analysis: Kaplan-Meier estimate. Int J Ayurveda Res. 2010;1:274-8.
35. Cui L, Li H, Hui W, et al. A deep learning-based framework for lung cancer survival analysis with biomarker interpretation. BMC Bioinformatics. 2020;21:112.
36. Kurtipek E, Çayci M, Düzgün N, et al.
37. Fried DV, Tucker SL, Zhou S, et al. Prognostic value and reproducibility of pretreatment CT texture features in stage III non-small cell lung cancer. Int J Radiat Oncol Biol Phys. 2014;90:834-42.
38. Huang B, Sollee J, Luo YH, et al. Prediction of lung malignancy progression and survival with machine learning based on pre-treatment FDG-PET/CT. EBioMedicine. 2022;82:104127.
39. Yuan L, An L, Zhu Y, et al. Machine learning in diagnosis and prognosis of lung cancer by PET-CT. Cancer Manag Res. 2024;16:361-75.
40. Nakajo M, Jinguji M, Ito S, Tani A, Hirahara M, Yoshiura T. Clinical application of 18F-fluorodeoxyglucose positron emission tomography/computed tomography radiomics-based machine learning analyses in the field of oncology. Jpn J Radiol. 2024;42:28-55.
41. Ahn HK, Lee H, Kim SG, Hyun SH. Pre-treatment 18F-FDG PET-based radiomics predict survival in resected non-small cell lung cancer. Clin Radiol. 2019;74:467-73.
42. Kirienko M, Cozzi L, Antunovic L, et al. Prediction of disease-free survival by the PET/CT radiomic signature in non-small cell lung cancer patients undergoing surgery. Eur J Nucl Med Mol Imaging. 2018;45:207-17.
43. Lee HY, Lee SW, Lee KS, et al. Role of CT and PET imaging in predicting tumor recurrence and survival in patients with lung adenocarcinoma: a comparison with the international association for the study of Lung Cancer/American Thoracic Society/European Respiratory Society Classification of lung adenocarcinoma. J Thorac Oncol. 2015;10:1785-94.
44. Liu H, Lao M, Zhang Y, Chang C, Yin Y, Wang R. Radiomics-based machine learning models for differentiating pathological subtypes in cervical cancer: a multicenter study. Front Oncol. 2024;14:1346336.
45. Hosseinzadeh M, Gorji A, Jouzdani AF, Rezaeijo SM, Rahmim A, Salmanpour MR. Prediction of cognitive decline in Parkinson’s disease using clinical and DAT SPECT imaging features, and hybrid machine learning systems. Diagnostics. 2023;13:1691.
46. Salmanpour MR, Rezaeijo SM, Hosseinzadeh M, Rahmim A. Deep versus handcrafted tensor radiomics features: prediction of survival in head and neck cancer using machine learning and fusion techniques. Diagnostics. 2023;13:1696.
47. Salmanpour MR, Hosseinzadeh M, Sanati N, et al. Tensor deep versus radiomics features: lung cancer outcome prediction using hybrid machine learning systems. J Nucl Med. 2023;64 (supplement 1):1174. Available from: https://jnm.snmjournals.org/content/64/supplement_1/P1174.abstract [Last accessed on 27 October 2025].
48. Le VH, Minh TNT, Kha QH, Le NQK. A transfer learning approach on MRI-based radiomics signature for overall survival prediction of low-grade and high-grade gliomas. Med Biol Eng Comput. 2023;61:2699-712.
49. Hosny A, Aerts HJ, Mak RH. Handcrafted versus deep learning radiomics for prediction of cancer therapy response. Lancet Digit Health. 2019;1:e106-7.
50. Wu G, Jochems A, Refaee T, et al. Structural and functional radiomics for lung cancer. Eur J Nucl Med Mol Imaging. 2021;48:3961-74.
51. Le NQK. Hematoma expansion prediction: still navigating the intersection of deep learning and radiomics. Eur Radiol. 2024;34:2905-7.
52. Lee B, Lee J, Lee J, et al. Breath analysis system with convolutional neural network (CNN) for early detection of lung cancer. Sens Actuators B Chem. 2024;409:135578.
53. Mazzone PJ, Hammel J, Dweik R, et al. Diagnosis of lung cancer by the analysis of exhaled breath with a colorimetric sensor array. Thorax. 2007;62:565-8.
54. Wu HJ, Temko D, Maliga Z, et al. Spatial intra-tumor heterogeneity is associated with survival of lung adenocarcinoma patients. Cell Genom. 2022;2:100165.
Cite This Article
How to Cite
Download Citation
Export Citation File:
Type of Import
Tips on Downloading Citation
Citation Manager File Format
Type of Import
Direct Import: When the Direct Import option is selected (the default state), a dialogue box will give you the option to Save or Open the downloaded citation data. Choosing Open will either launch your citation manager or give you a choice of applications with which to use the metadata. The Save option saves the file locally for later use.
Indirect Import: When the Indirect Import option is selected, the metadata is displayed and may be copied and pasted as needed.
About This Article
Special Topic
Copyright

Data & Comments
Data
0


Comments
Comments must be written in English. Spam, offensive content, impersonation, and private information will not be permitted. If any comment is reported and identified as inappropriate content by OAE staff, the comment will be removed without notice. If you have any queries or need any help, please contact us at [email protected].