fig3
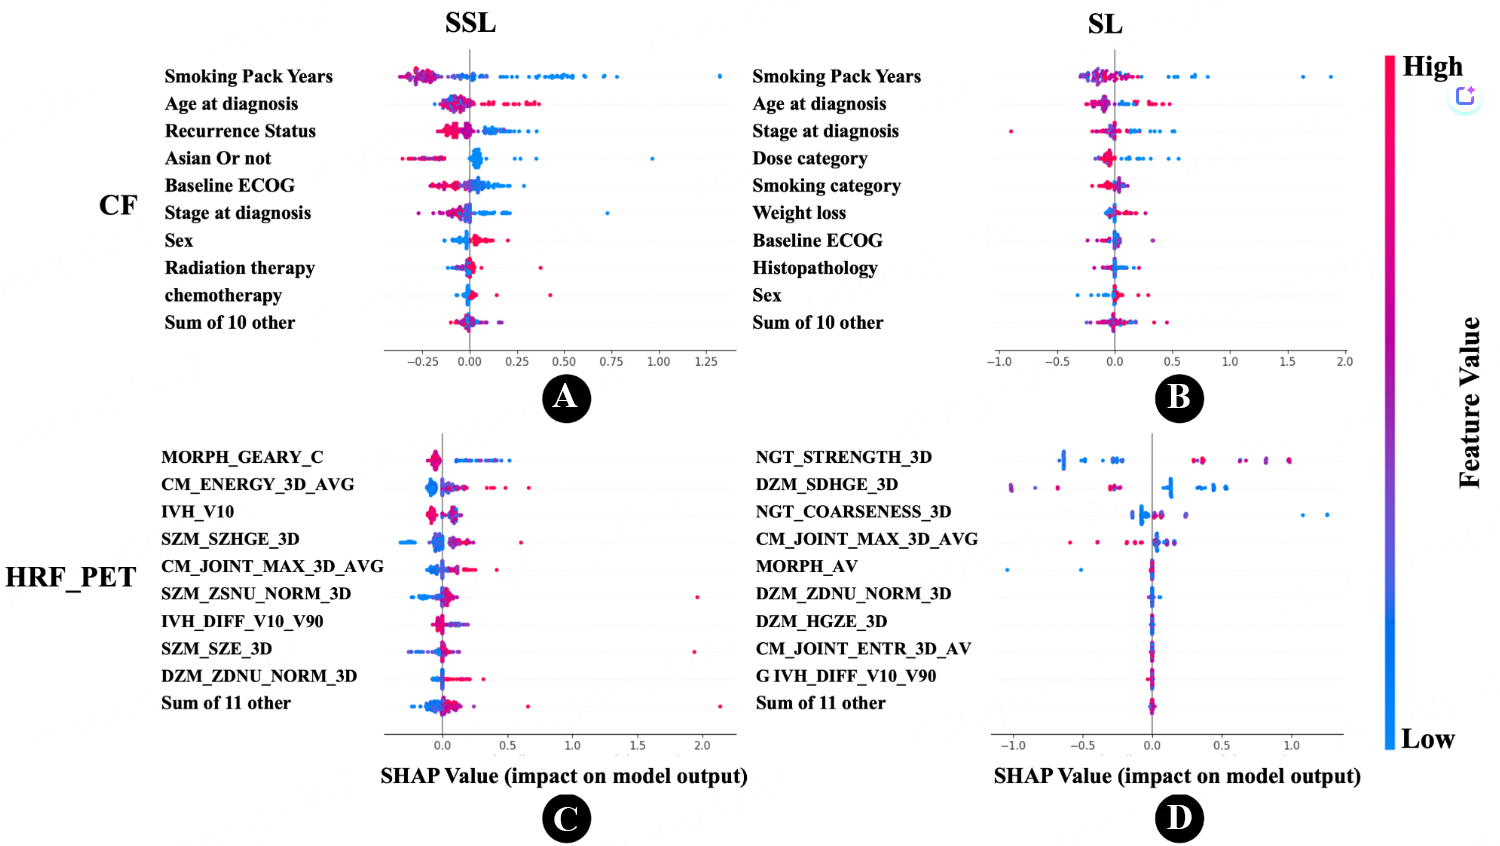
Figure 3. SHapley Additive exPlanations (SHAP) swarm plots illustrating feature importance and impact on model output. (A) Clinical Features (CF) in the Semi-Supervised Learning (SSL) approach. Each point represents an individual patient’s SHAP value for a feature, with color indicating the feature’s magnitude (red for high, blue for low); (B) Clinical Features (CF) in the Supervised Learning (SL) approach; (C) PET-based Radiomics Features (PET_HRF) in the SSL approach. This plot highlights the features derived from PET scans that contribute to the model’s predictions; (D) PET-based Radiomics Features (PET_HRF) in the SL approach. Comparing subfigures (C) and (D) with (A) and (B), respectively, the PET_HRF dataset exhibits a more pronounced distribution of SHAP values under the SSL approach, suggesting more distinct feature contributions when SSL is applied to radiomics data. The complete list of important HRFs, along with their definitions and categories, is provided in Supplementary Table 4. PET: Positron emission tomography; HRF: handcrafted radiomics features.


