


Validation of EASO criteria and development of a new diagnostic tool for visceral obesity in Chinese adults
 0
0 Abstract
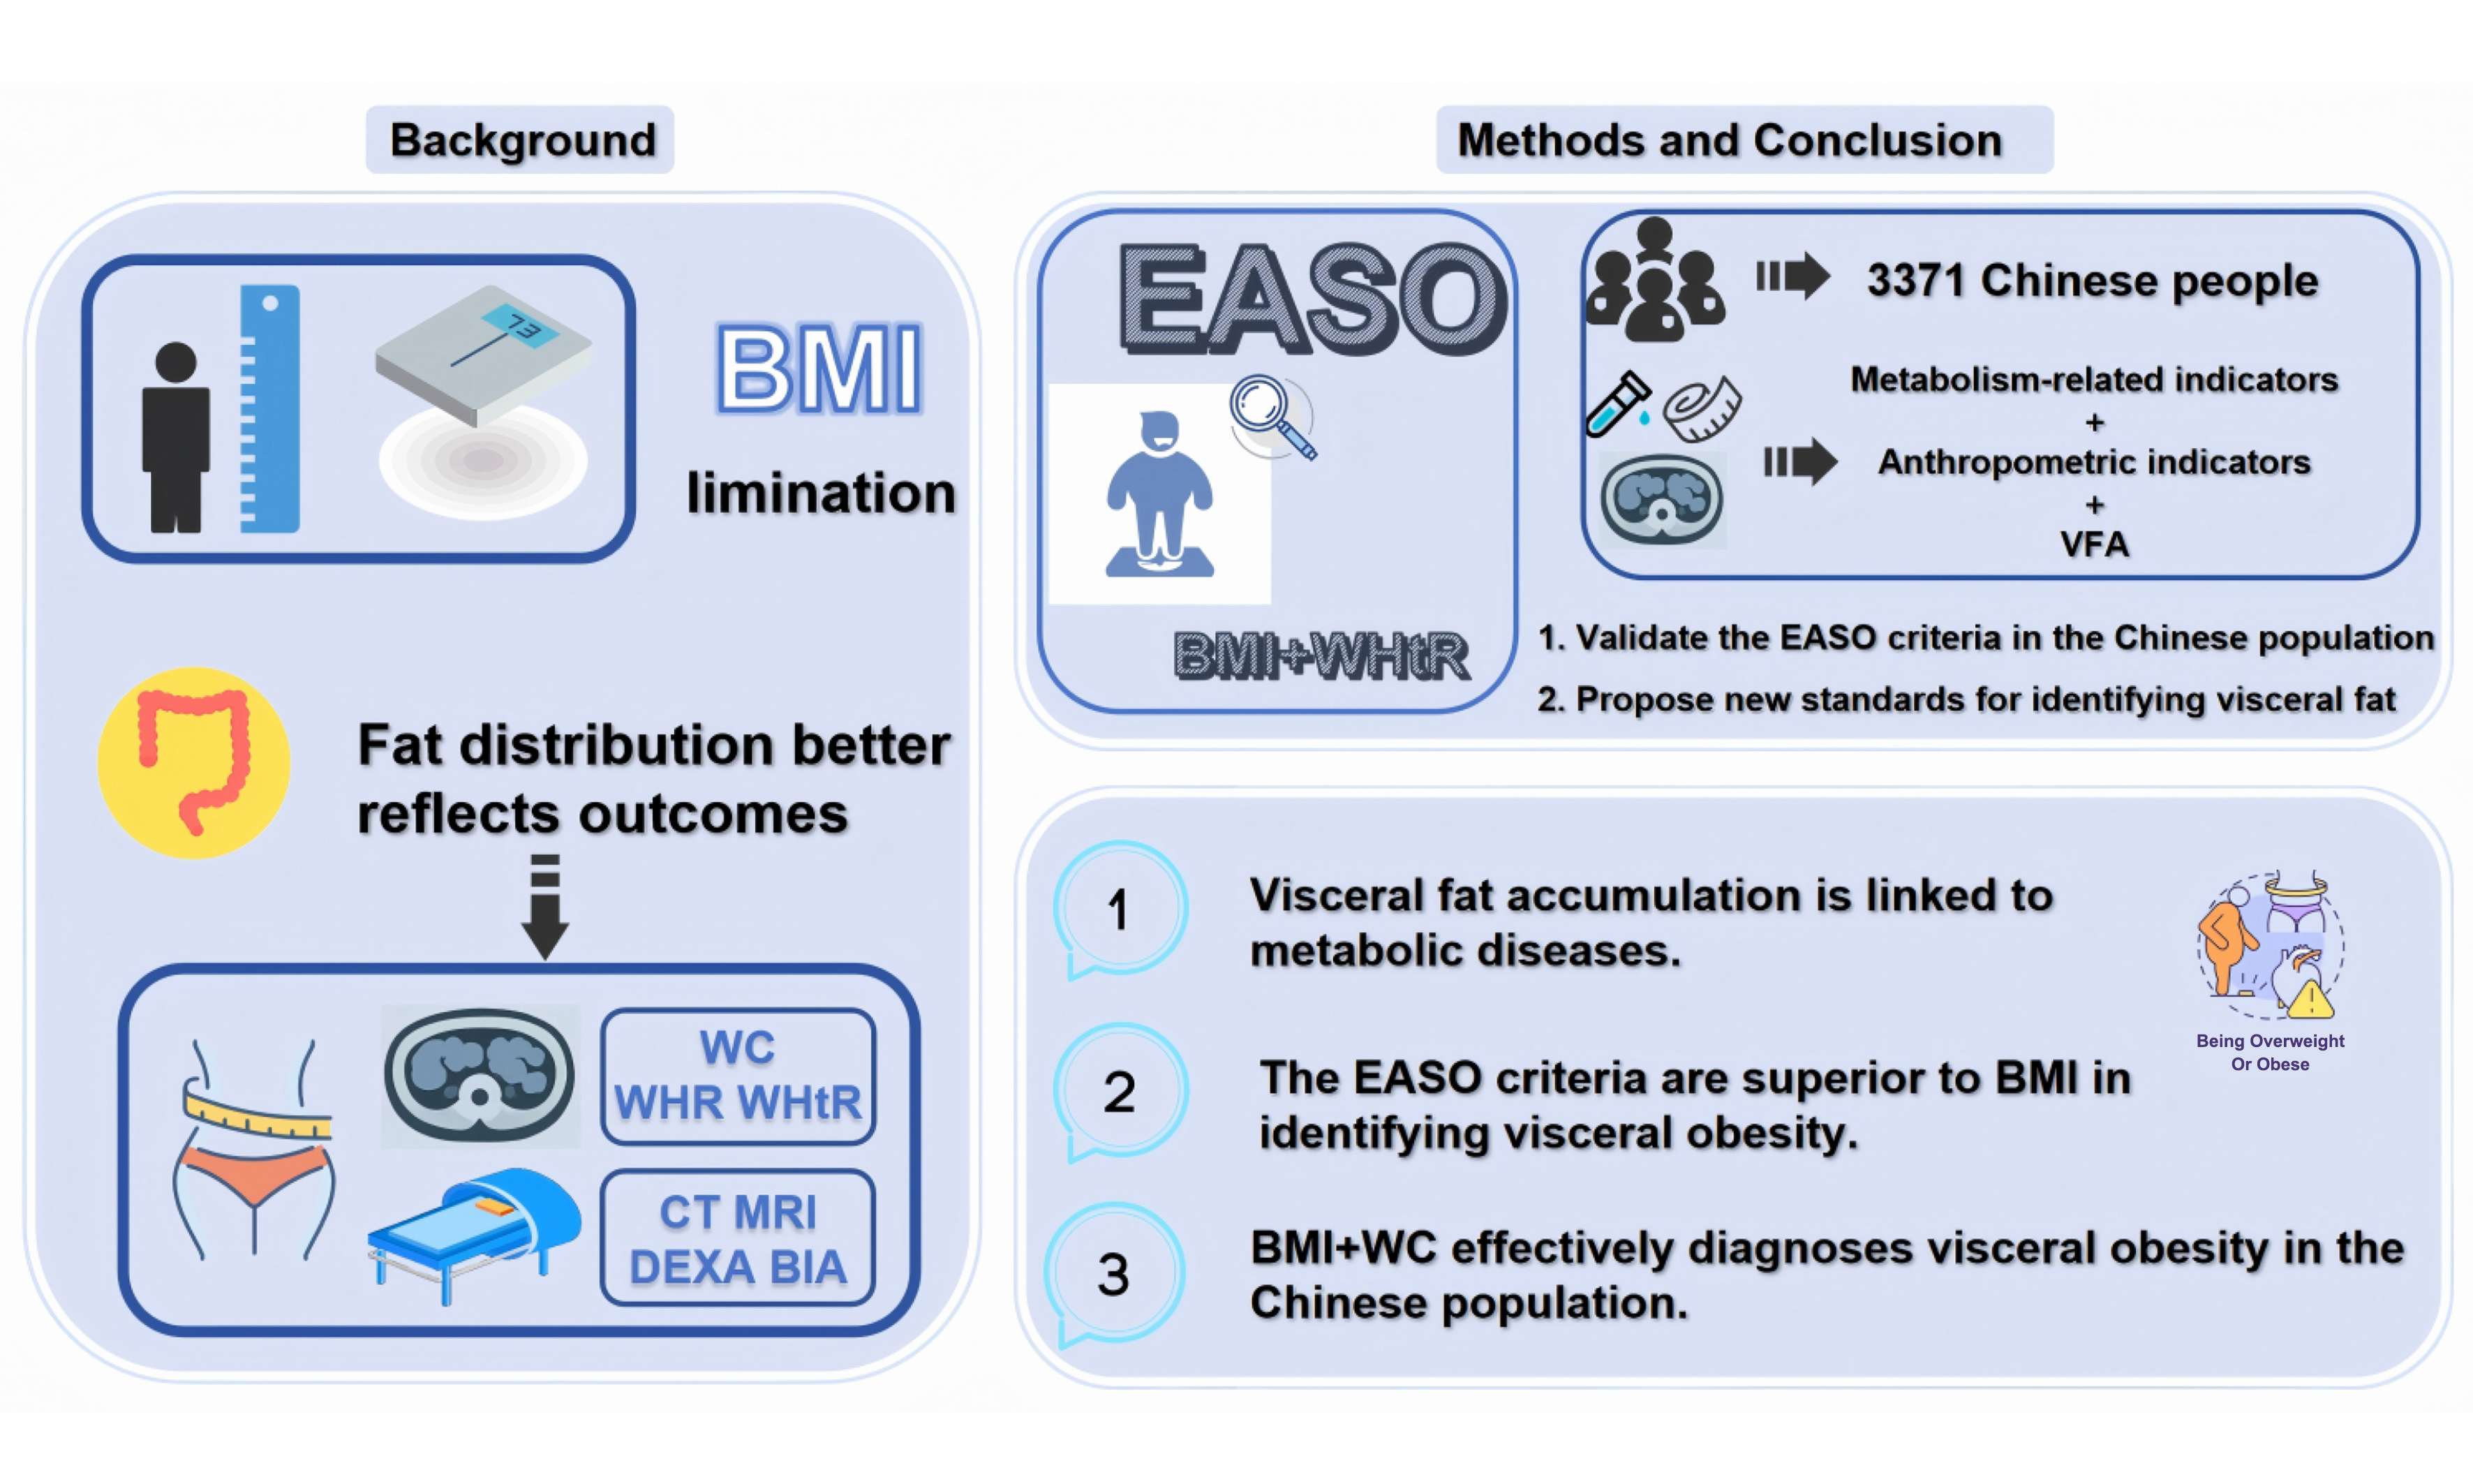
Aim: This study aimed to explore the relationship between visceral fat and obesity-related metabolic diseases, validate the obesity criteria from the European Association for the Study of Obesity (EASO) in the Chinese population, and propose new standards for identifying visceral fat using simple anthropometric indicators.
Methods: This cross-sectional study involved 3,371 participants aged 26-76 years in Pinggu District, Beijing. Anthropometric measurements and metabolic indicators were assessed, and visceral fat area (VFA) was calculated from non-contrast abdominal computed tomography scans. The McNemar test was used to compare the diagnostic accuracy of the EASO criteria and body mass index (BMI) for identifying visceral obesity. The correlation between anthropometric indicators and VFA was analysed using Spearman’s correlation coefficient. Receiver operating characteristic curves were used to compare the diagnostic efficacy and thresholds of anthropometric indicators with the EASO criteria.
Results: Among 3,371 participants, 61.2% were diagnosed with visceral obesity. Metabolic disease prevalence was higher in individuals with visceral obesity, suggesting that visceral fat accumulation is a sensitive marker for identifying metabolic diseases. The EASO criteria showed higher sensitivity and lower specificity than BMI alone for diagnosing visceral obesity. Waist circumference (WC) and waist-to-height ratio correlated strongly with VFA. BMI combined with WC was the most effective tool for diagnosing visceral obesity in the Chinese population.
Conclusion: Visceral fat accumulation is associated with metabolic diseases, and the EASO criteria are superior to BMI in identifying visceral obesity. BMI combined with WC is effective for diagnosing visceral obesity in the Chinese population.
Keywords
INTRODUCTION
Obesity, a chronic complex disease, is characterised by the abnormal and/or excessive accumulation of body fat. Traditionally, the diagnosis of obesity mainly relies on the body mass index (BMI). However, BMI, as a single indicator, has notable limitations: it cannot reliably distinguish between muscle and fat tissue, nor does it consider the specific fat distribution within the body, and thus provides inadequate information about health risks for the individual[1]. The distribution of body fat plays a crucial role in health outcomes, with fat accumulation being a more significant risk factor for metabolic disorders than obesity itself[2]. Compared to subcutaneous fat, visceral fat exhibits higher metabolic activity, which can trigger lipolysis and release substantial amounts of free fatty acids (FFAs) into the portal vein. This process leads to increased production of very-low-density lipoprotein and triglycerides (TGs) in the liver, disrupts lipid metabolism, and contributes to the development of insulin resistance[3]. The accumulation of abdominal visceral fat is associated with an elevated risk of obesity-related metabolic diseases, including type 2 diabetes mellitus (T2DM), hypertension (HTN), and coronary heart disease (CHD)[4,5]. Additionally, visceral fat releases proinflammatory cytokines, such as tumour necrosis factor-α and interleukin-6, which contribute to a chronic inflammatory state closely linked to atherosclerosis, cardiovascular diseases, tumour progression, and immune dysfunction, significantly affecting patient prognosis[6].
The quantification of abdominal fat, especially visceral fat, is essential for the diagnosis and management of obesity. Several techniques are available for evaluating visceral fat content, including bioelectrical impedance analysis, dual-energy X-ray absorptiometry (DEXA), computed tomography (CT), and magnetic resonance imaging (MRI)[7,8]. Among these, CT and MRI are considered the “gold standard” for quantifying abdominal visceral fat. However, the high costs and potential risks associated with radiation exposure limit their widespread use in clinical settings. Recently, the European Association for the Study of Obesity (EASO) introduced a novel framework for diagnosing obesity. According to this framework, European adults with a BMI of ≥ 25 kg/m2, a waist-to-height ratio (WHtR) of ≥ 0.5, and the presence of any medical, functional, or psychological impairments or complications or those with a BMI of ≥ 30 kg/m2 may be diagnosed with obesity[9]. The new standard incorporates WHtR as a predictive measure of abdominal fat accumulation and the risk of cardiometabolic diseases[10,11], placing greater emphasis on fat distribution. The Lancet Diabetes & Endocrinology has proposed a new definition for obesity, emphasising not only anthropometric or direct body fat measurement but also associated functional impairments at the tissue or organ level. Their framework classifies obesity into clinical and preclinical forms and endorses the use of indicators such as WC, waist-hip ratio (WHR), and WHtR in assessing obesity risk beyond BMI alone[12].
Currently, limited data exist regarding the application and validation of these new obesity criteria in the Chinese population. Further evaluation is needed regarding the use of simple anthropometric measures as alternatives to visceral fat measurement. Given this background, our study aimed to explore the relationship between visceral obesity and obesity-related metabolic diseases, assess the applicability of the new obesity diagnostic criteria proposed by the EASO in the Chinese population, and develop a new standard for identifying visceral fat accumulation in the Chinese population based on simple anthropometric measurements.
METHODS
Study design and patient population
This cross-sectional study was conducted in the Pinggu District, Beijing, China. We employed a two-stage cluster sampling method to recruit participants aged 25 to 74 years from 25 villages across five towns and seven residents’ committees within one street of Pinggu District, Beijing, between March 2012 and May 2013. A total of 5,004 residents were invited, and 3,350 individuals participated in the initial survey. In the second round, conducted between September 2013 and July 2014, all 5,004 originally selected residents were reinvited, and an additional 1,579 residents were newly invited, resulting in a total of 6,583 invited participants. Ultimately, 4,002 individuals aged 25 to 74 years were enrolled and included in the present analysis. Detailed information about study enrolment and procedures for the Pinggu Metabolic Disease Study can be found elsewhere[13]. A total of 4,002 individuals aged 26-76 years participated in the study. Participants without anthropometric or metabolic data (n = 631) were excluded. Ultimately, 3,371 participants were included in the final analysis. The details of the study design are shown in Figure 1. This study protocol was reviewed and approved by the Ethics Committee of the Peking University Health Science Center, approval number 2025PHB226-001.
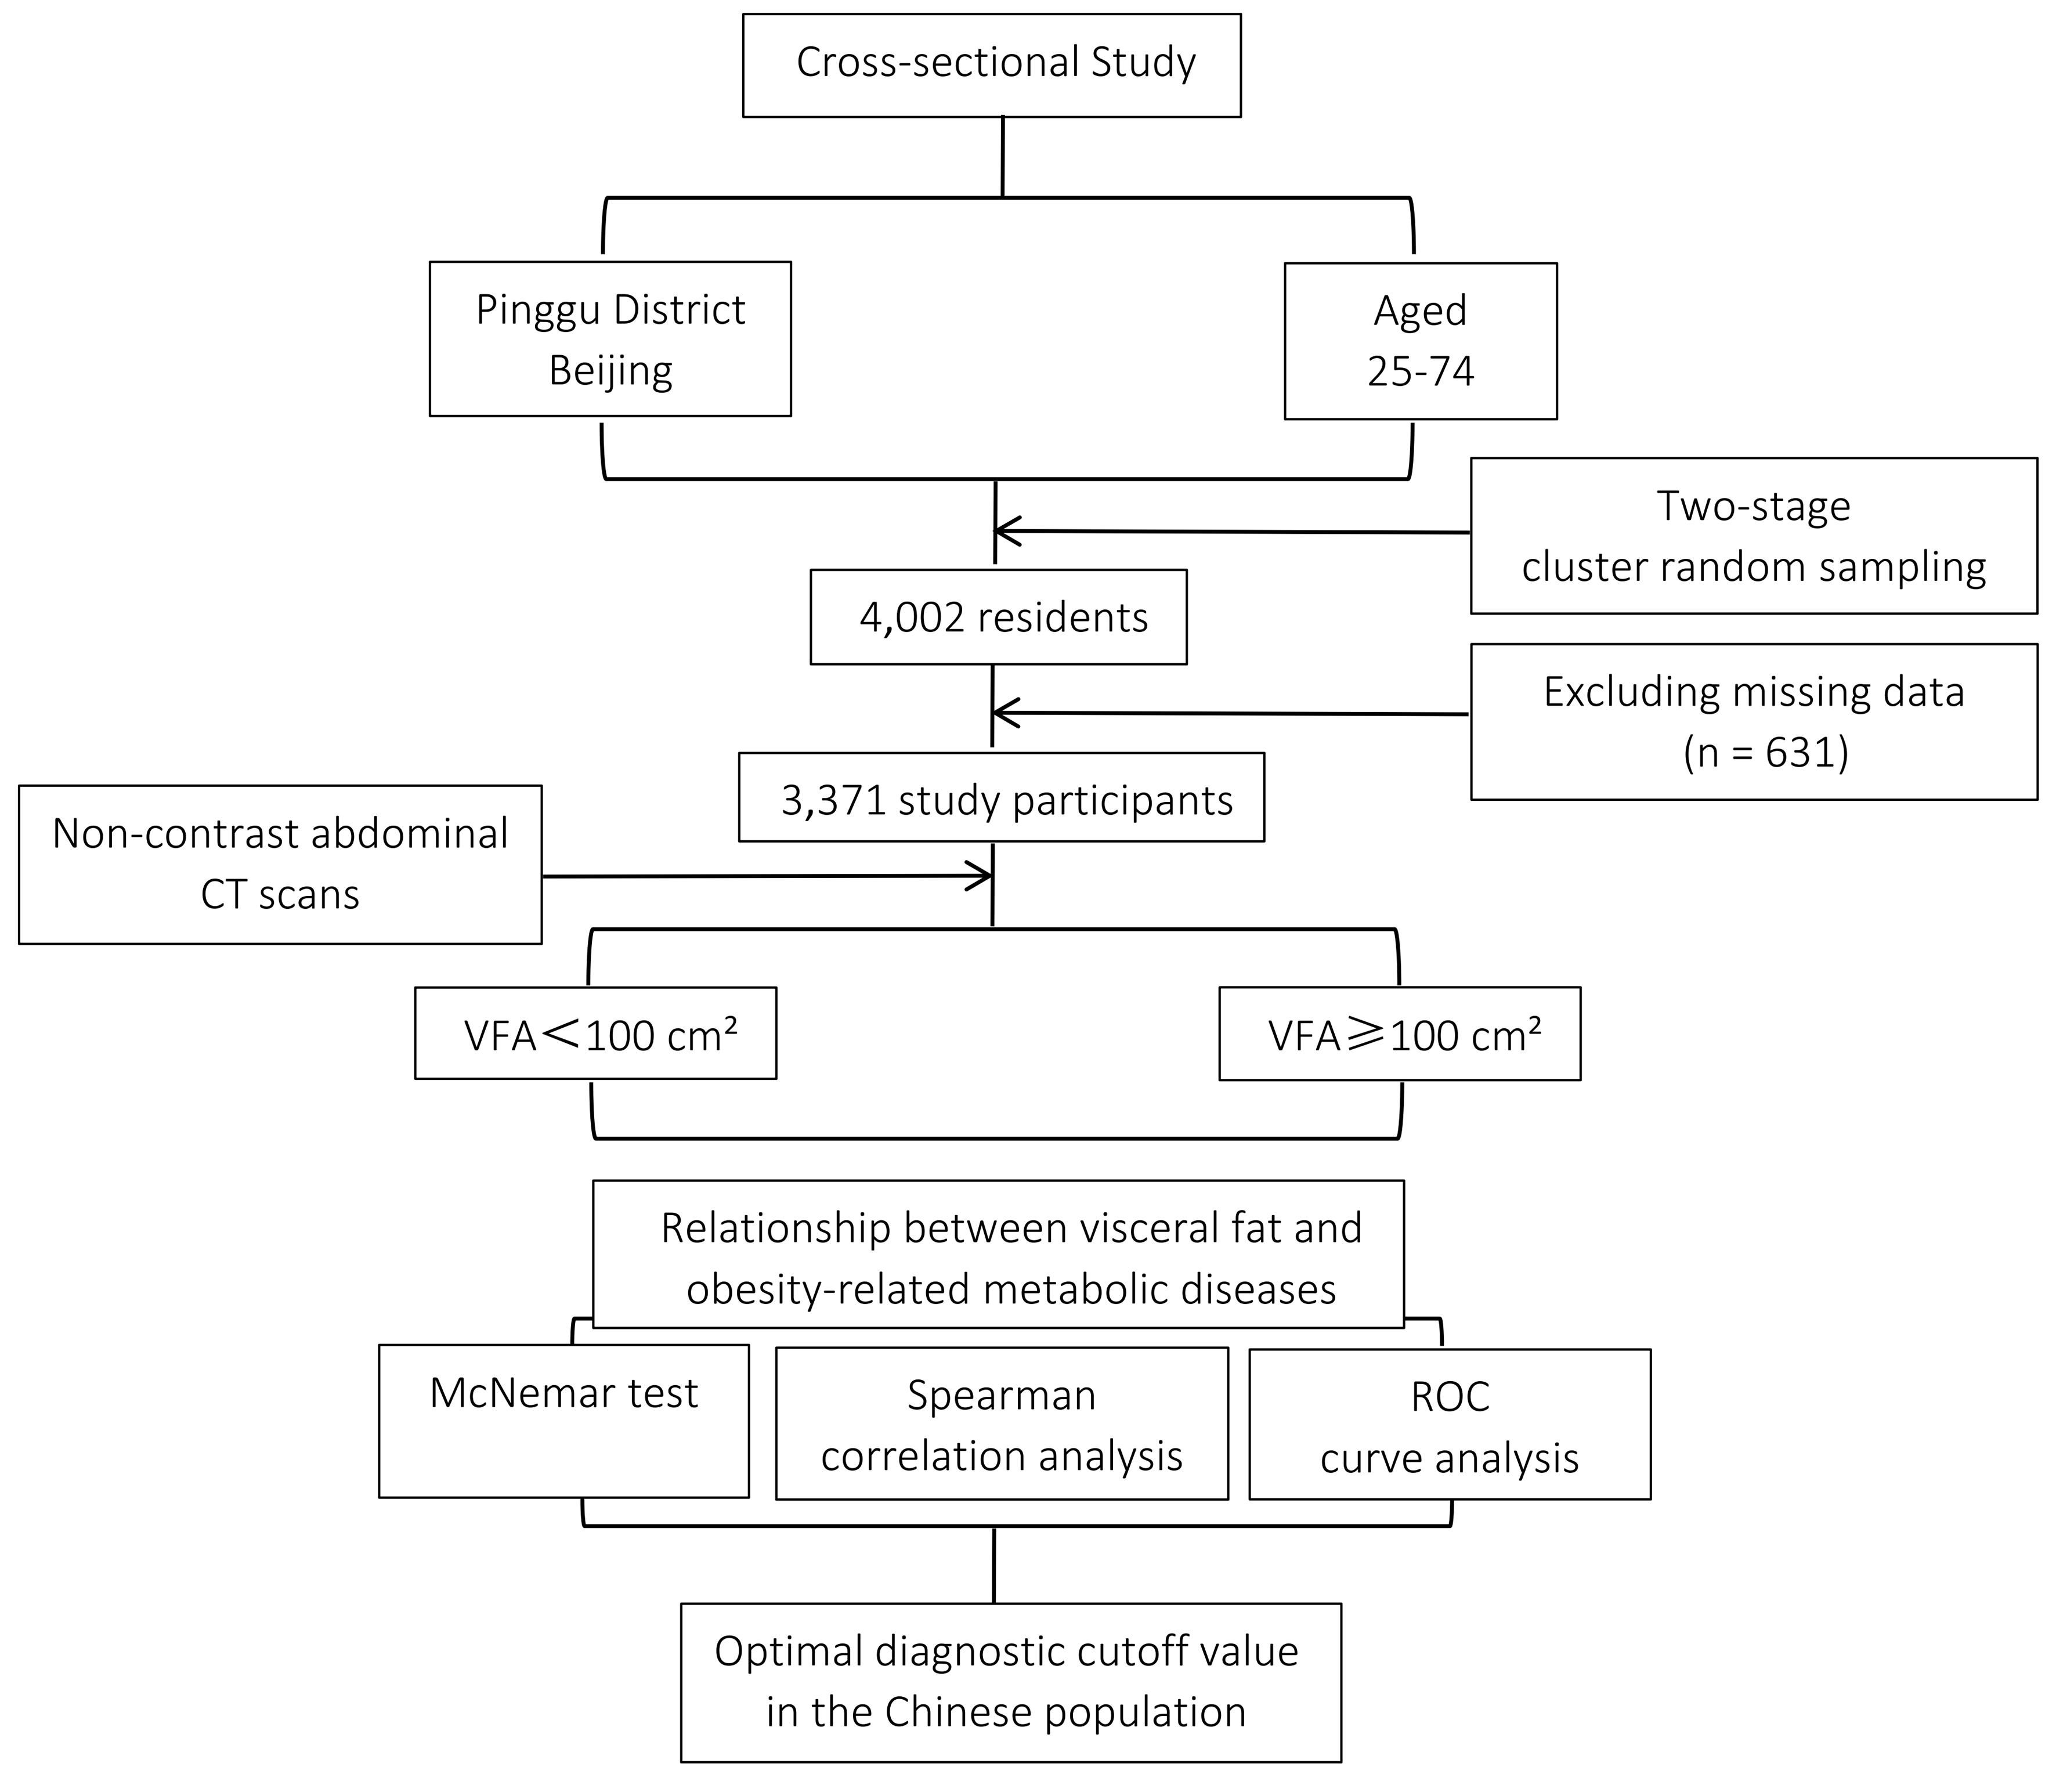
Figure 1. Study design and participant enrollment. VFA: Visceral fat area; ROC: receiver operating characteristic.
Procedures
Measurement of anthropometric indicators
A trained staff member measured height (cm) and weight (kg) while the participant wore light clothing and no shoes. BMI was calculated as weight (kg) divided by height squared (m2). Hip circumference (HC; cm) was measured at the maximum circumference of the buttocks, while waist circumference (WC; cm) was measured at the horizontal level of the midpoint between the lower edge of the ribs and the iliac crest. The WHR was defined as the ratio of WC to HC. The WHtR was defined as the ratio of WC to height.
Measurement of metabolism-related indicators
Blood samples were collected after a 10-12 h overnight fast. Participants without a previous diagnosis of T2DM underwent a 75 g, 2 h oral glucose tolerance test, whereas those with a prior diagnosis of T2DM had their fasting blood glucose levels measured. Plasma glucose, total cholesterol (TC), TG, high-density lipoprotein cholesterol (HDL-C), low-density lipoprotein cholesterol (LDL-C), alanine aminotransferase, and aspartate aminotransferase levels were measured using an automated clinical chemistry analyser (Unicel DxC 800; Beckman Coulter, Miami, FL, USA). Glycated haemoglobin level was measured using high-performance liquid chromatography (Adams A1c HA-8160; Arkray, Kyoto, Japan) in accordance with the Diabetes Control and Complications Trial standards. Serum leptin levels were measured using an enzyme-linked immunosorbent assay kit (EMD Millipore, Billerica, MA, USA).
Measurement of fat area
All participants underwent non-contrast abdominal CT using a 64-slice multidetector scanner (LightSpeed VCT; General Electric Healthcare, Milwaukee, WI, USA). CT was performed with the participant in the supine position, and 5 mm thick slices were obtained from the lung base to the pubic symphysis (120 kV, 120-150 mA). A single CT image was obtained at the level of the L4-L5 intervertebral disc space and at the midpoint between the inguinal fold and patella for subsequent analysis. The visceral fat area (VFA) and subcutaneous fat area (SFA) were determined by analysing the CT images using ImageJ version 1.34e (NIH, Bethesda, MD, USA). The cross-sectional area of the adipose tissue (cm2) was calculated using standard Hounsfield unit (HU) ranges (-190 to -30 for fat tissue). Total fat area (TFA) was measured by outlining the entire fat area, and VFA was determined by tracing the muscle wall surrounding the abdominal cavity. SFA was calculated as the difference between TFA and VFA[14]. A schematic diagram illustrating the CT image analysis process has been included in Supplementary Material 1.
Diagnostic criteria for obesity and metabolic disorders
New EASO criteria: For adults of European descent, obesity is defined as a BMI ≥ 25 kg/m2 with a WHtR ≥ 0.5 and the presence of any medical, functional, or psychological impairments or complications; or a BMI ≥ 30 kg/m2 regardless of the presence or absence of any medical, functional, or psychological impairments or complications[9].
Visceral obesity criteria in our study: Following the Japanese Obesity Standards Review Committee, visceral obesity was defined as a VFA ≥ 100 cm2[15]. This threshold has also been applied in studies of Chinese adults and has been shown to be useful for identifying individuals at increased metabolic and cardiovascular risk[16,17].
Metabolic syndrome (MS): According to the National Cholesterol Education Program ATP III - 2005 ATP III Standard, MS is diagnosed when at least three of the following characteristics are present[18]:
(1) Abdominal obesity: WC of ≥ 102 cm (40 inches) in men or ≥ 88 cm (35 inches) in women;
(2) Elevated TG: Serum TG level ≥ 150 mg/dL (1.7 mmol/L) or use of TG-lowering medication;
(3) Low HDL-C: Serum HDL-C level < 40 mg/dL (1 mmol/L) in men or < 50 mg/dL (1.3 mmol/L) in women, or use of medication to raise HDL-C;
(4) HTN: Blood pressure ≥ 130/85 mmHg or use of antihypertensive medication;
(5) Elevated fasting plasma glucose (FPG): FPG ≥ 100 mg/dL (5.6 mmol/L) or use of glucose-lowering medication.
T2DM diagnostic criteria: Previously diagnosed T2DM was defined as a history of physician-diagnosed T2DM and/or current treatment with glucose-lowering medications. Newly diagnosed T2DM was defined as a FPG level ≥ 7.0 mmol/L and/or a 2-h plasma glucose (2-hPG) level ≥ 11.1 mmol/L.
Pre-T2DM diagnostic criteria: Impaired glucose tolerance (IGT) was defined as FPG < 7.0 mmol/L and 2-hPG between 7.8 and 11.1 mmol/L. Impaired fasting glucose (IFG) was defined as FPG between 6.1 and 7.0 mmol/L with 2-hPG < 7.8 mmol/L. Pre-T2DM was defined as the presence of IGT and/or IFG.
Dyslipidaemia diagnostic criteria: Dyslipidaemia was defined by the presence of one or more of the following lipid abnormalities[19]:
(1) Hypertriglyceridaemia: TG ≥ 2.26 mmol/L;
(2) Hyper-LDL cholesterolaemia: LDL-C ≥ 4.14 mmol/L;
(3) Hypercholesterolemia: TC ≥ 6.22 mmol/L;
(4) Low HDL cholesterolaemia: HDL-C < 1.04 mmol/L.
HTN and CHD diagnostic criteria: Diagnoses of HTN and CHD were based on patient-reported medical histories collected through structured questionnaires administered by trained staff. No verification using medical records was performed, which may introduce recall or reporting bias.
Non-alcoholic fatty liver disease (NAFLD): NAFLD was diagnosed using non-contrast abdominal CT, as previously described[13,20,21]. HUs were measured in three liver regions and two spleen regions. The liver-to-spleen (L/S) ratio was calculated by averaging the liver and spleen measurements. NAFLD was defined as an L/S ratio of ≤ 1.1[22], in the absence of significant alcohol consumption or other secondary causes of hepatic steatosis. A representative CT image and corresponding measurement results are provided in Supplementary Material 2 for reference.
Statistics
Data were analysed using SPSS version 26 (IBM Corp., Armonk, NY, USA) and R version 4.4.1 (The R Foundation for Statistical Computing, Vienna, Austria). Quantitative data following a normal or approximately normal distribution are presented as mean ± standard deviation. An independent samples t-test was used for comparisons between two groups, and one-way analysis of variance was used for comparisons among multiple groups. Continuous variables that did not follow a normal distribution, specifically TG and leptin, are presented as the median and interquartile range (IQR), and the Kruskal-Wallis test was used for multiple group comparisons. Count data are expressed as rates, and comparisons between groups were performed using the chi-square test. A paired chi-square test (McNemar’s test) was used to compare the accuracy of the new EASO criteria with that of BMI in diagnosing visceral obesity. Correlations between anthropometric indicators and VFA were first assessed using Spearman’s rank correlation analysis. To control for potential confounding by age and sex, partial correlation analyses were additionally conducted, adjusting for these covariates. Receiver operating characteristic (ROC) curves were plotted to compare the diagnostic values and cut-off points of the anthropometric indicators and the new EASO criteria for visceral obesity. The analysis was conducted using the full dataset without splitting it into separate training and testing subsets. In addition to unadjusted analyses, logistic regression models were constructed with each anthropometric indicator as the independent variable and visceral obesity as the dependent variable, adjusting for age and sex. Predicted probabilities from these models were then used to generate covariate-adjusted ROC curves. A two-sided P-value < 0.05 was considered statistically significant.
RESULTS
A total of 3,371 participants were included in this study, with a mean age of 49.28 ± 11.81 years, and 1,604 (47.6%) were male. Among these, 2,063 (61.2%) were classified as having visceral obesity. The basic characteristics of the study participants for both the total population and those stratified by VFA groups are shown in Table 1. Compared with individuals with normal VFA, those with visceral obesity were more likely to be male and had a higher prevalence of MS, pre-T2DM, T2DM, HTN, NAFLD, and dyslipidaemia. Additionally, metabolism-related indicators, including blood pressure and blood glucose and lipid levels, were elevated in the visceral obesity group. Individuals with visceral obesity exhibited higher BMI, WC, WHR, and WHtR.
Baseline characteristics of the study population and VFA subgroups
| Variables | Total | VFA < 100 cm2 (N = 1,308) | VFA ≥ 100 cm2 (N = 2,063) | P |
| Age | 49.28 ± 11.81 | 46.98 ± 11.72 | 50.73 ± 11.63 | < 0.001 |
| Men | 1,604 (47.6%) | 492 (37.6%) | 1,112 (53.9%) | < 0.001 |
| MS | 1,223 (36.3%) | 153 (11.7%) | 1,073 (51.9%) | < 0.001 |
| Pre-T2DM | 998 (19.6%) | 266 (20.3%) | 732 (35.5%) | < 0.001 |
| T2DM | 332 (9.8%) | 46 (3.5%) | 286 (13.9%) | < 0.001 |
| HTN | 885 (26.3%) | 175 (13.4%) | 710 (34.4%) | < 0.001 |
| CHD | 219 (6.5%) | 93 (7.1%) | 126 (6.1%) | 0.281 |
| NAFLD | 71.6 (21.1%) | 157 (12%) | 559 (27.1%) | < 0.001 |
| Hyperlipidaemia | 1,618 (48%) | 384 (29.4%) | 1,234 (59.8%) | < 0.001 |
| BMI | 25.97 ± 3.80 | 23.34 ± 2.81 | 27.63 ± 3.38 | < 0.001 |
| WC | 88.20 ± 10.30 | 80.11 ± 7.39 | 93.32 ± 8.43 | < 0.001 |
| WHR | 0.90 ± 0.07 | 0.85 ± 0.06 | 0.92 ± 0.06 | < 0.001 |
| WHtR | 0.54 ± 0.06 | 0.50 ± 0.05 | 0.57 ± 0.05 | < 0.001 |
| SBP | 129.3.9 ± 17.87 | 123.95 ± 17.85 | 132.85 ± 17.00 | < 0.001 |
| DBP | 78.55 ± 11.32 | 74.80 ± 10.48 | 80.93 ± 11.20 | < 0.001 |
| FPG | 5.71 ± 0.81 | 5.47 ± 0.72 | 5.86 ± 0.83 | < 0.001 |
| 2-hPG | 7.41 ± 2.60 | 6.58 ± 2.13 | 7.93 ± 2.74 | < 0.001 |
| HbA1c | 5.63 ± 0.55 | 5.47 ± 0.38 | 5.73 ± 0.62 | < 0.001 |
| TC | 4.91 ± 0.96 | 4.73 ± 0.87 | 5.03 ± 0.99 | < 0.001 |
| TG | 1.18 (0.76, 1.81) | 0.82 (0.56, 1.22) | 1.45 (1.02, 2.16) | < 0.001 |
| LDL | 2.88 ± 0.79 | 2.73 ± 0.73 | 2.98 ± 0.81 | < 0.001 |
| HDL | 1.17 ± 0.31 | 1.29 ± 0.32 | 1.10 ± 0.28 | < 0.001 |
| Leptin | 12.87 (6.14, 32.20) | 9.64 (2.92, 18.54) | 14.83 (7.83, 26.58) | < 0.001 |
As the number of obesity-related metabolic diseases (MS, pre-T2DM, T2DM, HTN, CHD, hyperlipidaemia, and NAFLD) increased, the prevalence of visceral obesity also increased, accompanied by an increasing trend in VFA, SFA, and TFA [Figure 2]. Compared with individuals with normal VFA, those with visceral obesity had a higher number of obesity-related metabolic diseases. The proportion of individuals with more than two types of metabolic diseases was significantly higher in the visceral obesity group than in the normal VFA group [Figure 3]. Among individuals with a normal VFA, the proportion of individuals without metabolic disease or with only one disease was significantly higher than that in the visceral obesity group [Figure 3].
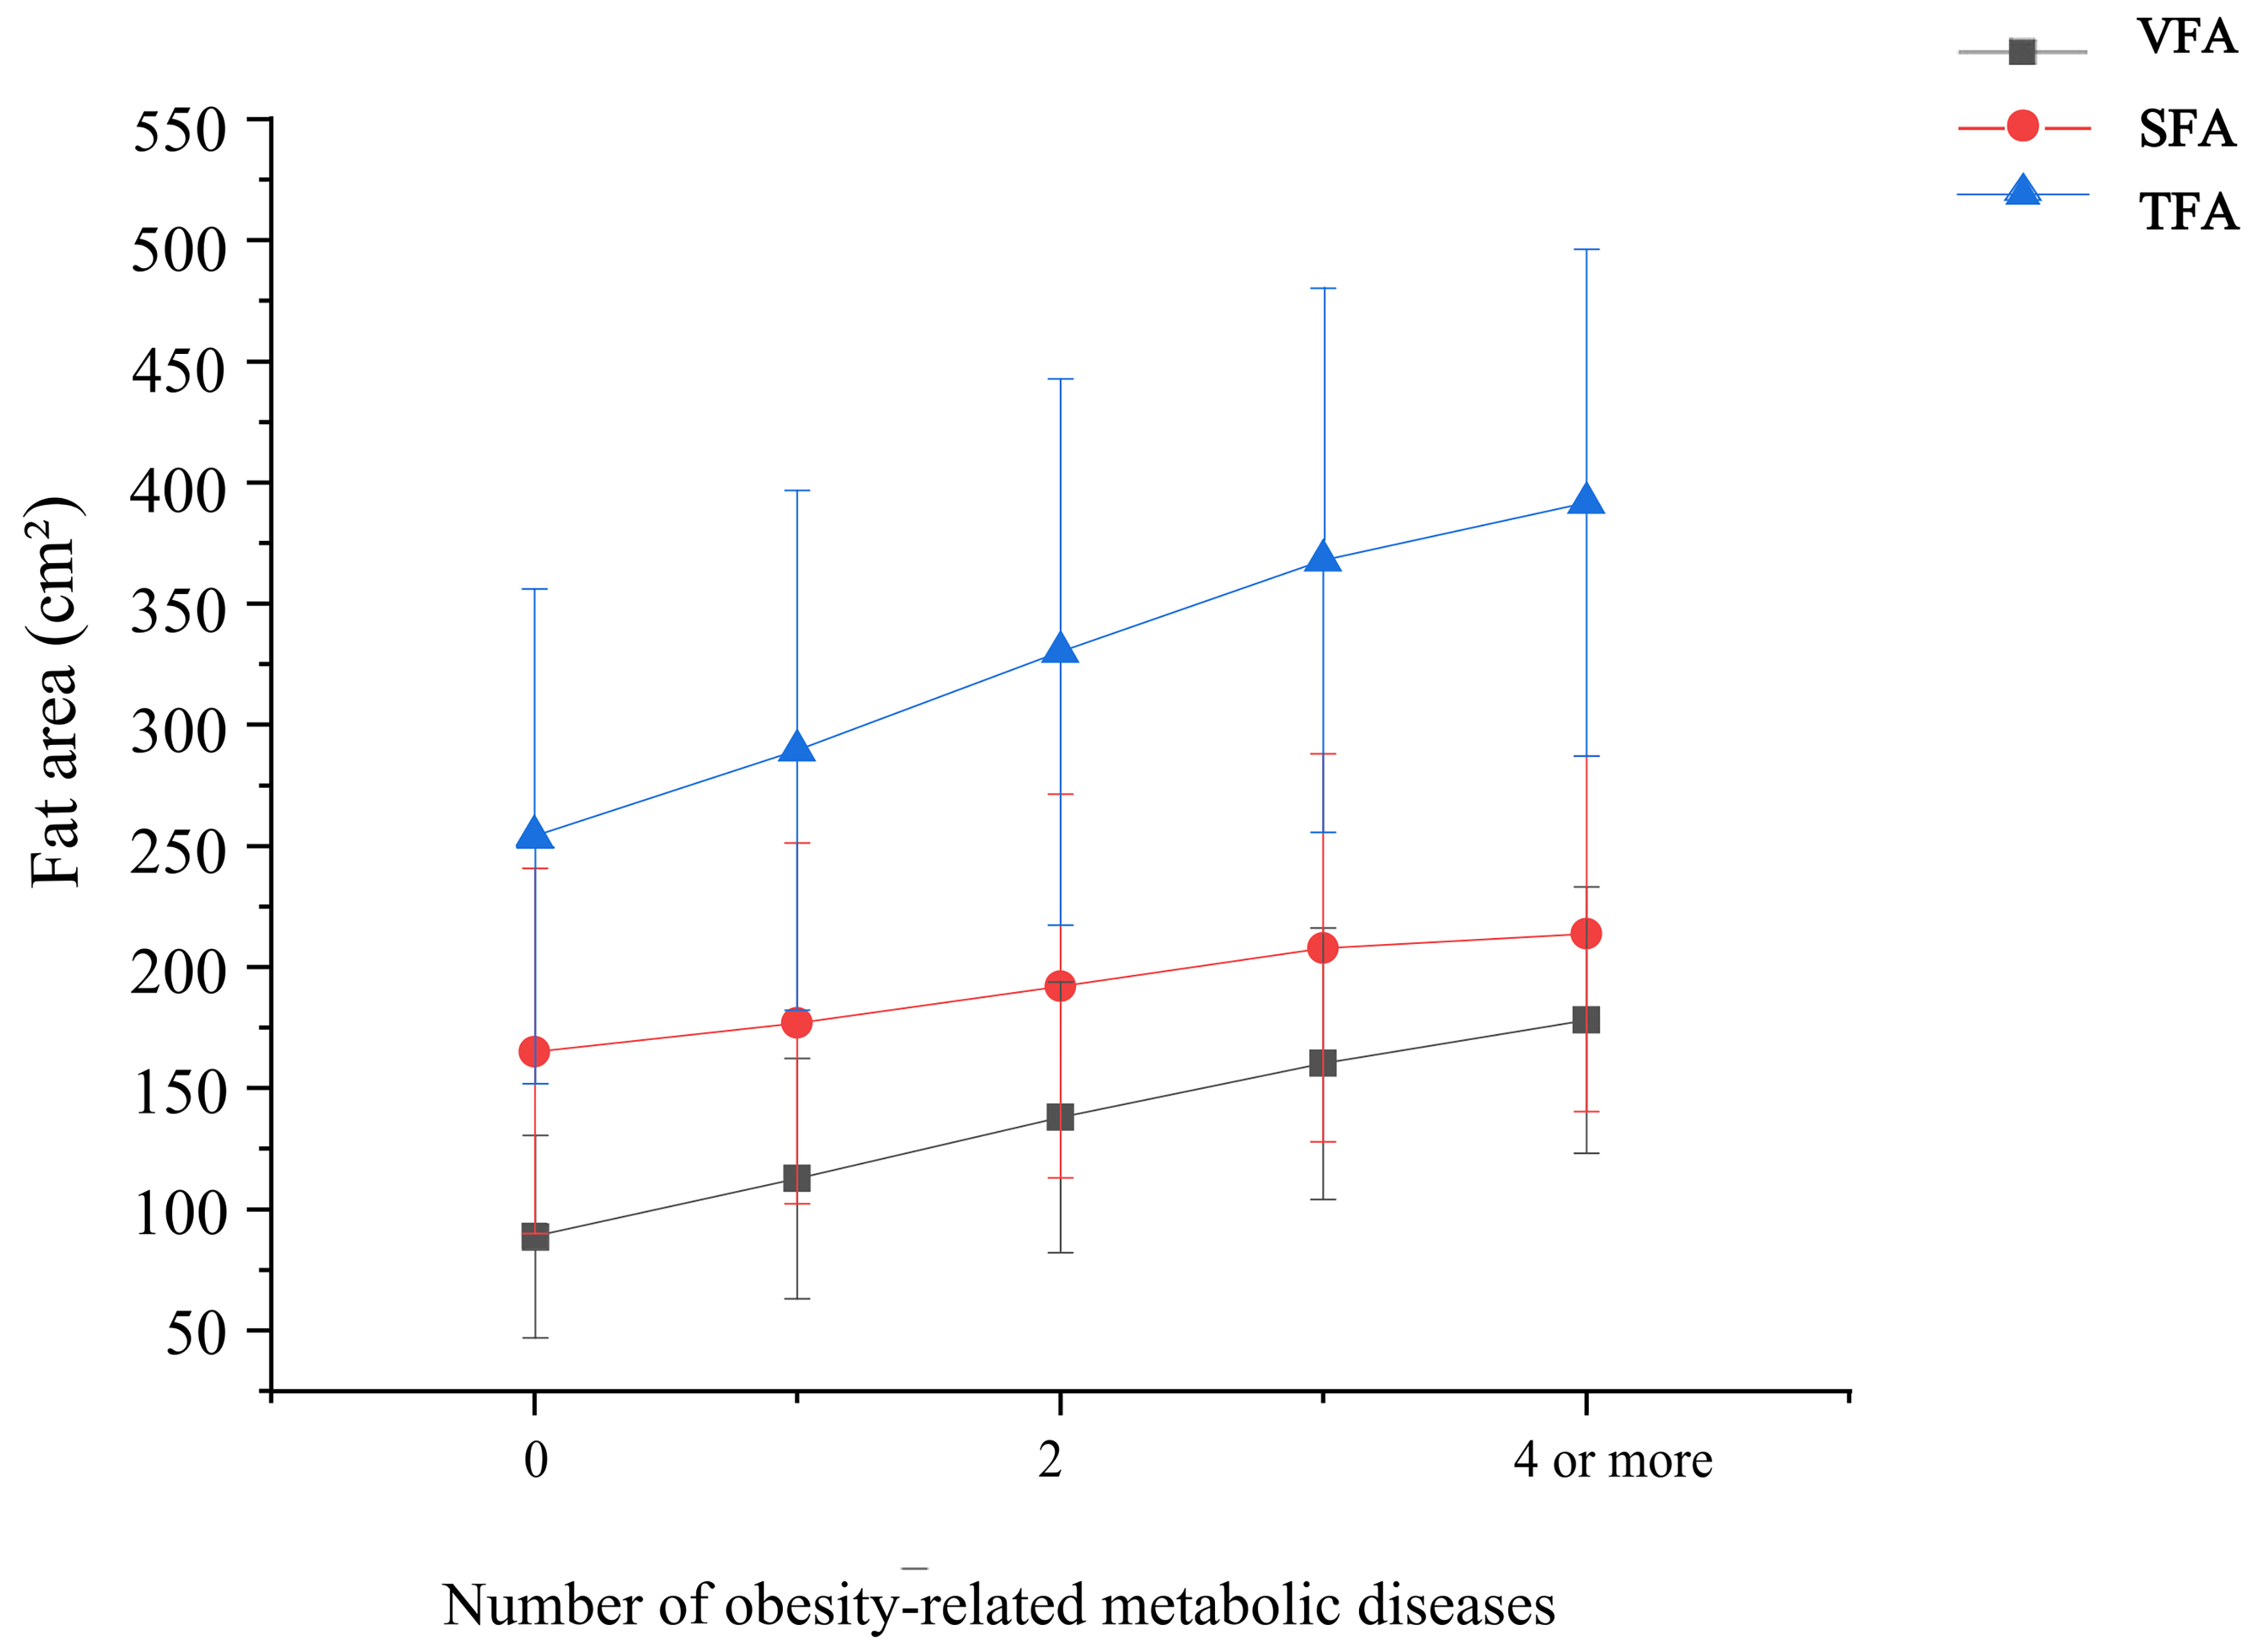
Figure 2. Relationship between fat area and the number of obesity-related metabolic diseases. Obesity-related metabolic diseases include diabetes mellitus, type 2 diabetes mellitus, dyslipidaemia, hypertension, coronary atherosclerotic heart disease, and non-alcoholic fatty liver disease. Bars indicate standard deviations. VFA: Visceral fat area; SFA: subcutaneous fat area; TFA: total fat area.
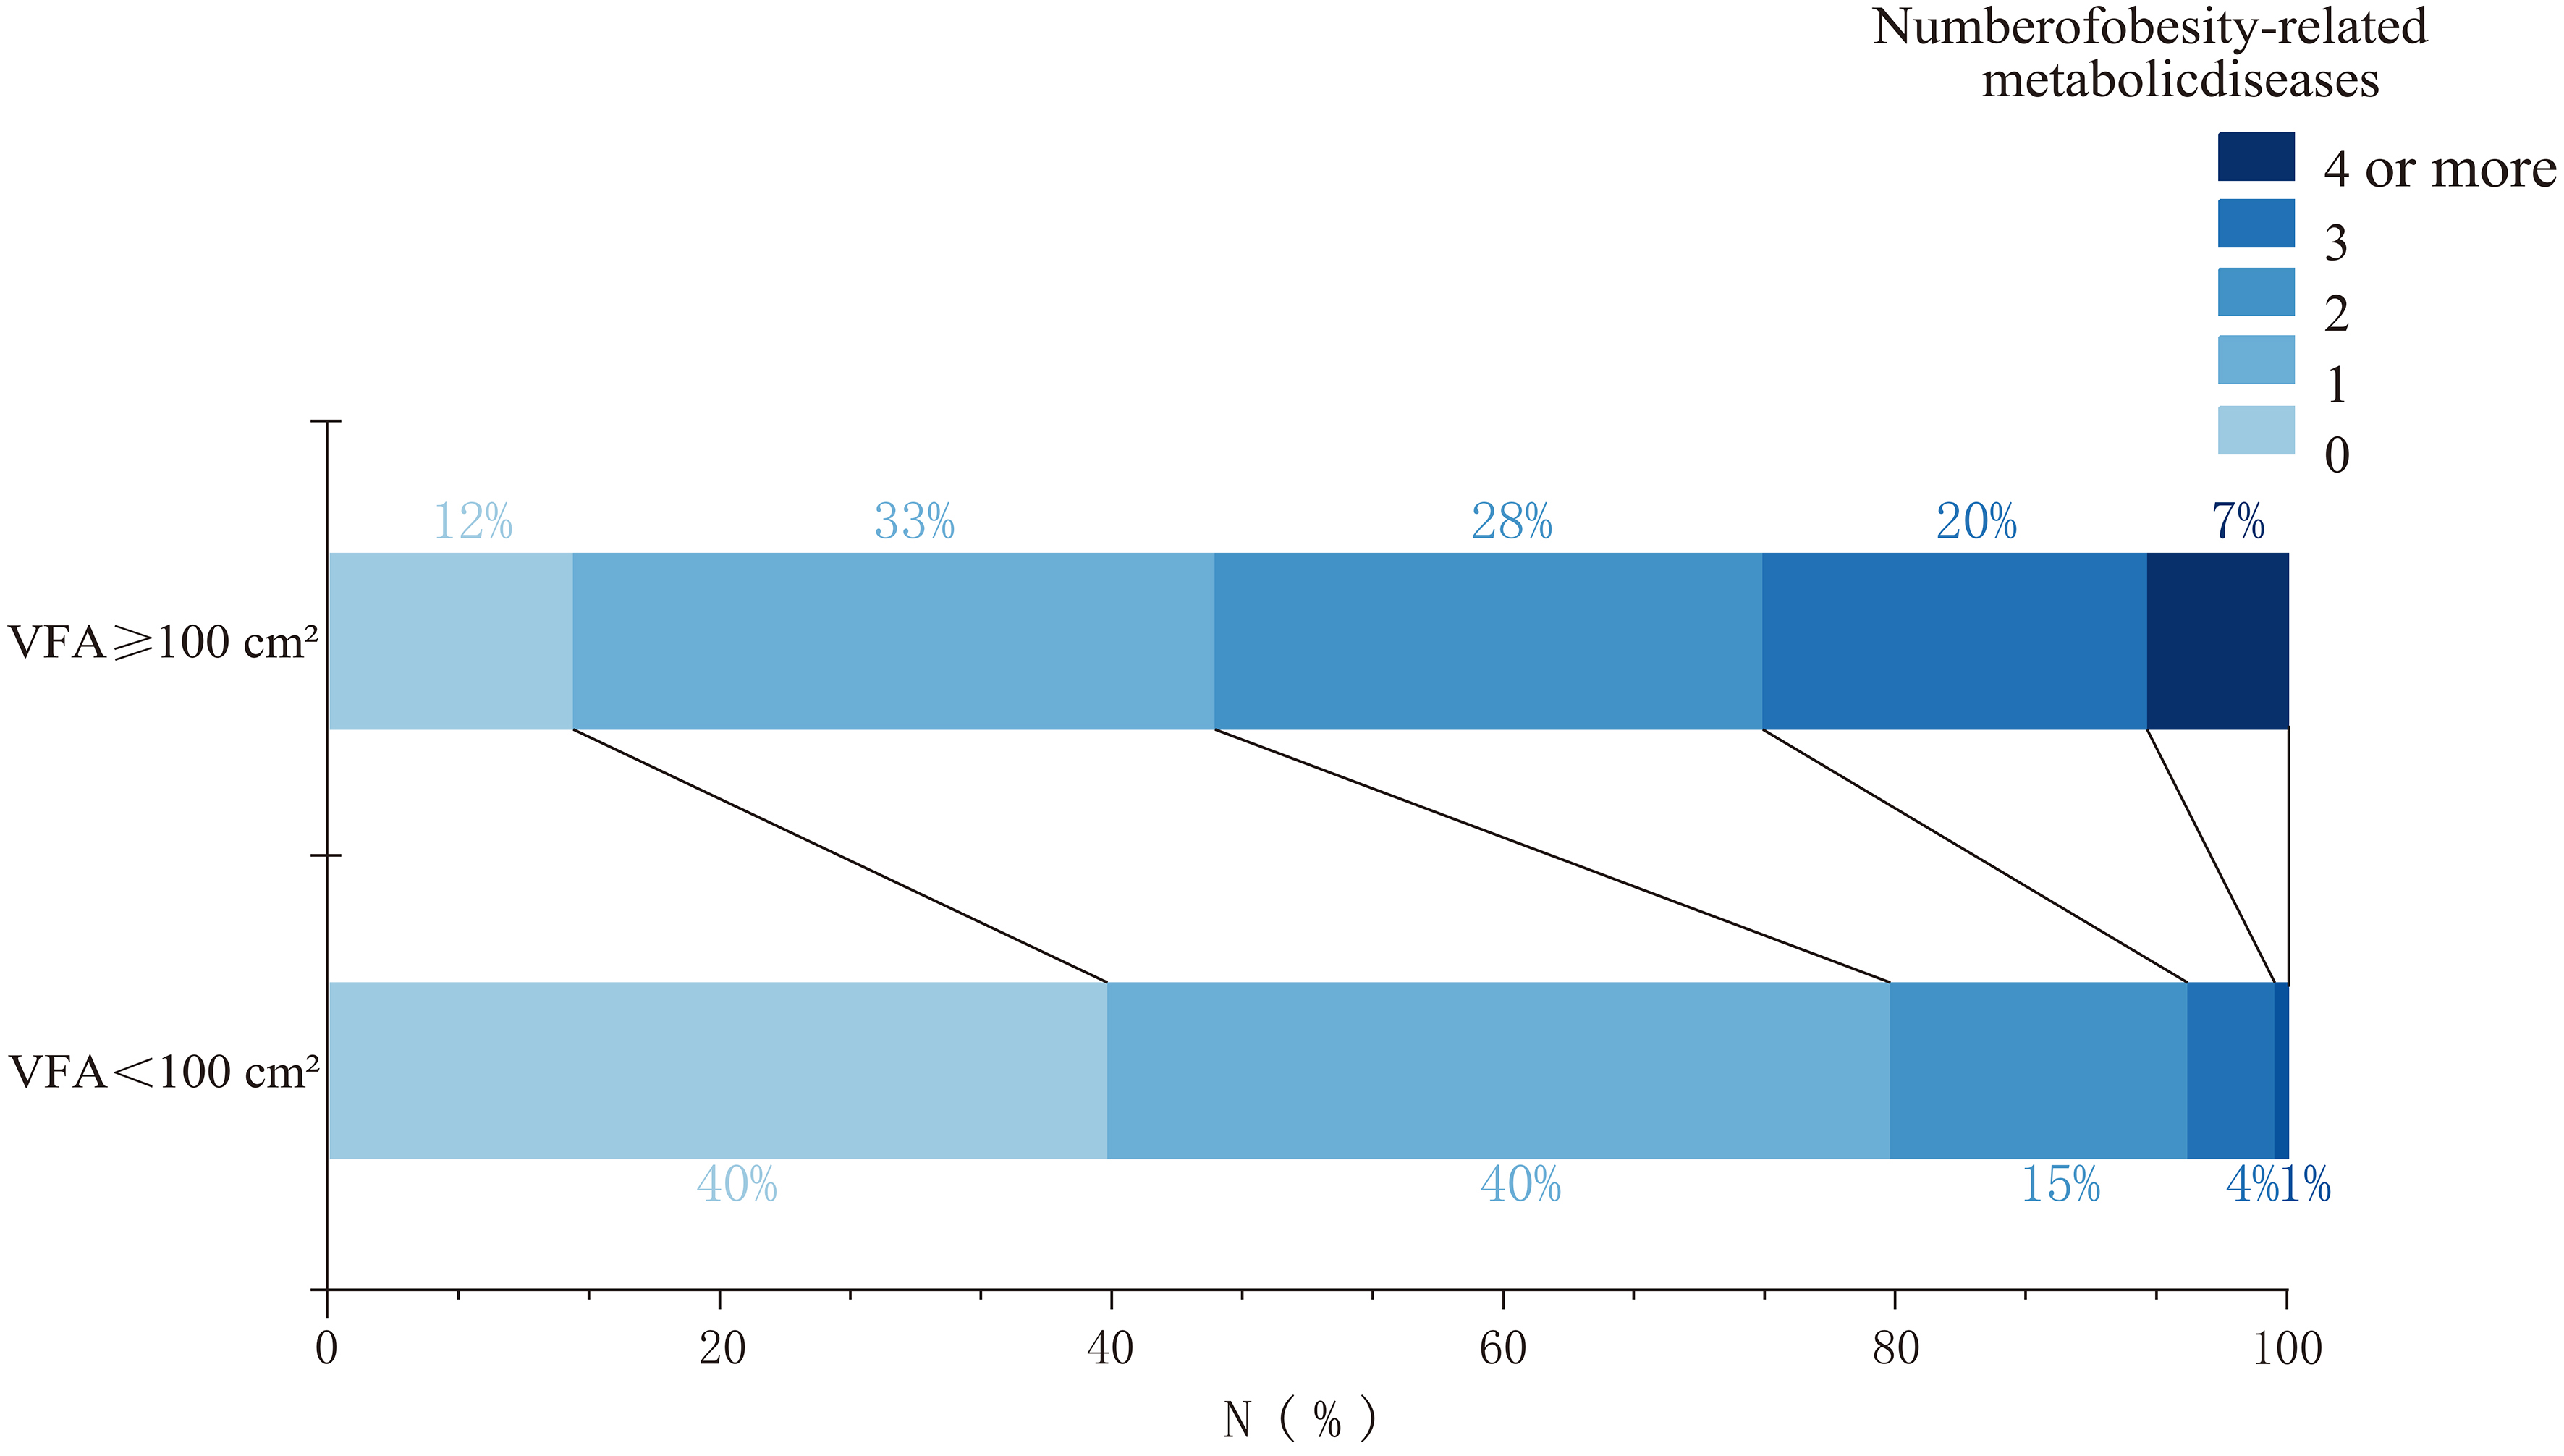
Figure 3. Proportion of obesity-related metabolic diseases across VFA groups. Obesity-related metabolic diseases include diabetes mellitus, type 2 diabetes mellitus, dyslipidaemia, hypertension, coronary atherosclerotic heart disease, and non-alcoholic fatty liver disease. VFA: Visceral fat area.
Using VFA ≥ 100 cm2 as the diagnostic criterion for visceral obesity, the new EASO criteria (BMI ≥
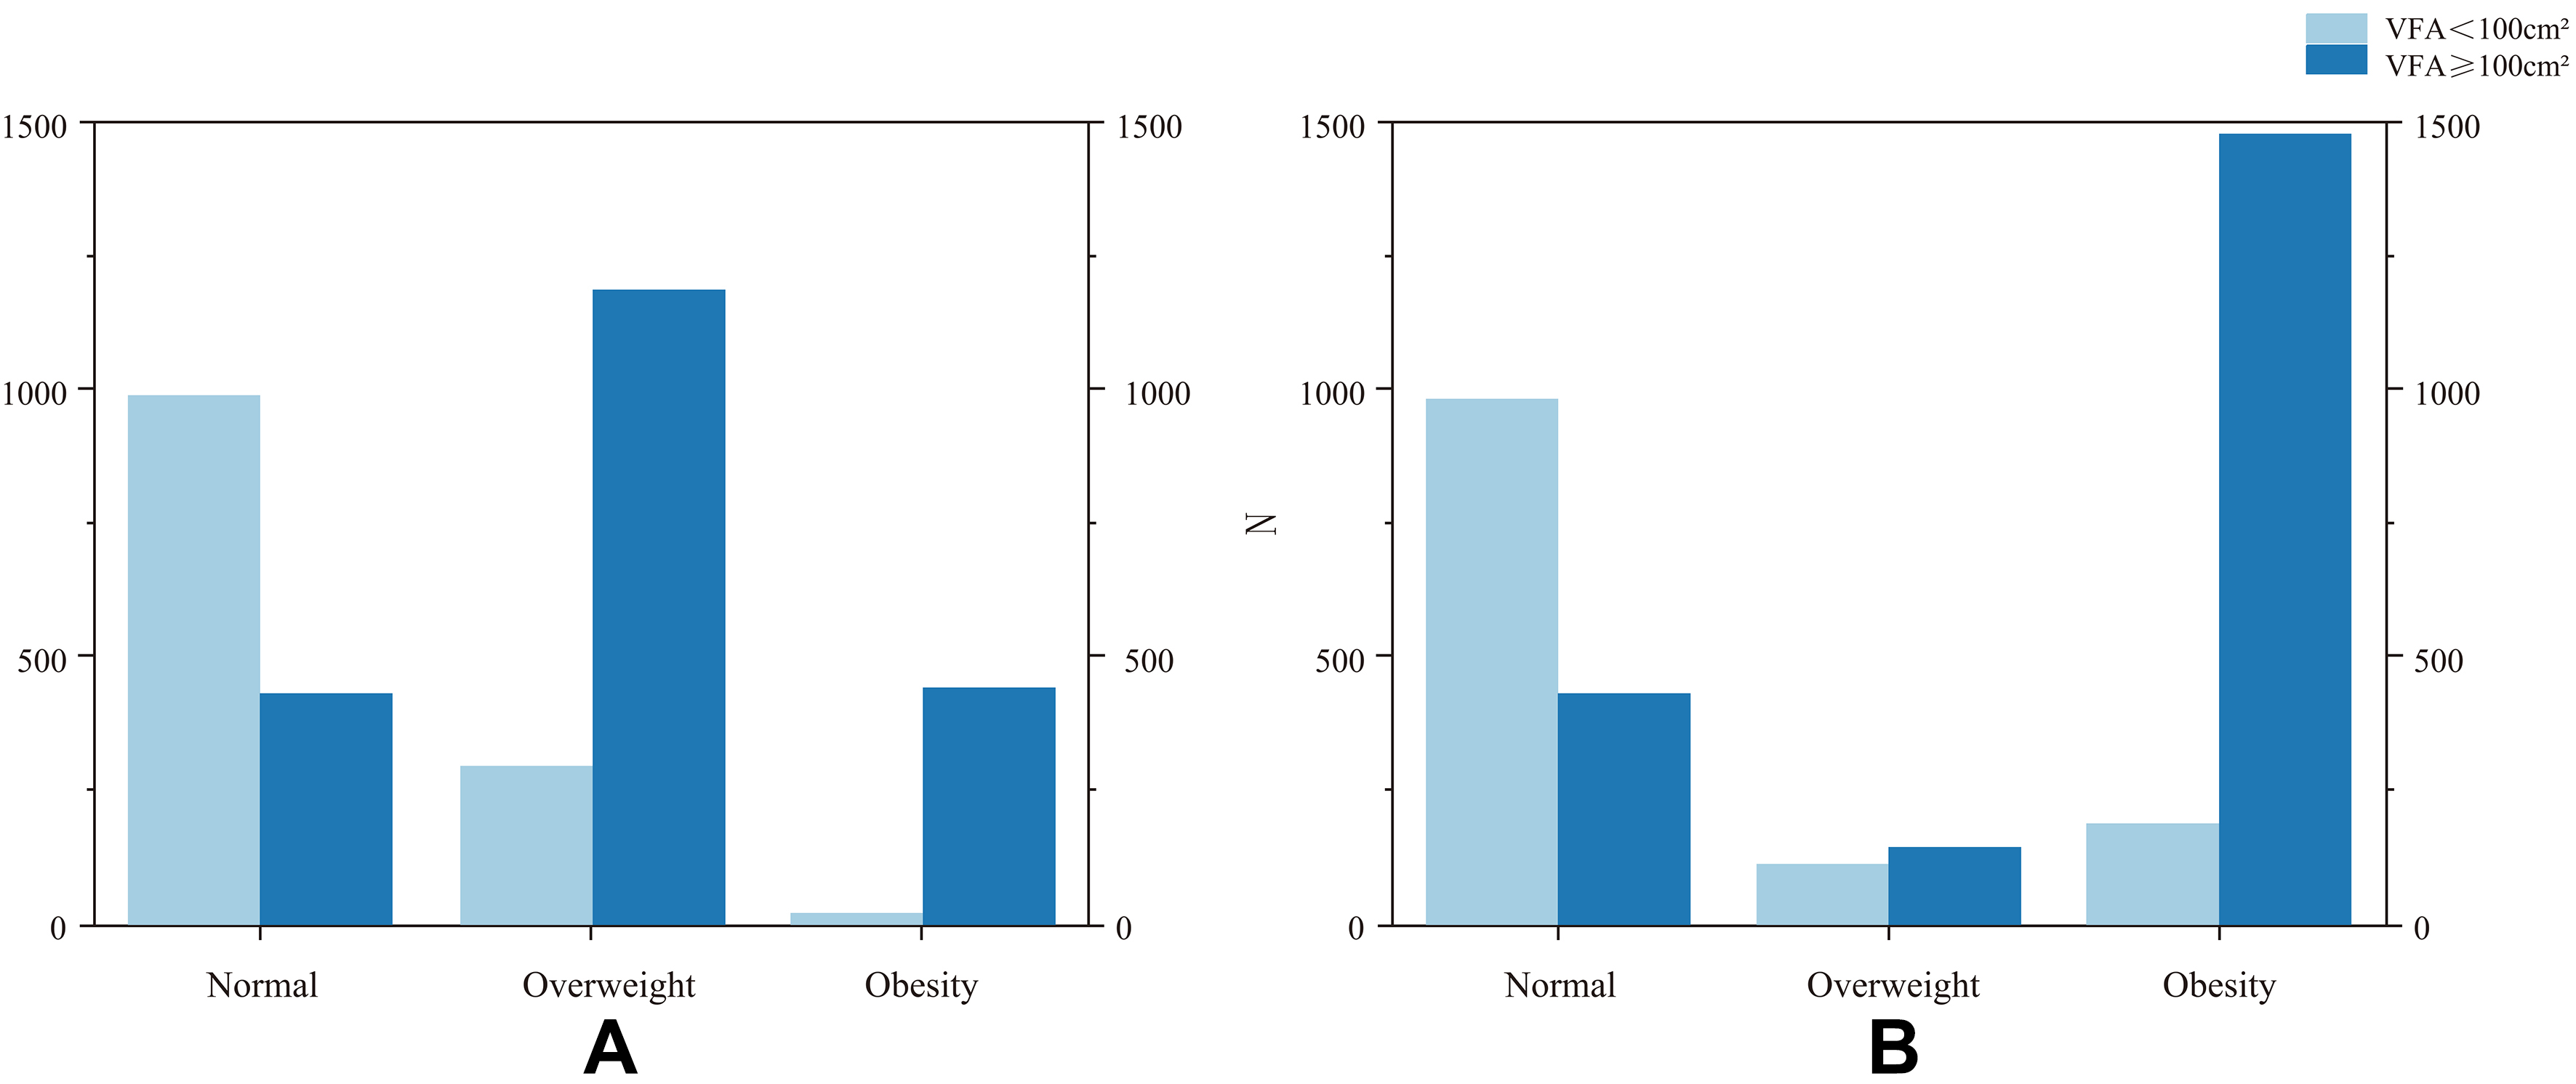
Figure 4. Classification of visceral obesity based on BMI (A) and the EASO obesity criteria (B). (A) Normal weight, BMI < 25 kg/m2; overweight, 25 kg/m2 ≤ BMI < 30 kg/m2; and obesity, BMI ≥ 30 kg/m2; (B) Normal weight, BMI < 25 kg/m2; overweight, 25 kg/m2 ≤ BMI < 30 kg/m2 and WHtR < 0.5 or 25 kg/m2 ≤ BMI < 30 kg/m2 and WHtR ≥ 0.5 with absence of any obesity-related metabolic diseases (diabetes mellitus, type 2 diabetes mellitus, dyslipidaemia, hypertension, coronary atherosclerotic heart disease, and non-alcoholic fatty liver Disease); obesity, BMI ≥ 25 kg/m2 and WHtR ≥ 0.5 and the presence of any obesity-related metabolic diseases or BMI ≥ 30 kg/m2 and the absence or presence of any obesity-related metabolic diseases. BMI: Body mass index; EASO: European Association for the Study of Obesity; WHtR: waist-to-height ratio; VFA: visceral fat area.
Contingency table for diagnosing visceral obesity using different obesity diagnostic criteria
| VFA < 100 cm2 (N = 1,308) | VFA ≥ 100 cm2 (N = 2,063) | Total (N = 3,371) | Sensitivity | Specificity | |
| EASO | 0.717 | 0.846 | |||
| Non-obesity | 1,107 (84.6%) | 583 (28.3%) | 1,690 (50.1%) | ||
| Obesity | 201 (15.4%) | 1,480 (71.7%) | 1,681 (49.9%) | ||
| BMI ‡ | 0.215§ | 0.985§ | |||
| Non-obesity | 1,288 (98.5%) | 1,620 (78.5%) | 2,098 (50.6%) | ||
| Obesity | 20 (1.5%) | 443 (21.5%) | 463 (49.5%) | ||
| 1,308 (38.8%) | 2,063 (61.2%) | 3,371 (100%) |
Spearman’s correlation analysis indicated that VFA was significantly correlated with BMI, HC, WC, WHR, and WHtR in the total population (all P < 0.05, Figure 5A), as well as in both men [Figure 5B] and women [Figure 5C]. To account for potential confounding by age and sex, we conducted partial correlation analyses adjusting for these covariates. The results showed that the associations between VFA and each anthropometric indicator remained statistically significant after adjustment [Figure 5D], confirming the robustness of these relationships.
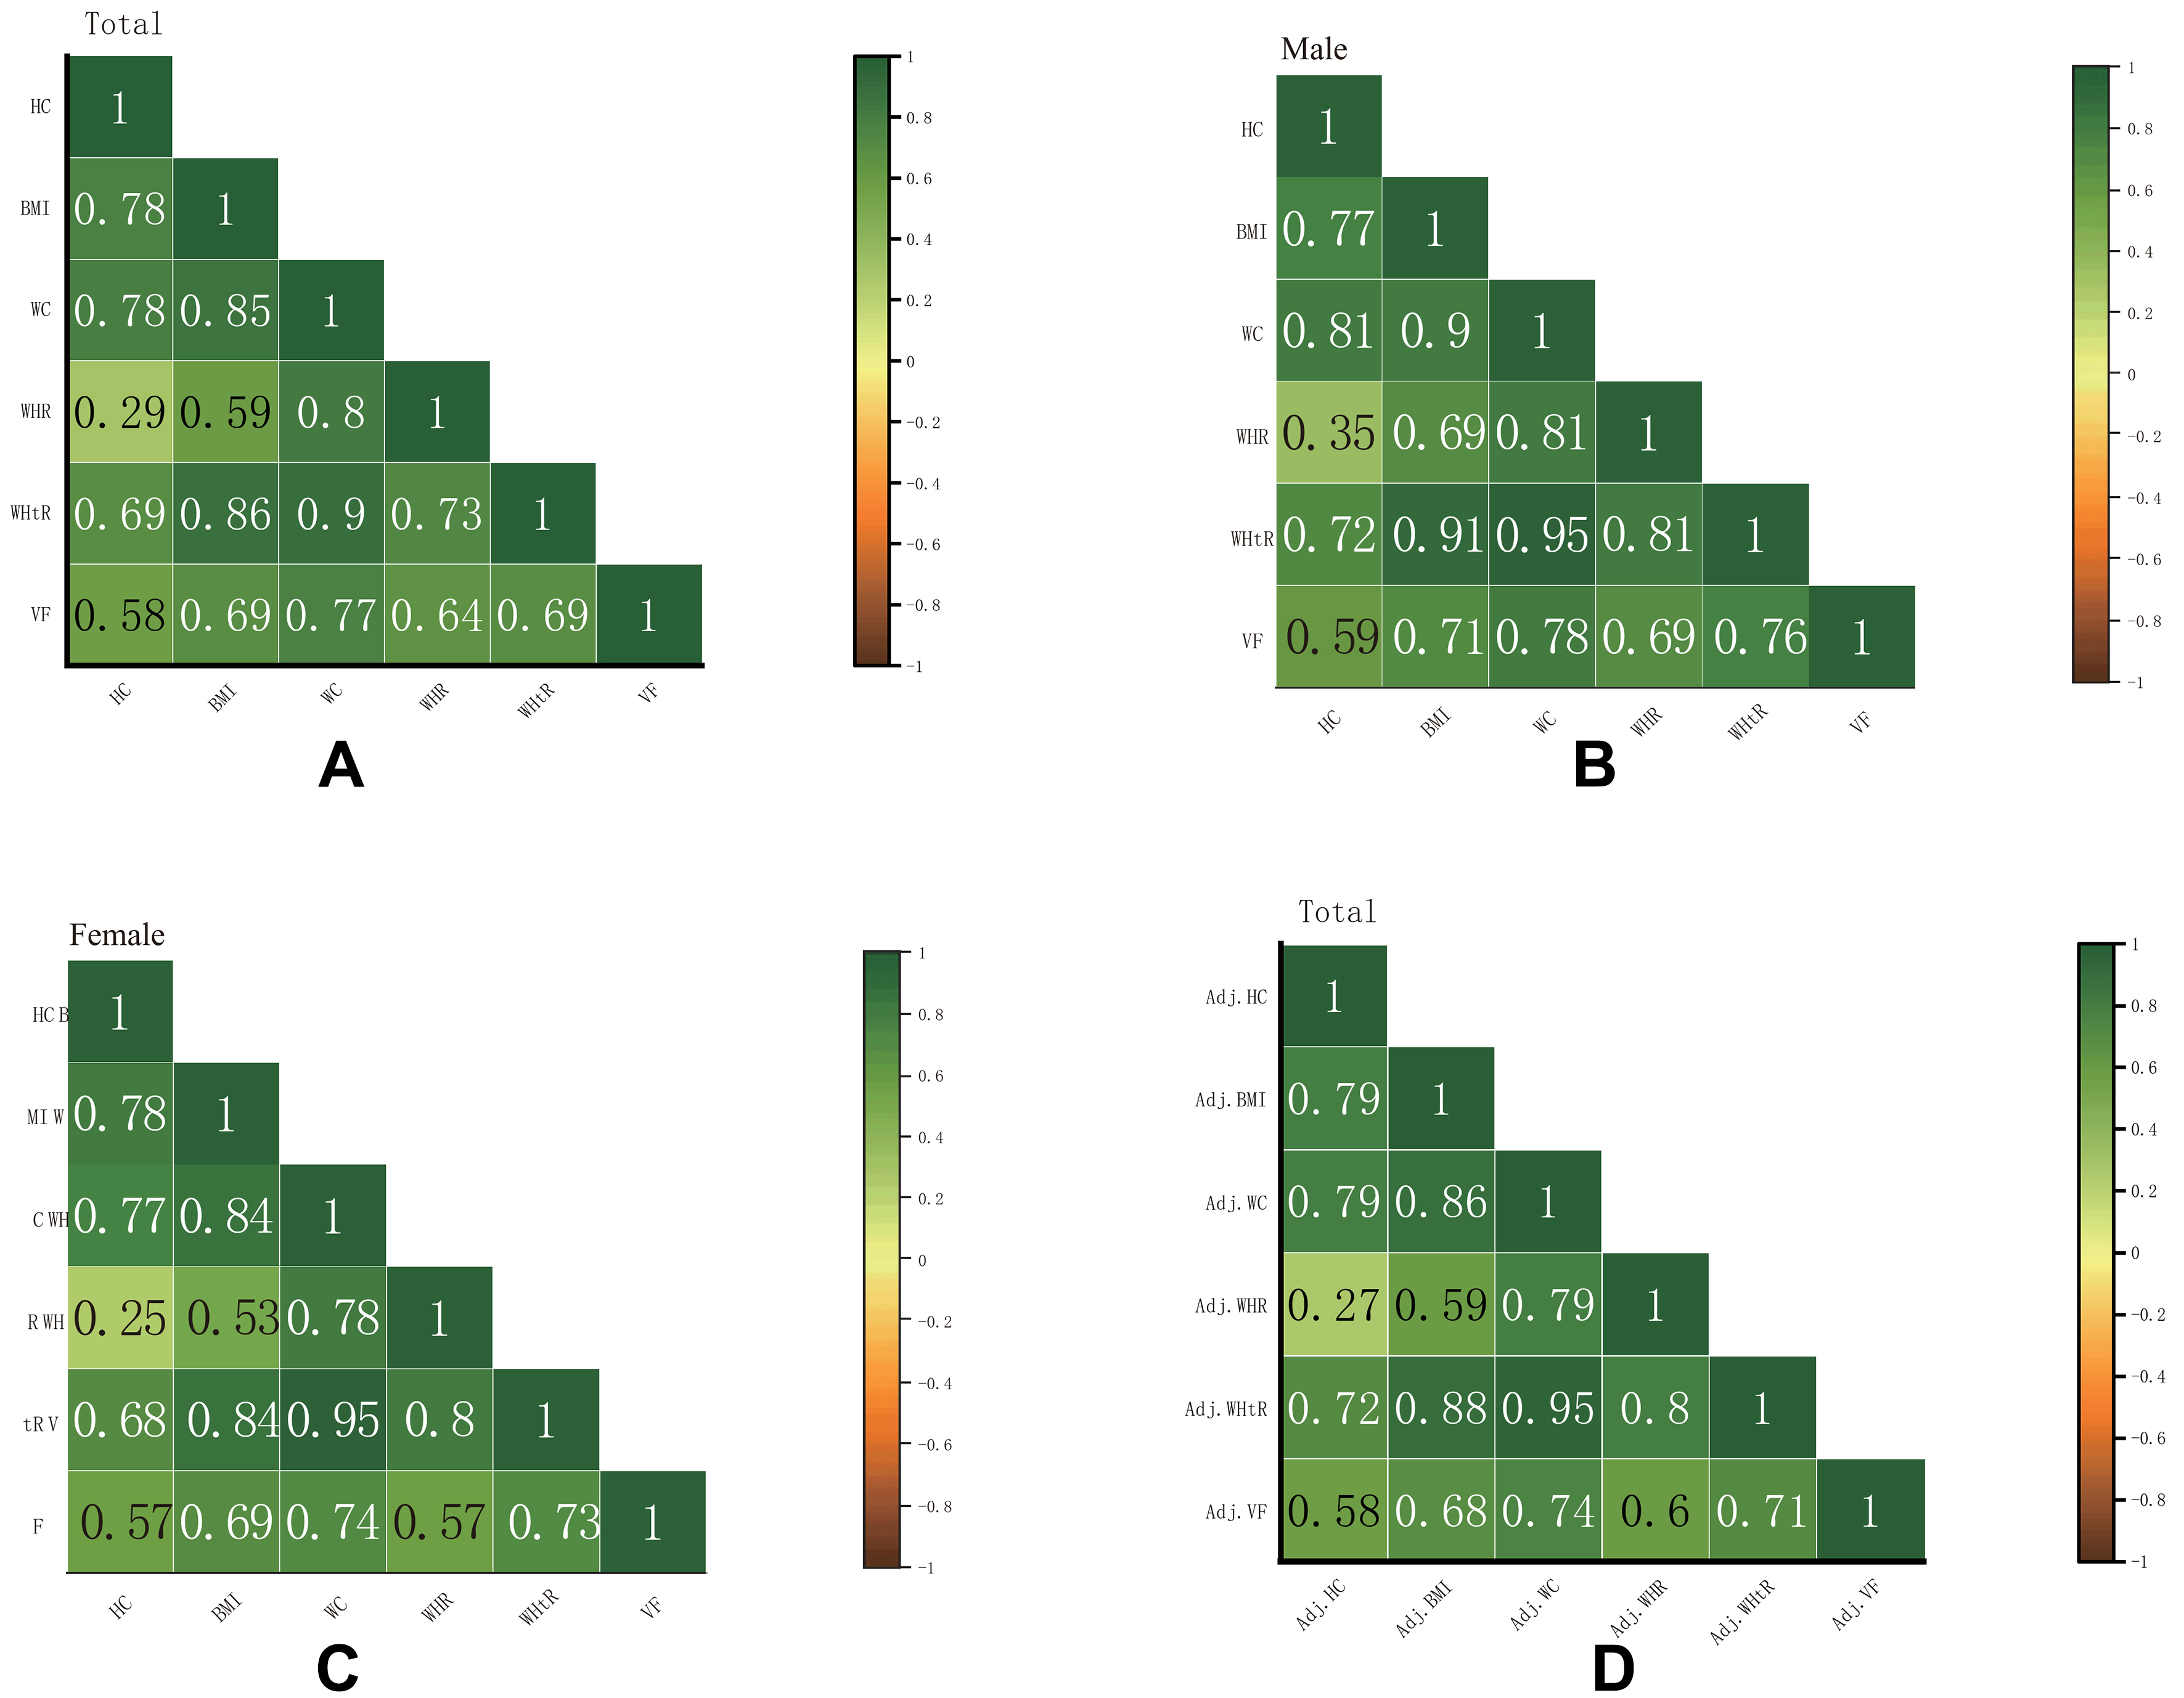
Figure 5. Correlation heatmap of anthropometric indicators with visceral fat area. Total population (A), males (B), and females (C). The numbers refer to the pairwise Spearman’s correlation coefficients. Partial correlation heatmap adjusted for age and sex in the total population (D).
In the ROC curve analysis, the combination of BMI and WC showed the highest diagnostic performance for identifying visceral obesity in the total population, outperforming other anthropometric indicators and the EASO criteria (AUC = 0.891, Figure 6A). This improvement was mainly due to an increase in specificity, indicating a better ability to rule out individuals without visceral obesity, while sensitivity remained comparable to individual measures. In sex-stratified analyses, the combination of BMI and WC yielded similar diagnostic accuracy to WC alone among men (AUC = 0.907; P = 0.386, Figure 6B), with optimal cut-off points of BMI ≥ 24.82 kg/m2 and WC ≥ 87.65 cm [Table 3]. Notably, in men, WHtR alone demonstrated a slightly higher AUC than the combination of BMI and WHtR, which may be partially attributed to the absence of age adjustment in the stratified analysis, given WHtR’s relative independence from age. Among women, the combination of BMI and WC exhibited the highest diagnostic value (AUC = 0.873, Figure 6C), with cut-off points of BMI ≥ 25.26 kg/m2 and WC ≥ 84.75 cm [Table 3]. To further account for the influence of age and sex on diagnostic performance, we constructed logistic regression models including age and sex as covariates. The predicted probabilities derived from these models were used to generate adjusted ROC curves. The results demonstrated that the diagnostic performance of BMI combined with WC remained superior after adjustment, and combining BMI with WHtR outperformed WHtR alone [Figure 6D].
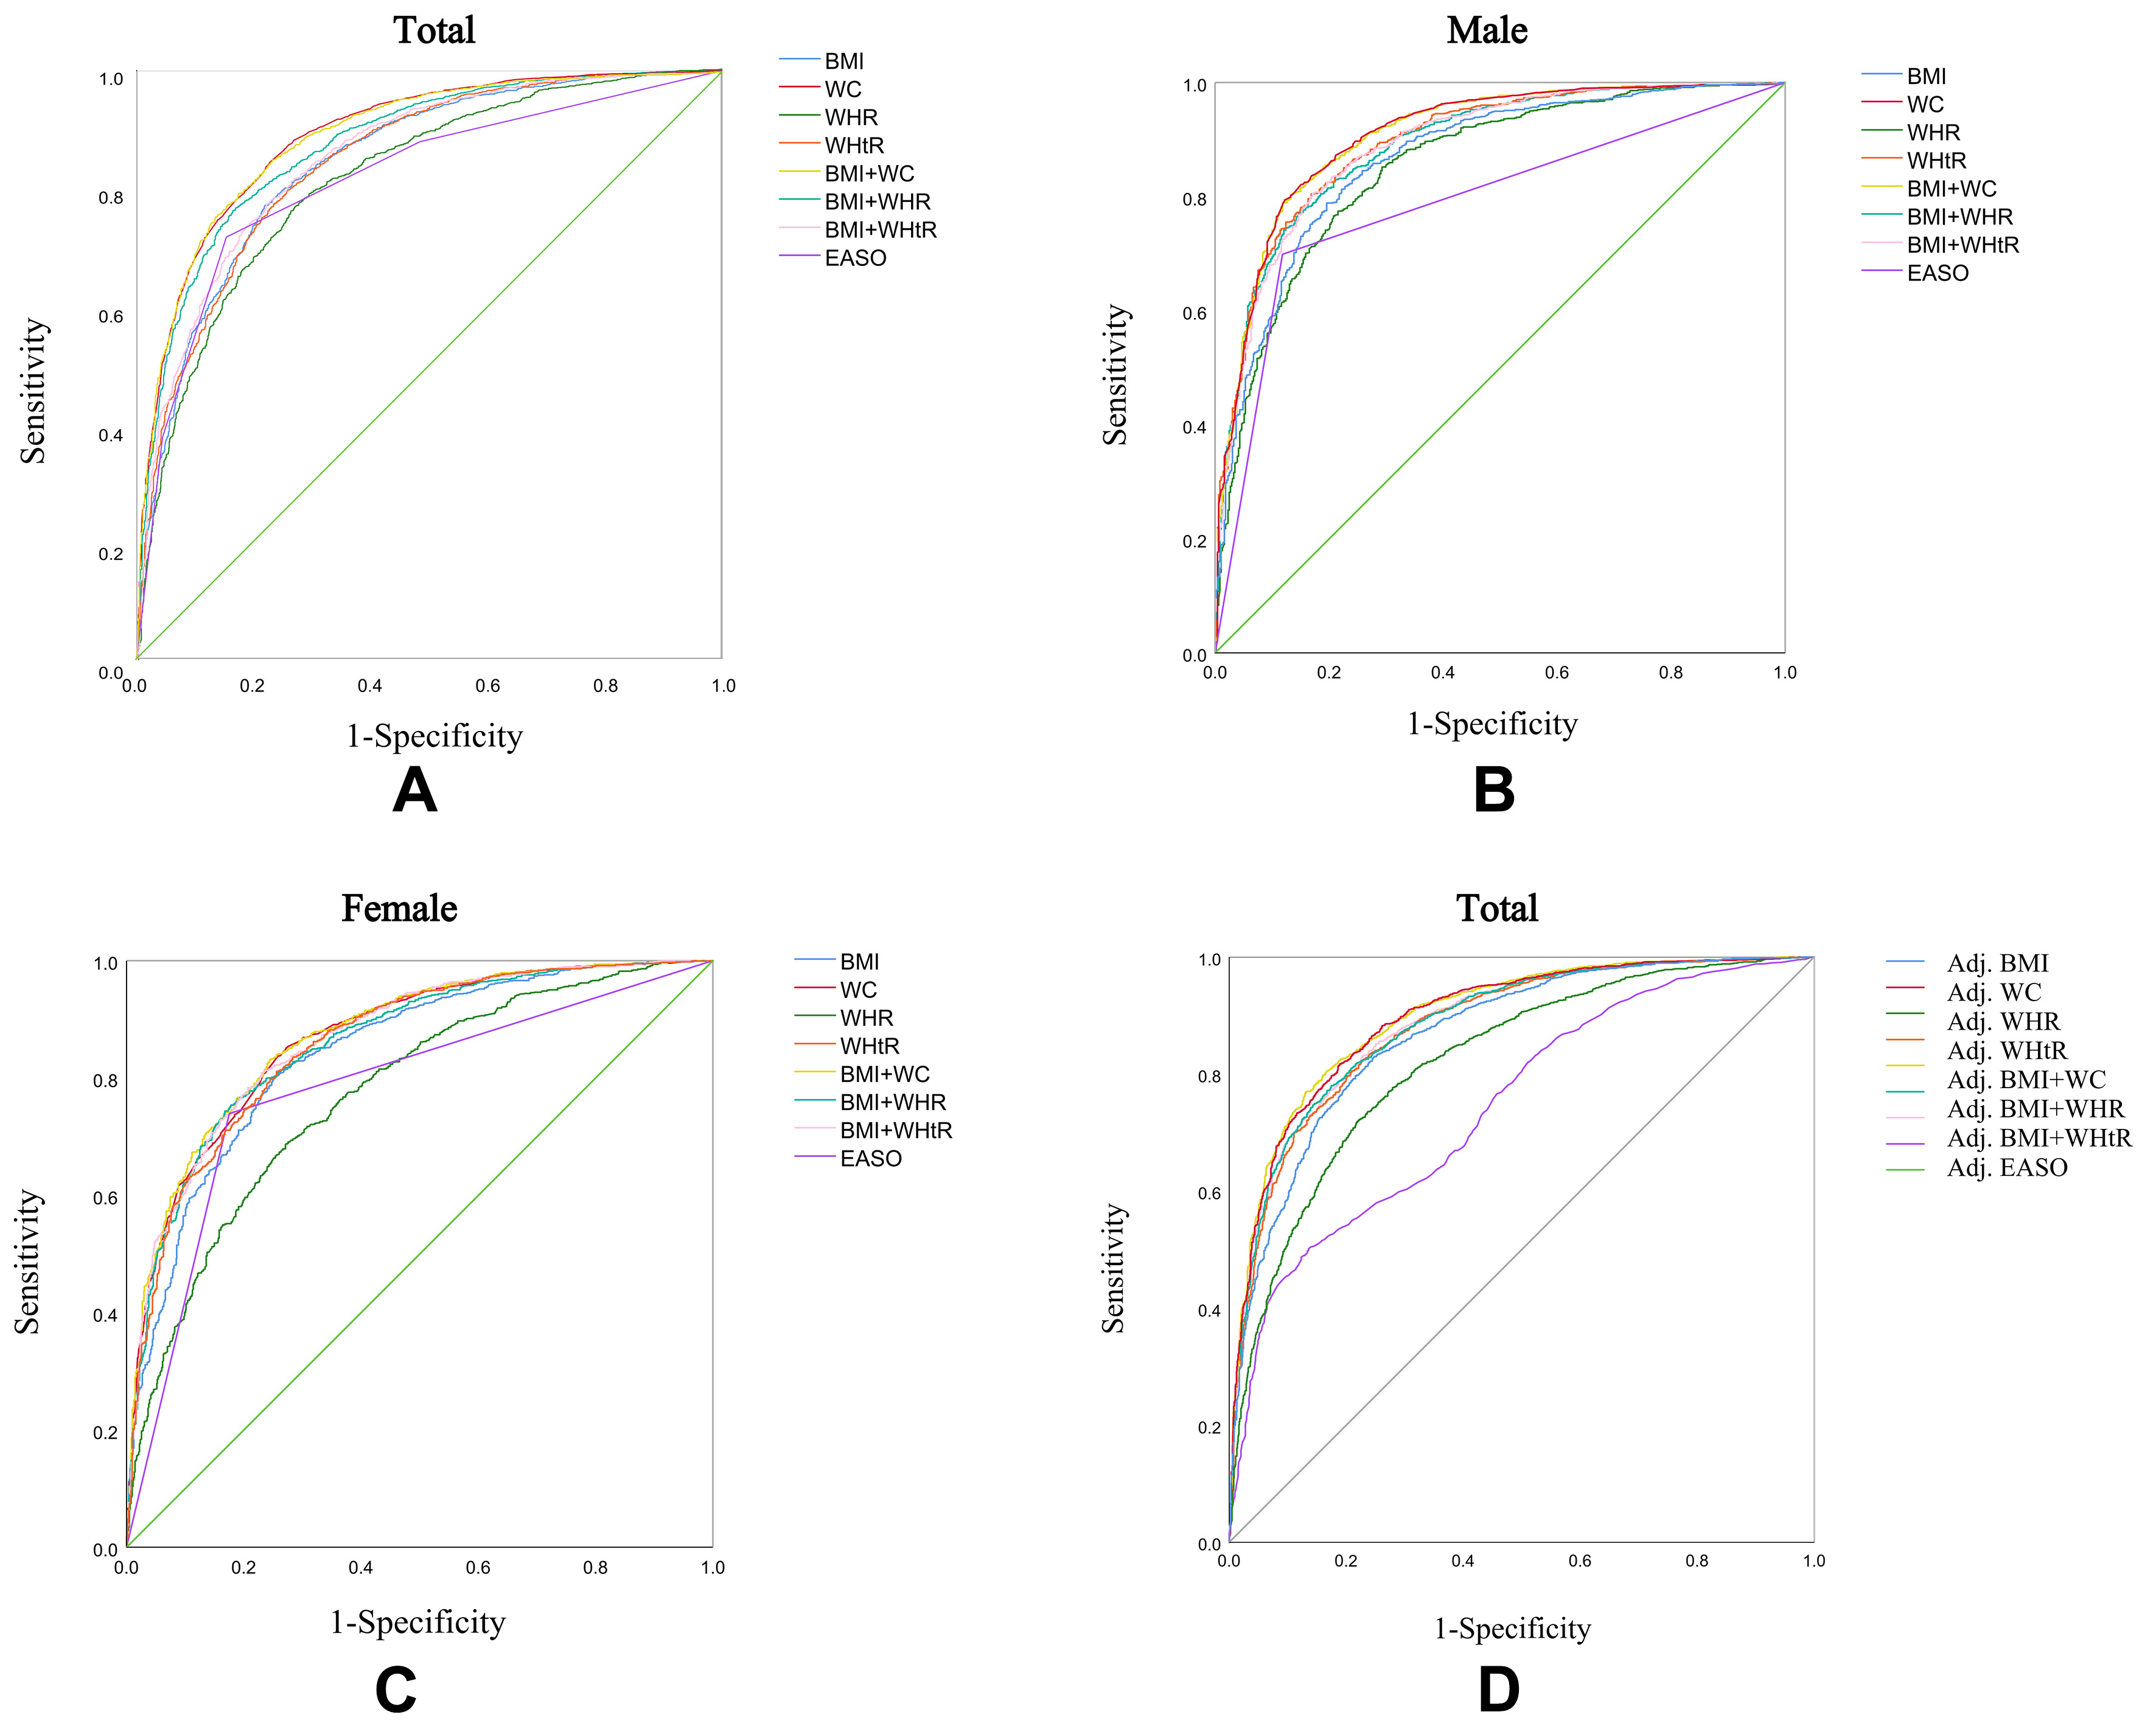
Figure 6. ROC curves for anthropometric measurements and the EASO obesity criteria against visceral fat area. Total population (A), males (B), and females (C). Adjusted ROC curves generated using the predicted probabilities derived from logistic regression models including age and sex as covariates (D). EASO: European Association for the Study of Obesity; ROC: receiver operating characteristic.
Sensitivity, specificity, and cut-off values for diagnosing visceral obesity using anthropometric indicators and the EASO criteria in males and females
| Sex | AUC (95%CI) | Sensitivity | Specificity | Cut-off | |
| BMI | 0.846 (0.833-0.859) | 0.768 | 0.783 | BMI = 25.25 kg/m2 | |
| WC | 0.889 (0.878-0.900) | 0.843 | 0.773 | WC = 85.05 cm | |
| WHR | 0.818 (0.803-0.832) | 0.760 | 0.738 | WHR = 0.89 | |
| WHtR | 0.847 (0.833-0.860) | 0.795 | 0.744 | WHtR = 0.53 | |
| BMI + WC | 0.890 (0.879-0.901) | 0.774 | 0.845 | BMI ≥ 25.25 kg/m2, WC ≥ 85.05 cm | |
| BMI + WHR | 0.874 (0.862-0.886) | 0.766 | 0.830 | BMI ≥ 25.25 kg/m2, WHR ≥ 0.89 | |
| BMI + WHtR | 0.859 (0.846-0.871) | 0.774 | 0.781 | BMI ≥ 25.25kg/m2, WHtR ≥ 0.53 | |
| EASO | 0.817 (0.802-0.831) | 0.717 | 0.846 | ||
| Male | BMI | 0.868 (0.849-0.887) | 0.789 | 0.805 | BMI = 24.82 kg/m2 |
| WC | 0.907 (0.891-0.923) | 0.794 | 0.878 | WC = 87.65 cm | |
| WHR | 0.854 (0.834-0.874) | 0.852 | 0.707 | WHR = 0.89 | |
| WHtR | 0.896 (0.879-0.912) | 0.805 | 0.831 | WHtR = 0.52 | |
| BMI + WC | 0.907 (0.890-0.923) | 0.789 | 0.882 | BMI ≥ 24.82 kg/m2, WC ≥ 87.65 cm | |
| BMI + WHR | 0.891 (0.874-0.908) | 0.772 | 0.854 | BMI ≥ 24.82 kg/m2, WHR ≥ 0.89 | |
| BMI + WHtR | 0.891 (0.873-0.908) | 0.806 | 0.829 | BMI ≥ 24.82 kg/m2, WHtR ≥ 0.52 | |
| EASO | 0.790 (0.767-0.814) | 0.699 | 0.882 | ||
| Female | BMI | 0.843 (0.825-0.861) | 0.803 | 0.748 | BMI = 25.26 kg/m2 |
| WC | 0.868 (0.851-0.884) | 0.837 | 0.743 | WC = 84.75 cm | |
| WHR | 0.774 (0.752-0.795) | 0.687 | 0.729 | WHR = 0.88 | |
| WHtR | 0.860 (0.843-0.877) | 0.811 | 0.744 | WHtR = 0.54 | |
| BMI + WC | 0.873 (0.856-0.889) | 0.832 | 0.755 | BMI ≥ 25.26 kg/m2, WC ≥ 84.75 cm | |
| BMI + WHR | 0.861 (0.844-0.878) | 0.754 | 0.822 | BMI ≥ 25.26 kg/m2, WHR ≥ 0.88 | |
| BMI + WHtR | 0.867 (0.850-0.883) | 0.809 | 0.770 | BMI ≥ 25.26 kg/m2, WHtR ≥ 0.54 | |
| EASO | 0.782 (0.760-0.804) | 0.739 | 0.825 |
DISCUSSION
We conducted a comprehensive analysis of the basic characteristics and abdominal CT scan results of 3,371 individuals from Pinggu District, Beijing, China. Our findings showed that compared to individuals with normal VFA, those with visceral obesity had a higher prevalence of obesity-related metabolic diseases, including pre-T2DM, T2DM, HTN, dyslipidaemia, and NAFLD. As the number of obesity-related metabolic diseases increased, VFA showed a significant upward trend, whereas the increase in SFA was more gradual, and the increase in TFA was mainly attributed to VFA. These findings are consistent with those of previous studies[4,5,13,23]. Our study further confirmed that visceral fat accumulation is a major risk factor for obesity-related metabolic disorders[24]. Visceral fat not only reflects the overall risk of obesity but also provides in-depth insights into the functional impairments of specific organs (such as the liver, heart, and pancreas) caused by obesity. During the progression to clinical obesity, the accumulation of visceral fat often indicates the impairment of organ function. Therefore, the measurement of visceral fat can assist in a more accurate evaluation of the impact of obesity on organ function and is an important indicator for the diagnosis and management of clinical obesity.
This study linked obesity-related metabolic diseases with visceral fat and aimed to identify metabolically unhealthy individuals with excess visceral fat using simple anthropometric indicators. The goal was to provide early tailored care for patients with obesity based on their specific health conditions. The EASO incorporated the WHtR into the obesity diagnostic criteria, shifting the focus to fat distribution. Although discrepancies exist between the emerging diagnostic frameworks proposed by the EASO and the Lancet Commission, these criteria demonstrate complementary rather than contradictory approaches. Both reflect the scientific community’s critical reappraisal of the limitations of BMI, seeking to establish a multidimensional characterisation of obesity through composite evaluation metrics. This paradigm shift underscores that obesity should be conceptualised not as a singular issue of weight management but rather as a complex syndrome requiring holistic assessment of metabolic health and systemic physiological functions.
To the best of our knowledge, this study is the first to compare the applicability of the new EASO criteria with a single anthropometric measurement in identifying visceral obesity in the Chinese population. The EASO criteria demonstrated a significantly higher diagnostic sensitivity (71.7%) than that of the BMI measurement alone (21.5%). However, its specificity was slightly lower than that of BMI (84.6% vs. 98.5%), suggesting that it may have overestimated the diagnostic rate of visceral obesity. This phenomenon may be due to differences in body fat distribution characteristics between the Chinese and European populations. Even at lower BMI levels, individuals in the Chinese population may accumulate abdominal fat[25]. Additionally, within the “overweight” range, a significant proportion of individuals classified as having visceral obesity under the BMI-based criteria suggests that BMI may underestimate the obesity risk in individuals with excessive visceral fat, potentially hindering the early detection and intervention of obesity-related metabolic diseases. The application of the new EASO criteria is more effective in identifying obesity associated with health impairments, rather than obesity without such consequences.
Directly using the new EASO criteria or BMI alone may not be sufficient for identifying visceral obesity. Although BMI can serve as a reasonable screening tool to identify potential patients with obesity, other measures beyond BMI are needed for clinical evaluation to reduce the risk of misclassification. However, the diagnostic thresholds of the new EASO criteria may not apply to the Chinese population. To address this, we explored other anthropometric indices, and their new cut-off values were tailored to the Chinese population. Individuals with visceral obesity had higher BMI, WC, WHtR, and WHR than did those with normal VFA, suggesting that these anthropometric indicators may help identify visceral obesity. Existing studies have also shown that WC, WHtR, and WHR can identify a high body fat percentage and predict increased VFA[26-29]. Our findings showed that, regardless of the total population or sex stratification, VFA showed the strongest correlation with WC. The ROC curve analysis showed that, regardless of the total population or sex stratification, VFA showed the strongest correlation with WC. Across both men and women, the combination of BMI and WC consistently showed the highest diagnostic performance for visceral obesity. This finding underscores the complementary value of combining general and central obesity measures. Notably, the incremental benefit of adding WC to BMI was mainly reflected in improved specificity - that is, a better ability to correctly identify individuals without visceral obesity. While sensitivity remained similar across BMI, WC, and their combination, the true negative rate improved and the false positive rate declined when both indices were used together, enhancing clinical accuracy and minimizing unnecessary follow-up. Interestingly, among men, WHtR alone demonstrated a slightly higher AUC than the combination of BMI and WHtR, possibly because WHtR already captures key aspects of central adiposity and was not adjusted for age in the sex-stratified analysis. However, in the total population with age and sex adjustment, BMI + WHtR outperformed WHtR alone, underscoring the importance of considering demographic covariates when evaluating diagnostic accuracy. Our findings further reveal potential variations in optimal indicator combinations and diagnostic thresholds across sexes and ethnicities. Combining obesity indicators that reflect visceral fat, including WC, WHR, and WHtR, with BMI for obesity diagnosis can not only mitigate misclassification risks but also enhance the precision of preliminary screening. This combined approach demonstrates efficacy for the early detection of high-risk populations, enabling timely clinical interventions.
Limitations
This study had some limitations. First, it was conducted at a single centre, with participants predominantly recruited from Pinggu District, Beijing. This geographical restriction may limit the generalisability of our findings to broader Chinese populations or other ethnic groups. Future research should employ multicentre study designs that encompass diverse regions, ethnicities, and populations to enhance representativeness and external validity. Second, anthropometric indicators were conducted by trained staff teams, but only a single measurement was recorded per participant, and formal inter- or intra-rater reliability assessments were not performed. This may introduce some measurement variability. Similarly, abdominal fat area quantification by CT imaging was performed by a single trained assessor using standardized protocols. Although validated image analysis techniques and HU thresholds were applied, the absence of repeated measurements or multiple assessors precluded formal reliability evaluation. Future studies should incorporate repeated and blinded measurements to improve measurement consistency and reliability. Third, SFA was not measured directly but calculated by subtracting VFA from TFA. This indirect method may underestimate SFA due to individual variability, and direct segmentation was limited by software constraints. More advanced imaging techniques are warranted for precise fat distribution assessment. Finally, diagnoses of HTN and CHD were based on self-reported medical history, which may lead to recall bias and disease misclassification. Objective clinical verification should be considered in future studies. Despite these limitations, our study provides important evidence on visceral fat accumulation and metabolic disease risk in a large Chinese population. Beyond validating the applicability of the EASO criteria, we further propose a set of anthropometric indicators - such as the combination of BMI and WC - that are better suited for identifying visceral obesity in Chinese adults. These simple and cost-effective tools demonstrated strong correlations with VFA and related metabolic abnormalities, highlighting their potential for widespread use in clinical and public health settings. Our findings support the development of population-specific diagnostic strategies for obesity-related health risks in East Asian populations.
In conclusion, this study demonstrated that increased VFA is associated with obesity-related metabolic diseases. Compared to traditional obesity diagnostic criteria (BMI), the new EASO criteria more effectively identify visceral fat deposition in the Han Chinese population. Moreover, WC exhibits the strongest correlation with VFA, and the combination of BMI and WC provides a simple and effective tool for diagnosing visceral obesity in the Chinese population.
DECLARATIONS
Acknowledgements
The authors thank all the research staff, physicians, and nurses in Peking University People’s Hospital and Capital Medical University Pinggu Teaching Hospital who participated in this work.
Authors’ contributions
Writing of the first draft of the report: Yang B
Providing input to the first draft of the report: Luo Y
Involved in the design of the research proposal: Luo Y, Ji L
Made substantial contributions to the acquisition of research data: Zhou X, Li Y
Processed the data and calculated the fat area: Zhang F
All authors added to the study plan and contributed intellectually to this study.
All authors had access to the data and take full responsibility for the integrity of the research.
All authors collectively made the decision to submit the manuscript for publication.
Availability of data and materials
The data that support the findings were used under license for the current study and are therefore not publicly available. The data will be made available upon a reasonable formal written request to the corresponding author.
Financial support and sponsorship
This work was supported by the grants (No. 2023ZD0508500, 2023ZD0508504) from the National Science and Technology Innovation 2030, Noncommunicable Chronic Diseases-National Science and Technology Major Project.
Conflicts of interest
All authors declared that there are no conflicts of interest.
Ethical approval and consent to participate
The study protocol was approved by the Ethics Committee of Peking University Medical Center (2025PHB226-001). Written informed consent was provided by all participants.
Consent for publication
Not applicable.
Copyright
© The Author(s) 2025.
Supplementary Materials
REFERENCES
1. Ralston MR, McCreath G, Lees ZJ, et al. Beyond body mass index: exploring the role of visceral adipose tissue in intensive care unit outcomes. BJA Open. 2025;14:100391.
2. Goossens GH. The metabolic phenotype in obesity: fat mass, body fat distribution, and adipose tissue function. Obes Facts. 2017;10:207-15.
3. Nielsen S, Guo Z, Johnson CM, Hensrud DD, Jensen MD. Splanchnic lipolysis in human obesity. J Clin Invest. 2004;113:1582-8.
4. Emamat H, Jamshidi A, Farhadi A, Ghalandari H, Ghasemi M, Tangestani H. The association between the visceral to subcutaneous abdominal fat ratio and the risk of cardiovascular diseases: a systematic review. BMC Public Health. 2024;24:1827.
5. Cheng C, Yu X, Shi K, et al. Associations between abdominal obesity indices with hypertension in type 2 diabetes mellitus: Chinese visceral adiposity index. J Endocrinol Invest. 2024;47:547-55.
6. Silveira EA, Kliemann N, Noll M, Sarrafzadegan N, de Oliveira C. Visceral obesity and incident cancer and cardiovascular disease: an integrative review of the epidemiological evidence. Obes Rev. 2021;22:e13088.
7. Fang H, Berg E, Cheng X, Shen W. How to best assess abdominal obesity. Curr Opin Clin Nutr Metab Care. 2018;21:360-5.
8. Kong M, Xu M, Zhou Y, et al. Assessing visceral obesity and abdominal adipose tissue distribution in healthy populations based on computed tomography: a large multicenter cross-sectional study. Front Nutr. 2022;9:871697.
9. Busetto L, Dicker D, Frühbeck G, et al. A new framework for the diagnosis, staging and management of obesity in adults. Nat Med. 2024;30:2395-9.
10. Yusuf S, Hawken S, Ounpuu S, et al; INTERHEART Study Investigators. Obesity and the risk of myocardial infarction in 27,000 participants from 52 countries: a case-control study. Lancet. 2005;366:1640-9.
11. Ashwell M, Gibson S. Waist to height ratio is a simple and effective obesity screening tool for cardiovascular risk factors: analysis of data from the British National Diet And Nutrition Survey of adults aged 19-64 years. Obes Facts. 2009;2:97-103.
12. Rubino F, Cummings DE, Eckel RH, et al. Definition and diagnostic criteria of clinical obesity. Lancet Diabetes Endocrinol. 2025;13:221-62.
13. Zhou X, Li Y, Zhang X, et al. Independent markers of nonalcoholic fatty liver disease in a gentrifying population-based Chinese cohort. Diabetes Metab Res Rev. 2019;35:e3156.
14. Zhang F, Li Y, Zhao Y, Zhou X, Ji L. Is visceral abdominal fat area a better indicator for hyperglycemic risk? J Diabetes Investig. 2020;11:888-95.
15. Examination Committee of Criteria for ‘Obesity Disease’ in Japan; Japan Society for the Study of Obesity. New criteria for ‘obesity disease’ in Japan. Circ J. 2002;66:987-92.
16. Zheng J, Hu Y, Xu H, et al. Normal-weight visceral obesity promotes a higher 10-year atherosclerotic cardiovascular disease risk in patients with type 2 diabetes mellitus-a multicenter study in China. Cardiovasc Diabetol. 2023;22:137.
17. Li X, Katashima M, Yasumasu T, Li KJ. Visceral fat area, waist circumference and metabolic risk factors in abdominally obese Chinese adults. Biomed Environ Sci. 2012;25:141-8.
18. Grundy SM, Cleeman JI, Daniels SR, et al; American Heart Association, National Heart, Lung, and Blood Institute. Diagnosis and management of the metabolic syndrome: an American Heart Association/National Heart, Lung, and Blood Institute scientific statement. Circulation. 2005;112:2735-52.
19. Lu Y, Zhang H, Lu J, et al; China Patient-Centered Evaluative Assessment of Cardiac Events Million Persons Project Collaborative Group. Prevalence of dyslipidemia and availability of lipid-lowering medications among primary health care settings in China. JAMA Netw Open. 2021;4:e2127573.
20. Atef HM, Korayem EM, Ahmed NA, Houseni MM, El-refaie AM, Gomaa MI. Assessment of hepatic steatosis of potential living donor before liver transplantation using liver/spleen CT attenuation ratio compared to liver biopsy. Egypt J Radiol Nucl Med. 2023;54:1165.
21. Speliotes EK, Massaro JM, Hoffmann U, et al. Liver fat is reproducibly measured using computed tomography in the Framingham heart study. J Gastroenterol Hepatol. 2008;23:894-9.
22. Iwasaki M, Takada Y, Hayashi M, et al. Noninvasive evaluation of graft steatosis in living donor liver transplantation. Transplantation. 2004;78:1501-5.
23. Liu L, Feng J, Zhang G, et al. Visceral adipose tissue is more strongly associated with insulin resistance than subcutaneous adipose tissue in Chinese subjects with pre-diabetes. Curr Med Res Opin. 2018;34:123-9.
24. Lee YH, Park J, Min S, Kang O, Kwon H, Oh SW. Impact of visceral obesity on the risk of incident metabolic syndrome in metabolically healthy normal weight and overweight groups: a longitudinal cohort study in Korea. Korean J Fam Med. 2020;41:229-36.
25. Lear SA, Humphries KH, Kohli S, Chockalingam A, Frohlich JJ, Birmingham CL. Visceral adipose tissue accumulation differs according to ethnic background: results of the Multicultural Community Health Assessment Trial (M-CHAT). Am J Clin Nutr. 2007;86:353-9.
26. Gadekar T, Dudeja P, Basu I, Vashisht S, Mukherji S. Correlation of visceral body fat with waist-hip ratio, waist circumference and body mass index in healthy adults: a cross sectional study. Med J Armed Forces India. 2020;76:41-6.
27. Parente EB, Mutter S, Harjutsalo V, Ahola AJ, Forsblom C, Groop PH. Waist-height ratio and waist are the best estimators of visceral fat in type 1 diabetes. Sci Rep. 2020;10:18575.
28. Tuglo LS. Comparison of adiposity anthropometric indices and their associations with visceral fat levels determined by bioelectrical impedance analysis among diabetic patients. Sci Rep. 2022;12:17824.
Cite This Article
How to Cite
Download Citation
Export Citation File:
Type of Import
Tips on Downloading Citation
Citation Manager File Format
Type of Import
Direct Import: When the Direct Import option is selected (the default state), a dialogue box will give you the option to Save or Open the downloaded citation data. Choosing Open will either launch your citation manager or give you a choice of applications with which to use the metadata. The Save option saves the file locally for later use.
Indirect Import: When the Indirect Import option is selected, the metadata is displayed and may be copied and pasted as needed.
About This Article
Special Issue
Copyright

Data & Comments
Data
0


Comments
Comments must be written in English. Spam, offensive content, impersonation, and private information will not be permitted. If any comment is reported and identified as inappropriate content by OAE staff, the comment will be removed without notice. If you have any queries or need any help, please contact us at [email protected].