


fig5
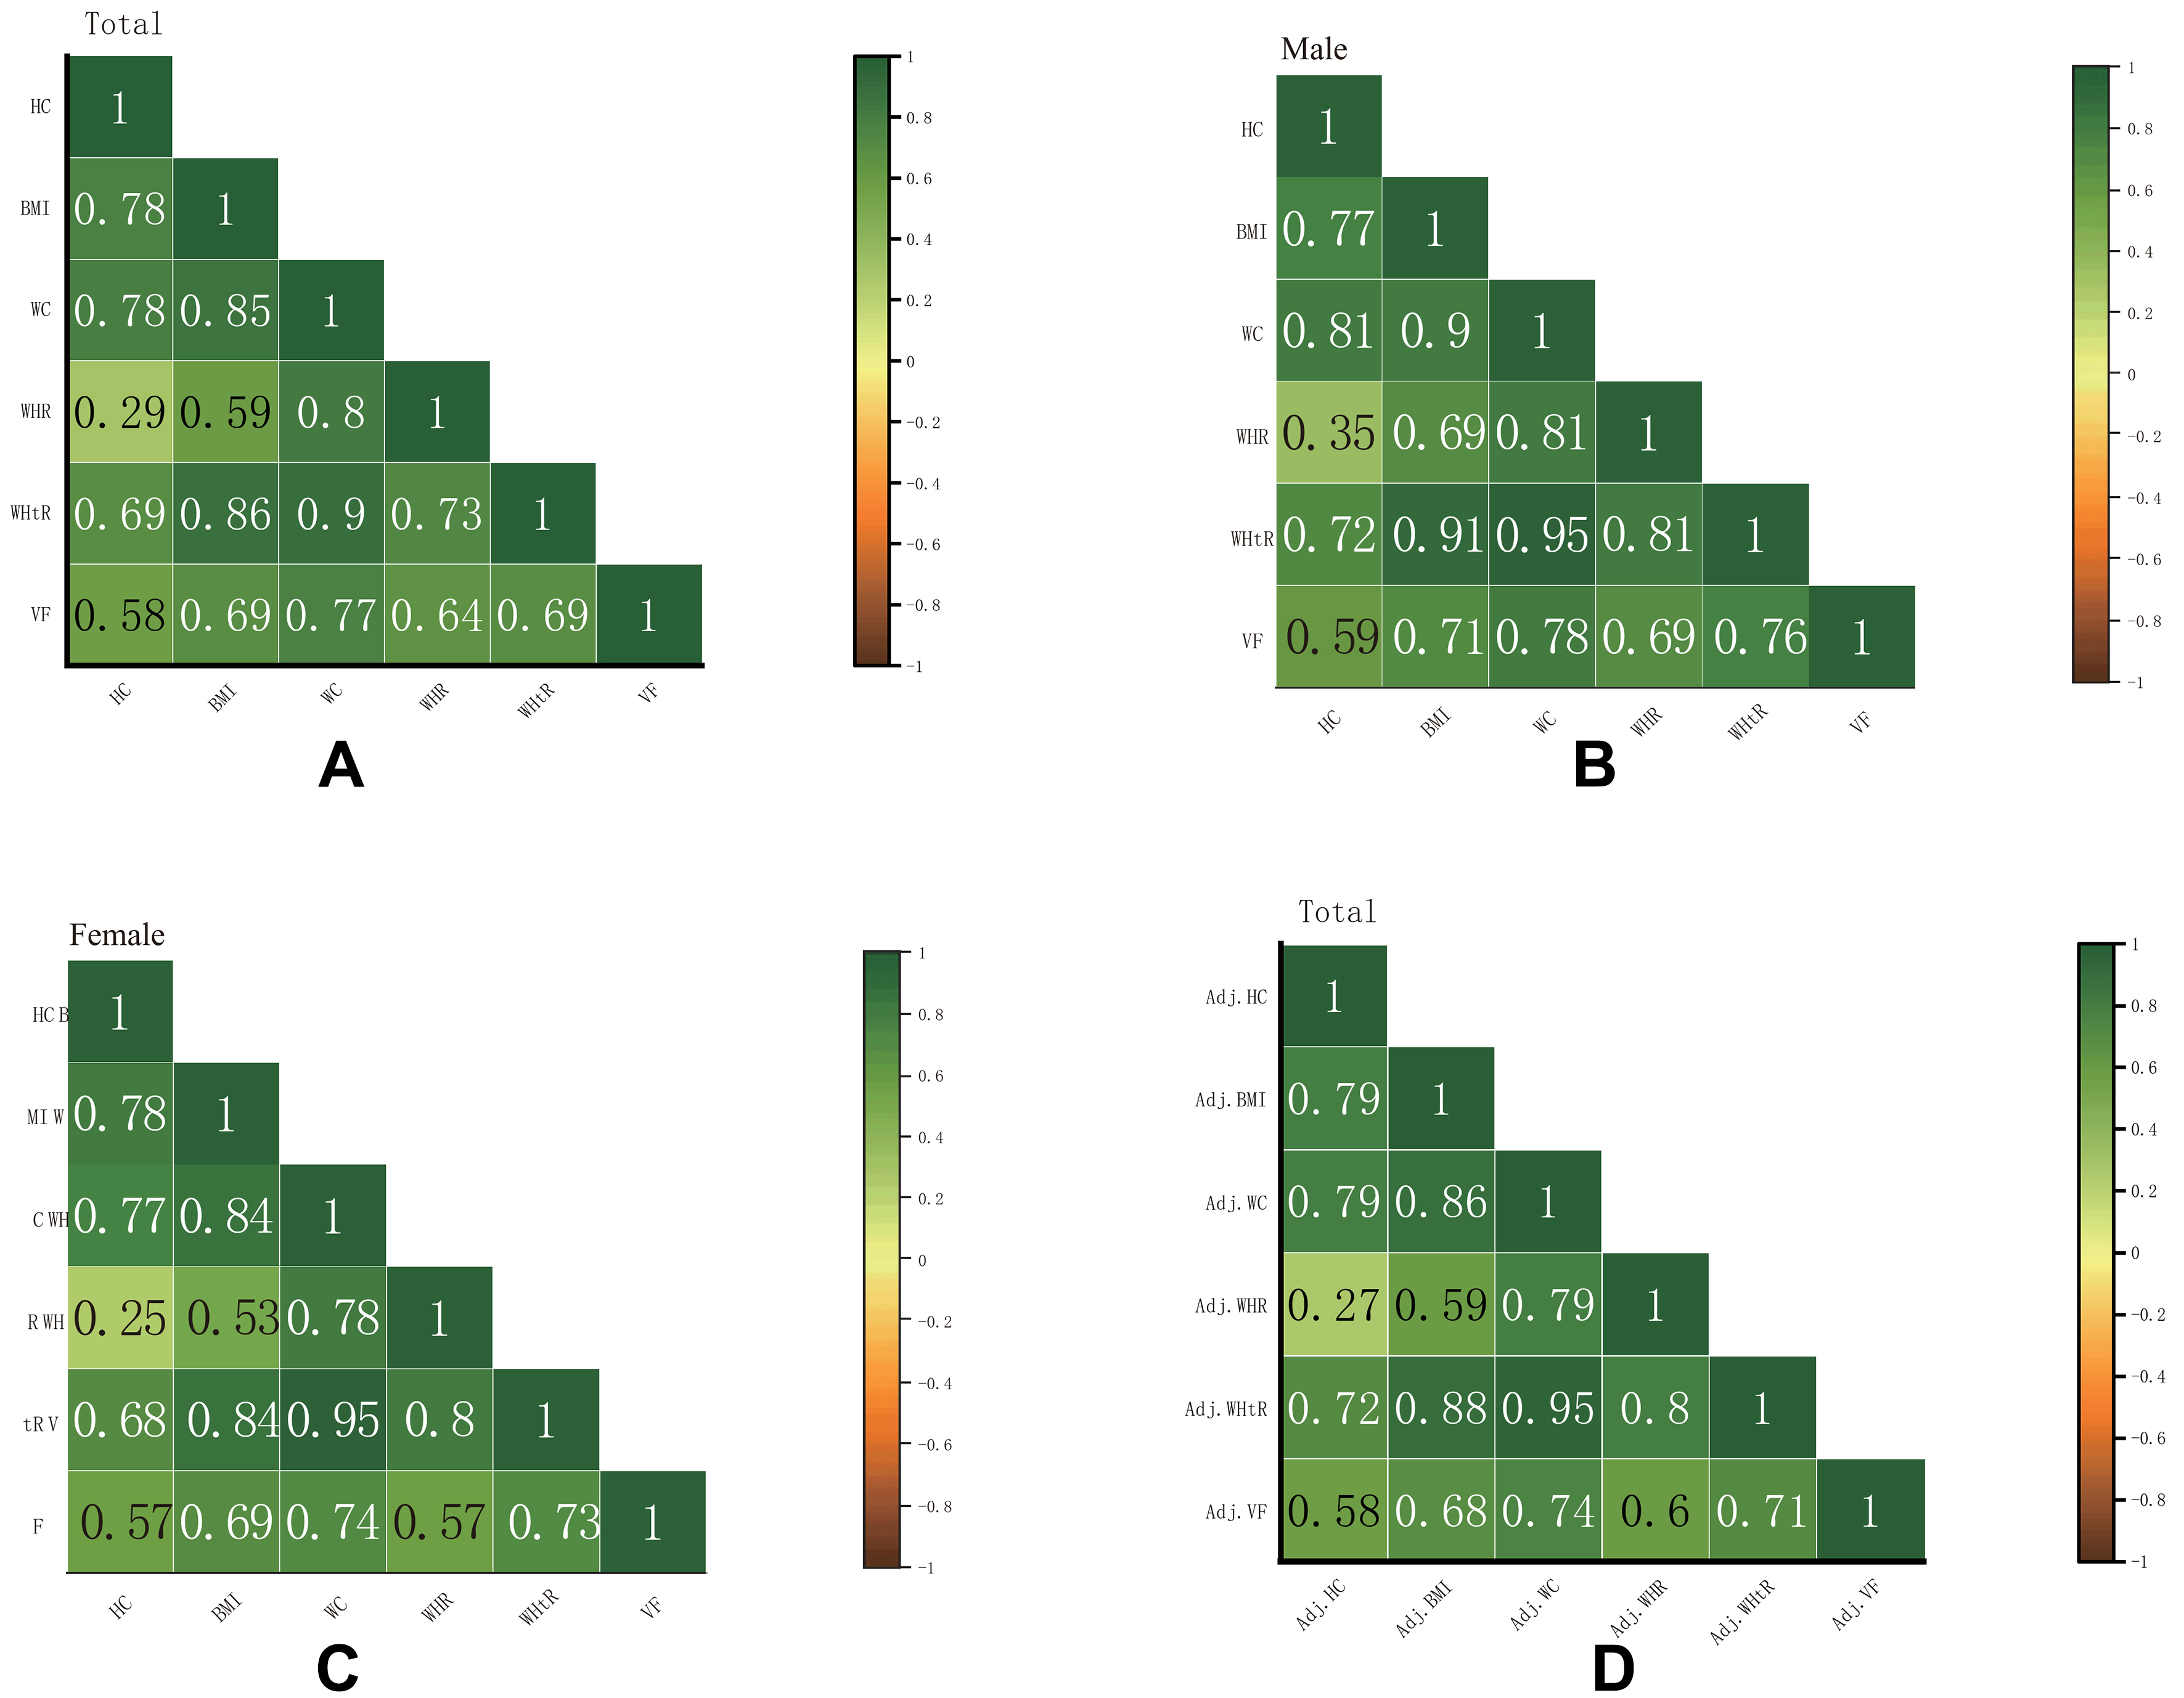
Figure 5. Correlation heatmap of anthropometric indicators with visceral fat area. Total population (A), males (B), and females (C). The numbers refer to the pairwise Spearman’s correlation coefficients. Partial correlation heatmap adjusted for age and sex in the total population (D).


