


fig6
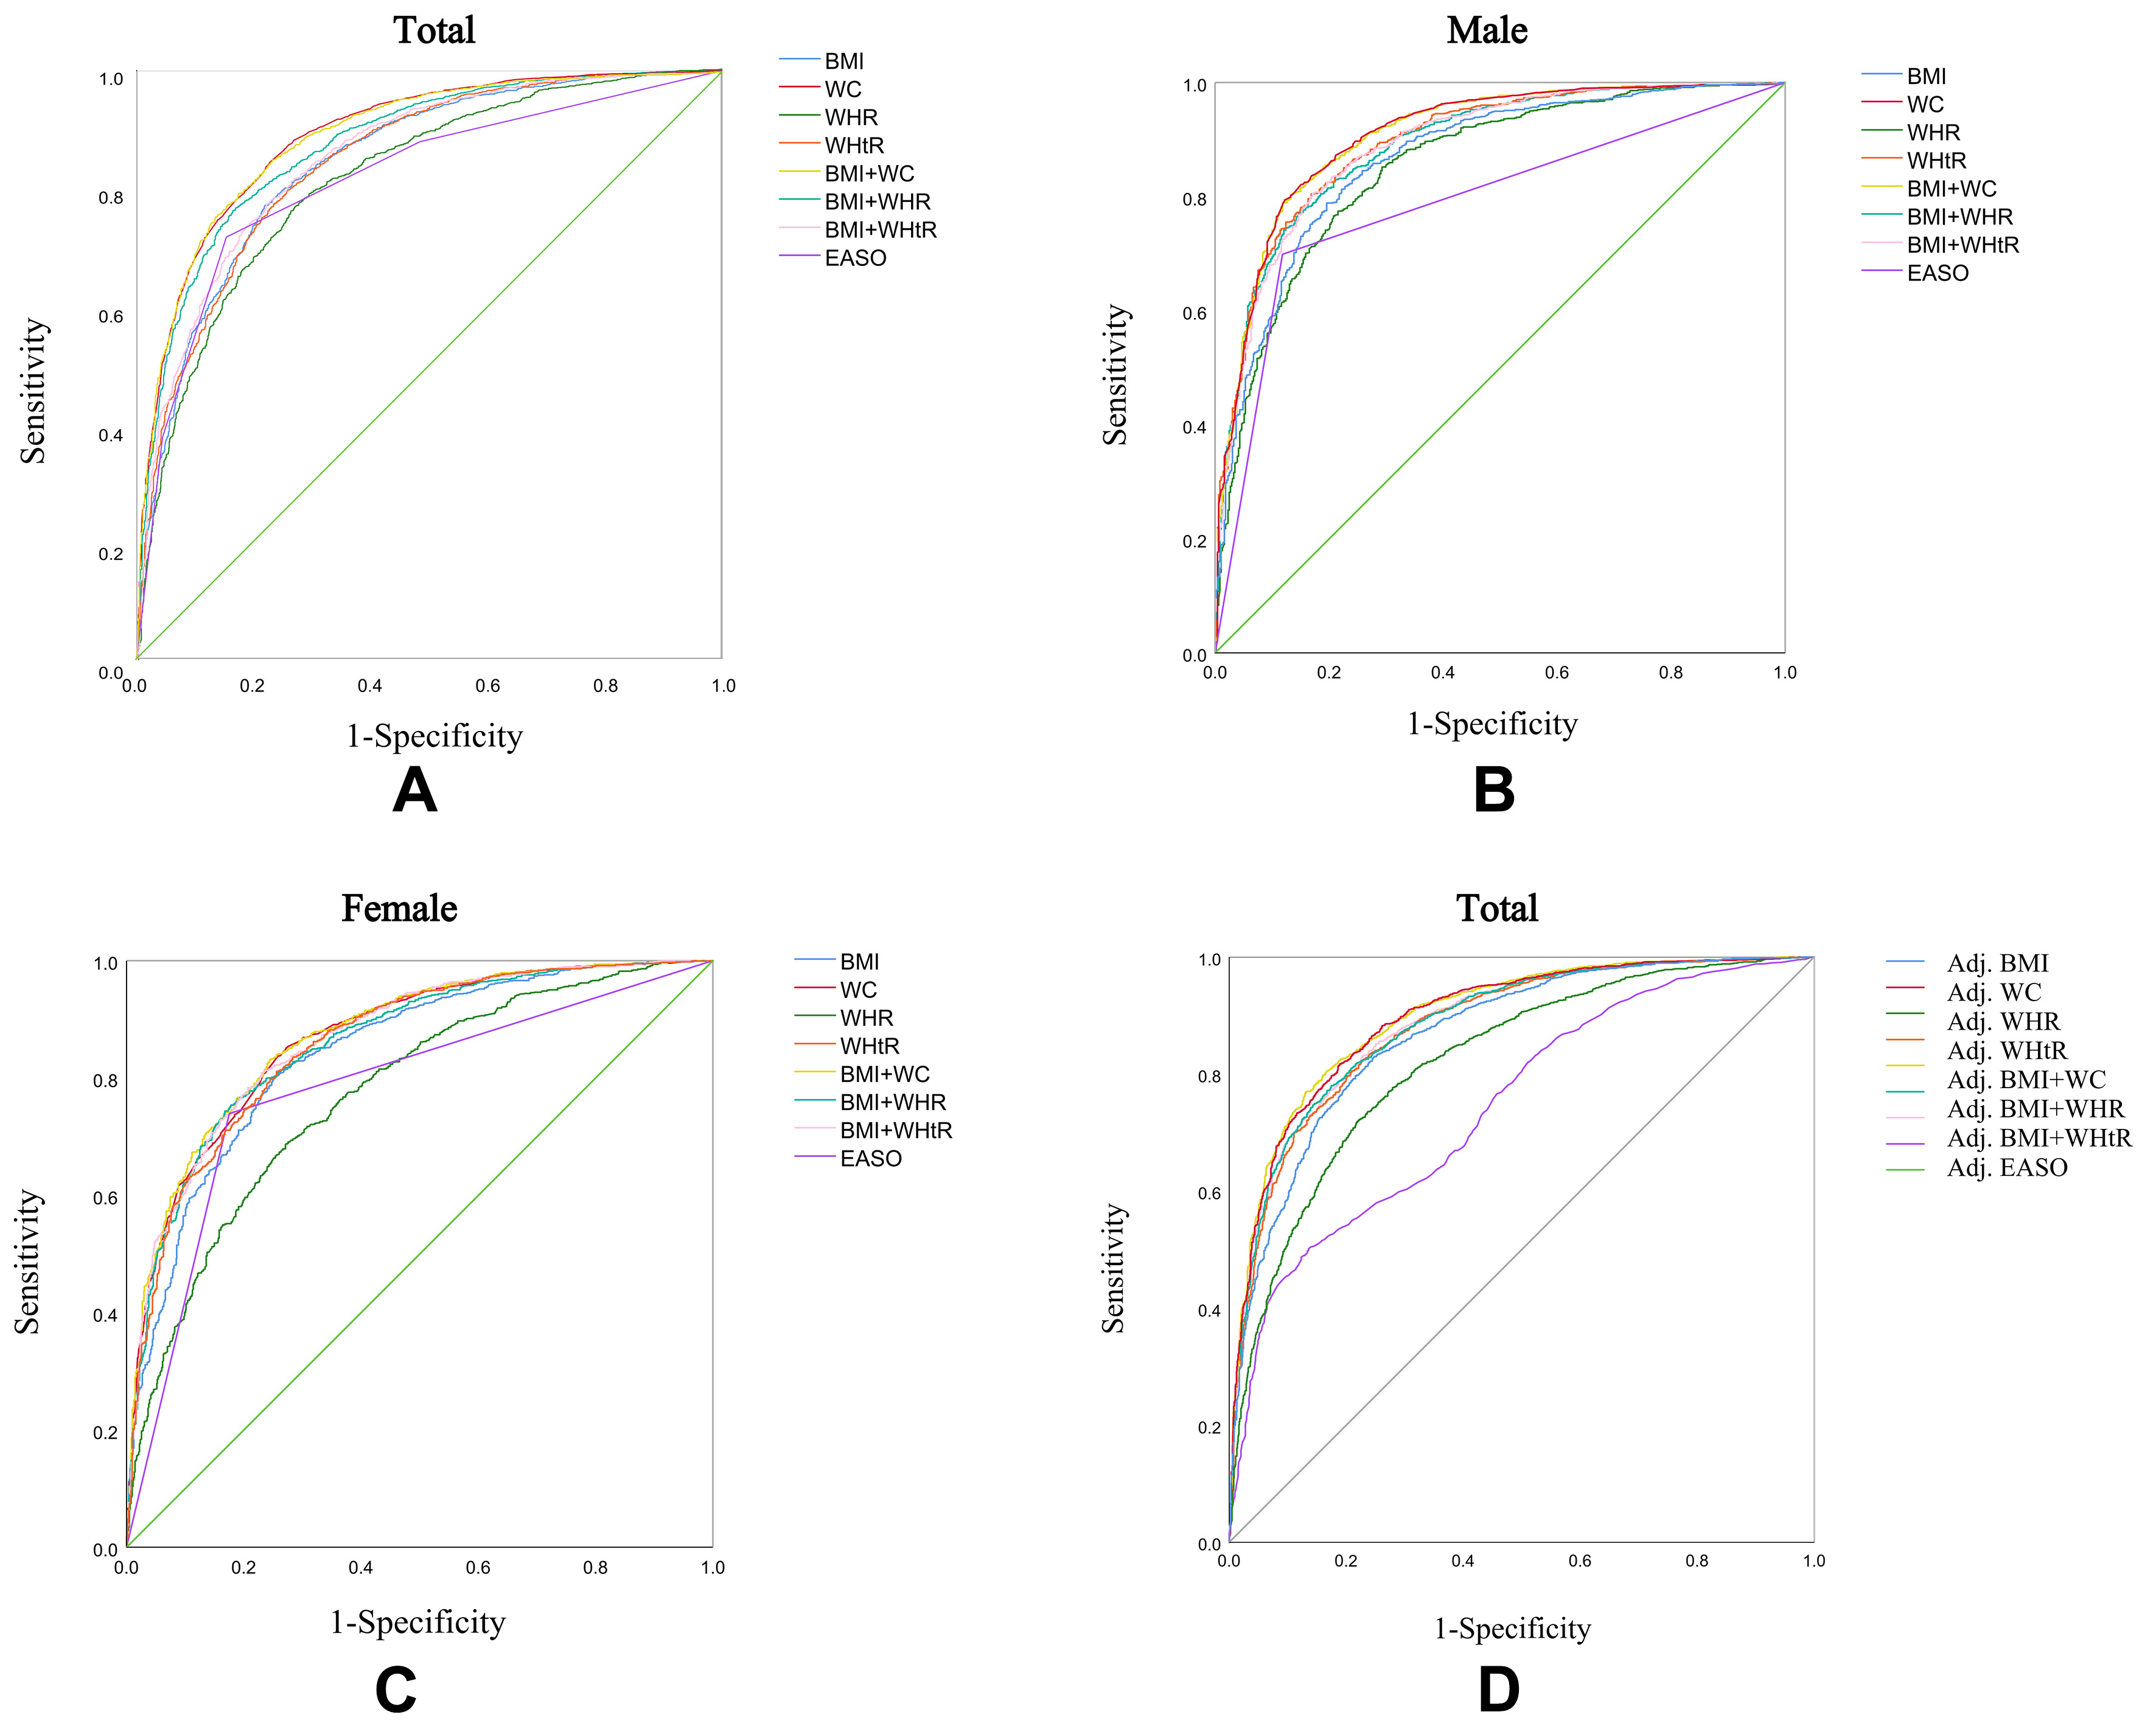
Figure 6. ROC curves for anthropometric measurements and the EASO obesity criteria against visceral fat area. Total population (A), males (B), and females (C). Adjusted ROC curves generated using the predicted probabilities derived from logistic regression models including age and sex as covariates (D). EASO: European Association for the Study of Obesity; ROC: receiver operating characteristic.


