


Accelerated biological aging drives the progression from MASLD to cirrhosis
 0
0 
Abstract
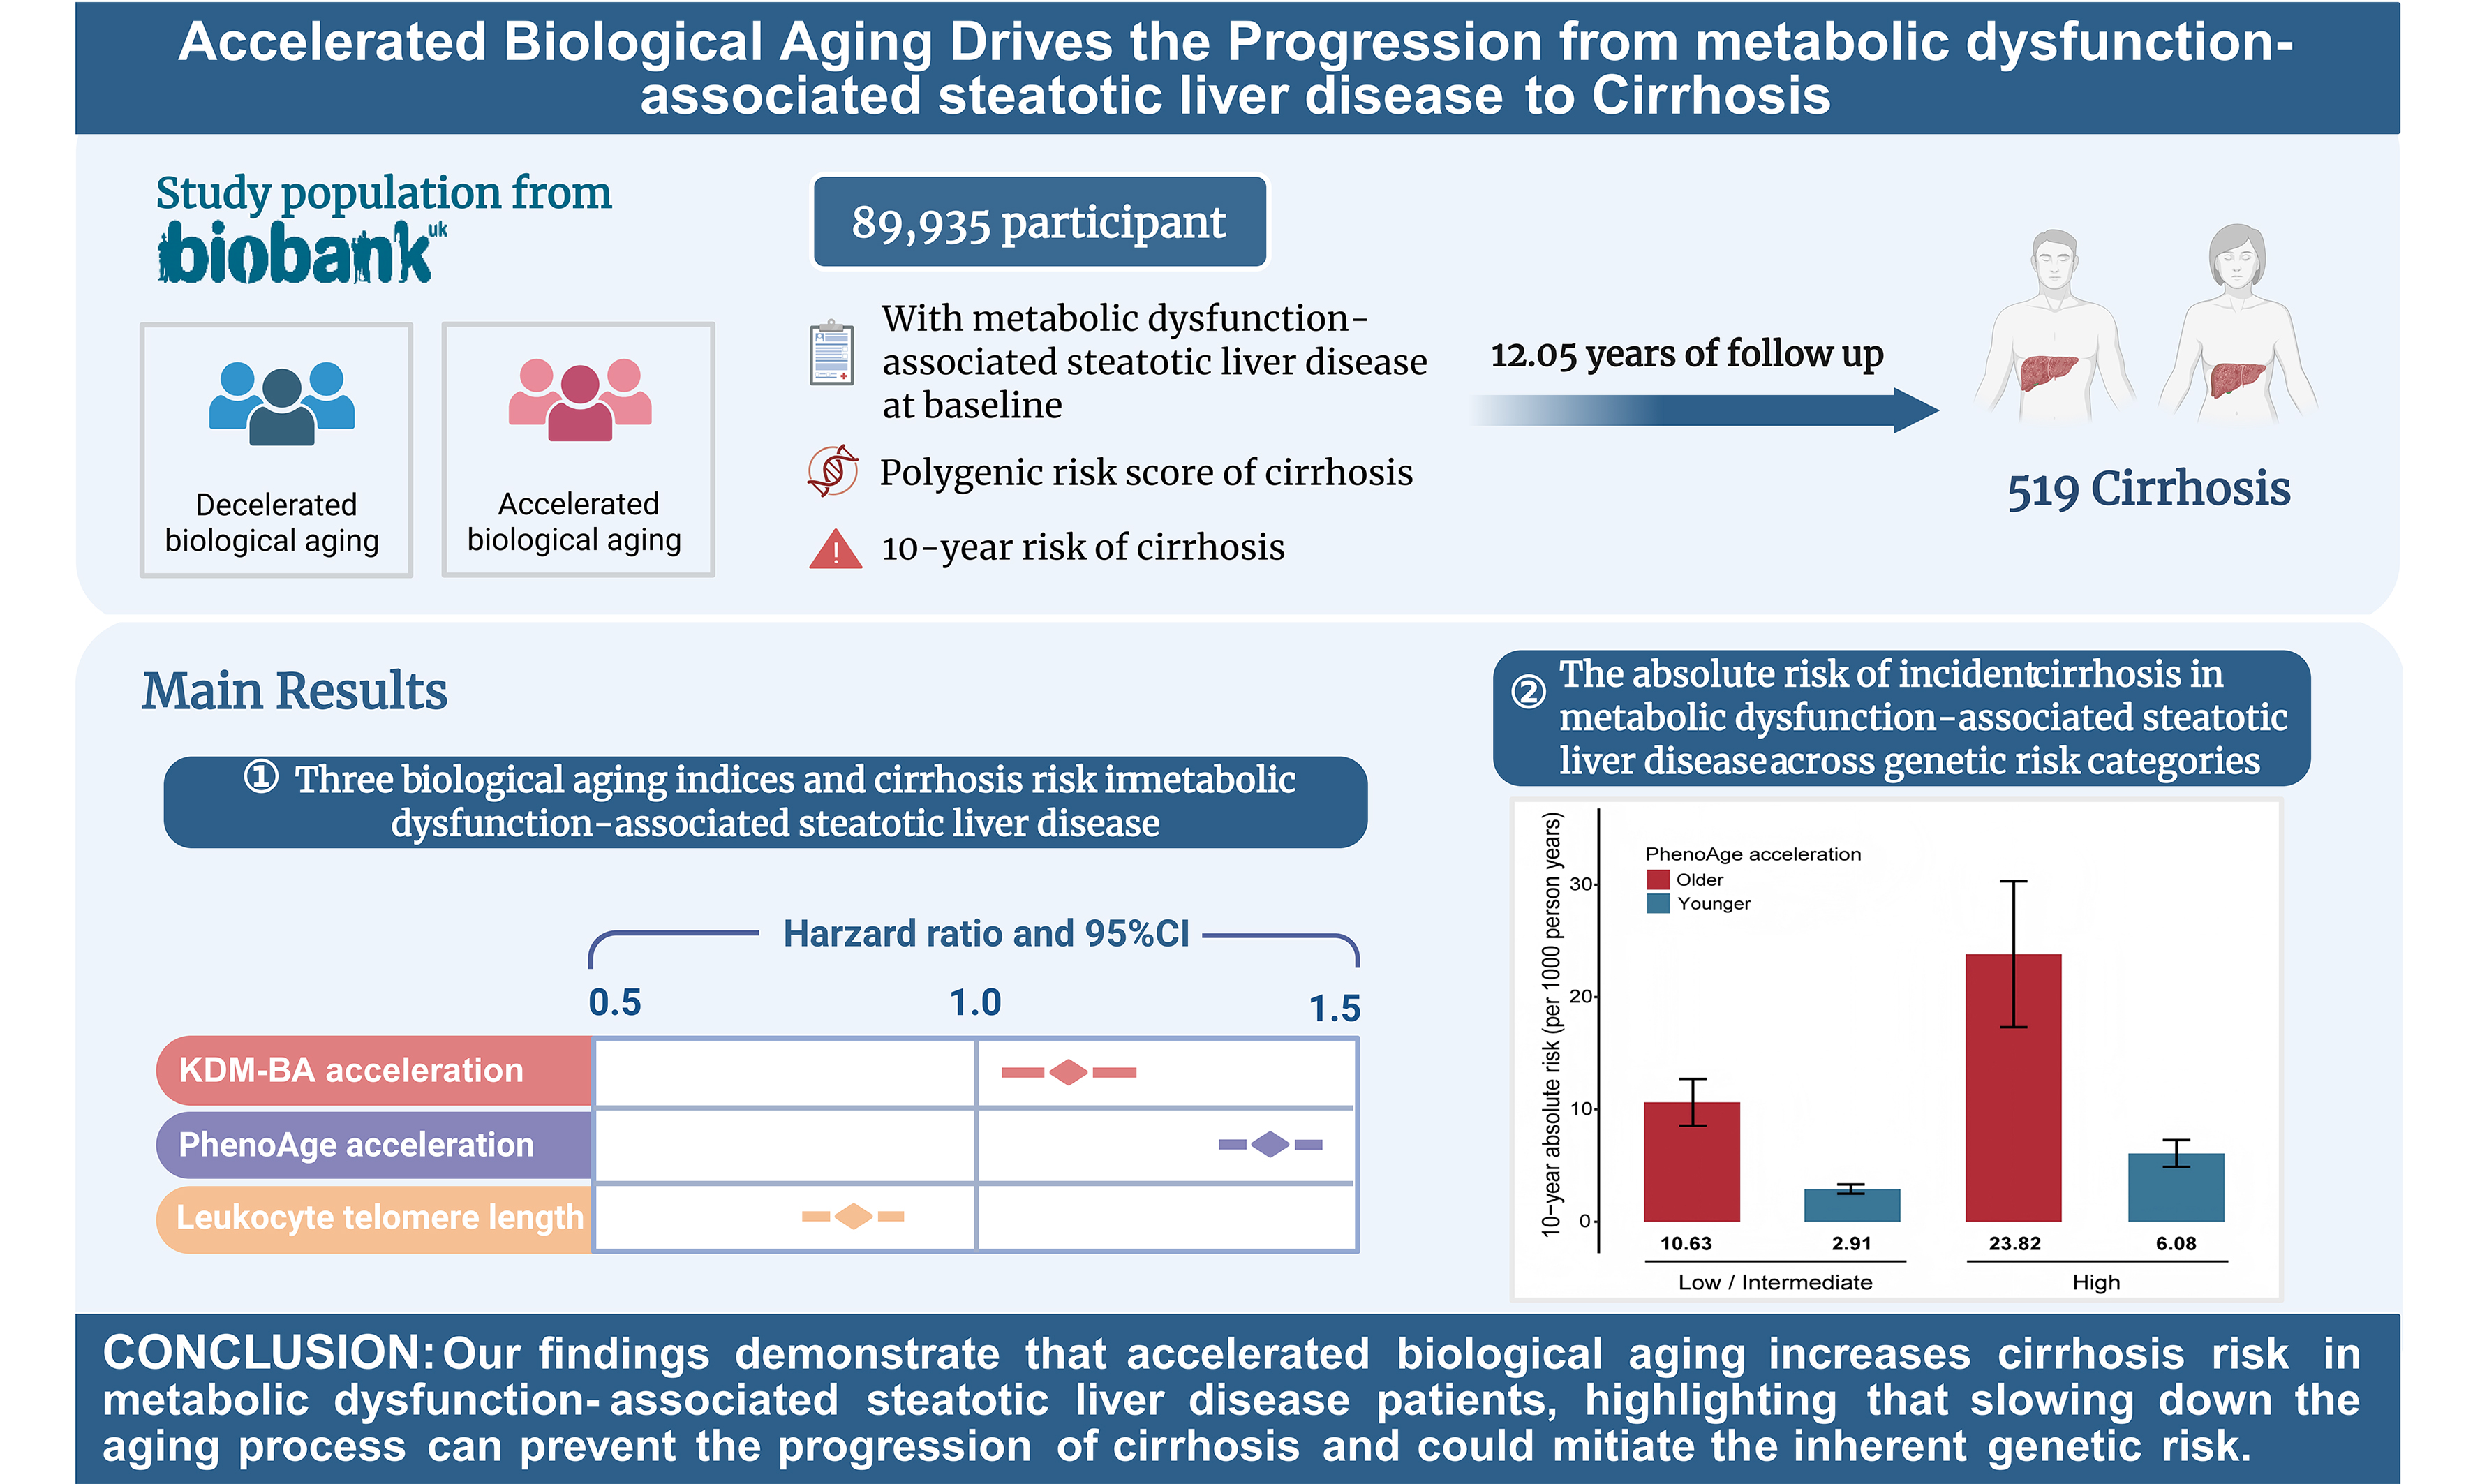
Aim: Although the association between biological age (BA) and liver dysfunction is well-established, epidemiological evidence on the relationship between BA acceleration and cirrhosis risk in individuals with metabolic dysfunction-associated steatotic liver disease (MASLD) remains limited.
Methods: This study included 89,935 individuals with MASLD from the UK Biobank. We used Klemera-Doubal method-BA (KDM-BA), phenotypic age (PhenoAge) and leukocyte telomere length (LTL) as BA indicators. Twelve genetic variants were used to construct polygenic risk scores (PRS). Multivariable Cox proportional hazards models were employed to calculate hazard ratios (HRs) and 95% confidence intervals (CIs) for cirrhosis incidence.
Results: During a median follow-up of 12.05 years, 519 individuals developed cirrhosis. Acceleration in PhenoAge and KDM-BA was associated with a 39% (HR 1.39, 95%CI: 1.32-1.47) and 12% (HR 1.12, 95%CI: 1.03-1.22) higher risk of incident cirrhosis, respectively. Longer LTL was associated with a lower risk of cirrhosis (HR 0.84, 95%CI: 0.77-0.91). Participants with the greatest BA acceleration and highest PRS exhibited the highest risk of cirrhosis. Additionally, participants at a high genetic risk level had the greatest 10-year absolute risk reduction of cirrhosis (17.74 per 1,000 person-years) if their PhenoAge acceleration decreased.
Conclusion: Our findings demonstrate that alleviating biological aging in individuals with MASLD is important for preventing cirrhosis and could mitigate the adverse effects of high genetic risk.
Keywords
INTRODUCTION
Metabolic dysfunction-associated steatotic liver disease (MASLD) has become a major global public health concern, affecting over 30% of the world’s population[1,2], and is a key driver of progression to steatohepatitis, fibrosis, cirrhosis, and hepatocellular carcinoma[3]. Cirrhosis currently accounts for approximately 1.16 million deaths worldwide each year[4]. Epidemiological projections indicate that by 2040, MASLD will be the leading contributor to the increasing burden of cirrhosis[5]. Therefore, accurately identifying individuals at high risk of progressive cirrhosis and implementing routine dynamic monitoring remain critical challenges.
It is well established that aging, as a complex biological process, induces pathological changes in the liver and accelerates the progression of end-stage liver disease[6-8]. While chronological age (CA) is a major risk factor for most diseases, considerable heterogeneity exists among individuals. Recently, biological age (BA), which reflects physiological and functional status, has been considered a more informative measure than CA[9,10]. Notably, Nie et al. evaluated BA across multiple organs using multi-omics features and found that liver BA exhibited the greatest deviation from CA, suggesting a potential role in driving liver dysfunction[11].
In recent decades, multiple indicators have been used to assess BA, including telomere length, clinical biomarkers, and epigenetic clocks[10,12]. For instance, a longitudinal study showed that shortened telomere length was significantly associated with a 1.39-fold increased risk of liver fibrosis and cirrhosis[13]. Similarly, epigenetic age acceleration, based on DNA methylation signatures, has been observed in patients with metabolic dysfunction-associated steatohepatitis (MASH) compared with healthy controls[14]. Among these indicators, BA measures based on clinical biomarkers show the greatest potential for large-scale liver health monitoring due to their ease of acquisition. However, evidence regarding the association between BA acceleration and cirrhosis risk in patients with MASLD remains limited. Moreover, the role of BA in modulating the effect of genetic susceptibility on the risk of cirrhosis remains unclear.
This large-scale cohort study used two clinically quantified biomarker indicators [Klemera-Doubal method-BA (KDM-BA) and phenotypic age (PhenoAge)], as well as leukocyte telomere length (LTL), to systematically investigate the association between BA acceleration and the risk of cirrhosis in individuals with MASLD. In addition, the potential interaction and joint effects of BA acceleration and genetic susceptibility on the occurrence of cirrhosis were evaluated.
METHODS
The UK Biobank is an ongoing large-scale prospective cohort study that enrolled over 500,000 participants aged 37-73 years between 2006 and 2010, with continuous follow-up. Participants’ lifestyle, health information, and biological samples were collected at baseline. Detailed methods of data collection have been described previously[15]. The UK Biobank study was approved by the North West Multicenter Research Ethics Committee, Manchester, UK (reference no. 21/NW/0157), and all participants provided written informed consent.
Given the limited availability of imaging and histological data for the liver, we used the Fatty Liver Index (FLI) - a well-validated, non-invasive surrogate marker - as the primary diagnostic criterion for MASLD to assess hepatic steatosis severity[16]. The diagnostic performance of FLI has been established in previous studies[17,18]. Participants were classified as having MASLD if they had an FLI > 60 along with at least one of the following metabolic abnormalities: (1) overweight or obesity; (2) type 2 diabetes; (3) hypertension; (4) elevated triglycerides; or (5) reduced high-density lipoprotein cholesterol levels. Individuals meeting any of the following criteria at baseline were excluded: (1) excessive alcohol consumption; (2) diagnosis of other chronic liver diseases (diagnostic codes are detailed in Supplementary Table 1); (3) aspartate transaminase or alanine aminotransferase levels > 500 U/L; or (4) use of medications that elevate lipid levels. The FLI calculation and other diagnostic criteria are given in Supplementary Table 2. This resulted in 122,867 eligible MASLD participants.
Subsequently, from this MASLD cohort, participants were excluded if they met any of the following criteria: (1) withdrawal from the UK Biobank; (2) missing data required for calculating BA (n = 14,895) or LTL (n = 4,031); (3) lack of genetic data for polygenic risk score (PRS) calculation (n = 294); or (4) missing other covariates (n = 13,663). Ultimately, 89,935 participants remained for the preliminary analysis. The inclusion and exclusion process is illustrated in Supplementary Figure 1.
Calculation of PRS
Details of the genotyping process, arrays, and quality control in the UK Biobank have been described previously[15]. Briefly, participant genotyping was performed using the Affymetrix UK BiLEVE Axiom or UK Biobank Axiom arrays. Based on 12 single nucleotide polymorphisms (SNPs) closely related to cirrhosis, we constructed a weighted PRS [Supplementary Table 3][19], as given in
where M represents the total number of SNPs, SNPj represents the genotypic value of the j-th single nucleotide polymorphism (SNP), and βj denotes the coefficient for SNPj associated with cirrhosis, which is acquired from the previous studies. Nagelkerke’s pseudo R2 test was applied to measure the phenotypic variance of cirrhosis explained by this PRS[20], where R2 represents the coefficient of determination. Participants were categorized into three genetic risk groups based on PRS tertiles: low (lowest quintile), intermediate (second- to fourth-quintile), and high (highest quintile).
Assessment of BA indicators
The study applied three BA indicators to depict the degree of individual aging: KDM-BA, PhenoAga and LTL. Both KDM-BA and PhenoAge were trained using the National Health and Nutrition Examination Survey (NHANES) data but rely on different algorithms and clinical biomarker inputs[21-23]. Based on regression analyses of nine individual biomarkers against CA, KDM-BA was calculated using:
where x represents the measured value of biomarker i for an individual. For each biomarker i, parameters k (regression intercept), q (slope), and s (root mean squared error) were estimated from a regression of CA on the biomarker in the reference sample. The scaling factor (SBA) equals the square root of the variance in CA explained by the biomarker set.
PhenoAge was derived from a mortality risk-based algorithm using multivariate analysis:
Where
γ = 0.0076927
xb = -19.907 - 0.0336 + albumin + 0.0095 × creatinine + 0.1953 × glucose
+0.0954 × ln (C - reactive protein)
-0.012 × lymphocyte percentage
+0.0268 × mean corpuscular volume
+0.3306 × red cell distribution width
+0.00188 × alkaline phosphatase
+0.0554 × white blood cell count + 0.0804 × chronological age
More detailed algorithm descriptions about KDM-BA and PhenoAge, and the corresponding R code are available in the R package “BioAge” (https://github.com/dayoonkwon/BioAge) and related publications[24,25]. To quantify differences between participants’ CA and BA, we performed a regression analysis of BA values based on CA, with the residuals from this regression referred to as age acceleration[26].
Telomeres are DNA-protein structures at the ends of linear chromosomes and have been proposed as biomarkers of the biological aging (BA) process because they shorten with each cell division[27,28]. Peripheral blood leukocyte DNA was extracted from the baseline blood samples of the participants, and the ratio of telomere repeat copy number (T) to single-copy gene (S) measured by multiplex quantitative polymerase chain reaction was quantified as LTL[29,30]. To adjust for technical parameters and normalize the data distribution, Z-score standardization was applied to the log-transformed LTL measurements (T/S ratio).
Assessment of cirrhosis
Outcome events were defined according to the 10th edition of the International Classification of Diseases (ICD-10) and ascertained via electronic linkage to inpatient admission registries in England, Wales, and Scotland. Cirrhosis was defined using the following codes[19]: K70.2 (alcoholic fibrosis and cirrhosis), K70.3 (alcoholic cirrhosis), K70.4 (alcoholic liver failure), K74.0 (hepatic fibrosis), K74.1 (cirrhosis), K74.2 (hepatic fibrosis with cirrhosis), K74.6 (other nonspecific cirrhosis), K76.6 (portal hypertension), I85.0 (esophageal varices with bleeding), and I85.9 (esophageal varices without bleeding). This coding schema integrates cirrhosis definitions from five distinct cohorts and has been validated against liver biopsy reports, ensuring high reliability. Follow-up time was defined as the period from recruitment until the first occurrence of diagnosis, loss to follow-up, death, or censoring, whichever came first.
Evaluation of covariates
To control for potential confounders, two multivariable-adjusted models were constructed. Model 1 adjusted for age and sex. Model 2 further adjusted for ethnicity, Townsend Deprivation Index (TDI), body mass index (BMI), alcohol and smoking status, physical activity, and history of hypertension, diabetes, and heart disease. Age was calculated from birth date and baseline assessment. Sex (male, female) and ethnicity (white, non-white) were self-reported. TDI was derived from unemployment, overcrowding, non-car ownership, and non-home ownership, with higher values indicating greater deprivation. BMI (continuous) was calculated as weight (kg) divided by height squared (m2). Smoking and alcohol status were classified as never, former, or current. Physical activity was assessed in metabolic equivalent task (MET) minutes and categorized as low (≤ 600), moderate (600-3,000), or high (> 3,000)[31]. Hypertension, diabetes, and heart disease were physician-diagnosed at baseline.
Statistical analysis
Multivariable Cox proportional hazards models were used to estimate hazard ratios (HRs) and 95% confidence intervals (CIs). Restricted cubic spline (RCS) regressions, fitted within Cox models with three knots (5th, 50th, and 95th percentiles), were conducted to examine dose-response relationships between BA indicators and cirrhosis risk. P-values for trend were assessed by modeling categorical variables as continuous. The proportional hazards assumption was tested using Schoenfeld residuals. For joint analyses, the combined effects of BA indicators and PRS on cirrhosis risk were evaluated, with participants having the youngest BA and lowest PRS serving as the reference group.
To examine potential interactions between BA indicators and PRS, we calculated the relative excess risk due to interaction (RERI) and the attributable proportion of interaction (AP) to assess additive effects. The 95%CIs for RERI and AP were estimated using 5,000 bootstrap samples[32,33]. If the 95%CIs of RERI or AP include 0, no additive interaction is indicated. To facilitate interpretation of differences in 10-year cirrhosis incidence between groups, absolute risk reduction and corresponding 95%CIs were calculated from 1,000 bootstrap samples.
Several sensitivity analyses were performed to ensure the robustness of our findings: (1) exclusion of participants diagnosed with cirrhosis within the first, second, or third year of follow-up; (2) multiple imputation of missing covariate data using the chained equations method (“mice” package; all covariates < 1% missing); (3) additional adjustment for inflammatory markers (C-reactive protein) and self-reported overall health status.
All analyses were performed using R software (version 4.3.0). A two-sided P value < 0.05 was considered statistically significant.
RESULTS
Participants’ characteristics
The baseline characteristics of 89,935 participants in the UK Biobank cohort are manifested in Table 1. During 12.05 years of follow-up, 519 incident cases of cirrhosis were observed. In general, participants had a mean age of 57 ± 8 years, were 93.7% White, and 40.3% female. The distributions of BA and CA for all included participants are shown in Supplementary Figure 2. We observed that the individuals’ BA was consistently younger than their CA. Both KDM-BA acceleration and PhenoAge acceleration showed weak correlations with CA, with Pearson coefficients of -0.09 and 0.03, respectively, indicating that any potential bias introduced by the age distribution in calculating age acceleration is extremely small [Supplementary Figure 3].
Baseline characteristics of UK Biobank participants with MASLD stratified by disease status
| Characteristic | Total No. (n = 89,935) | No.of case (n = 519) | No.of non-case (n = 89,416) | P value |
| Age (years), mean (SD) | 57.19 (7.96) | 59.55 (7.27) | 57.18 (7.96) | < 0.001 |
| Sex (Female), n (%) | 36,213 (40.27) | 187 (36.03) | 36,026 (40.29) | 0.054 |
| Race (White), n (%) | 84,285 (93.72) | 497 (95.76) | 83,788 (93.71) | 0.067 |
| Townsend deprivation index, mean (SD) | -1.03 (3.21) | -0.40 (3.53) | -1.03 (3.20) | < 0.001 |
| Body mass index (BMI, kg/m2), mean (SD) | 31.65 (4.52) | 32.54 (5.41) | 31.65 (4.51) | < 0.001 |
| Smoking status, n (%) | ||||
| Never | 48,006 (53.38) | 225 (43.35) | 47,781 (53.44) | < 0.001 |
| Previous | 32,847 (36.52) | 213 (41.04) | 32,634 (36.50) | |
| Current | 9,082 (10.10) | 81 (15.61) | 9,001 (10.07) | |
| Alcohol consumption, n (%) | ||||
| Never | 5,242 (5.83) | 29 (5.59) | 5,213 (5.83) | 0.055 |
| Previous or current | 84,693 (94.17) | 490 (94.41) | 84,203 (94.17) | |
| Physical activity (MET-min/week), n (%) | ||||
| Low (MET: ≤ 600) | 22,568 (25.09) | 146 (28.13) | 22,422 (25.08) | 0.243 |
| Moderate (MET: 600-3,000) | 44,105 (49.04) | 249 (47.98) | 43,856 (49.05) | |
| High (MET: > 3,000) | 23,262 (25.87) | 124 (23.89) | 23,138 (25.88) | |
| Major diseases, n (%)a | ||||
| Diabetes | 9,164 (10.19) | 136 (26.2) | 9028 (10.1) | < 0.001 |
| Hypertension | 30,088 (33.46) | 212 (40.85) | 29,876 (33.41) | < 0.001 |
| Heart disease | 7,696 (8.56) | 86 (16.57) | 7,610 (8.51) | < 0.001 |
| BA indicators, mean (SD) | ||||
| KDM-BA | 55.54 (14.09) | 58.93 (14.98) | 55.52 (14.08) | < 0.001 |
| KDM-BA acceleration | -1.65 (12.36) | -0.62 (13.95) | -1.66 (12.35) | 0.057 |
| PhenoAge | 52.32 (9.38) | 57.80 (9.41) | 52.29 (9.37) | < 0.001 |
| PhenoAge acceleration | -4.87 (4.69) | -1.75 (6.18) | -4.89 (4.67) | < 0.001 |
| Leukocyte telomere length | 0.82 (0.13) | 0.79 (0.13) | 0.82 (0.13) | < 0.001 |
| Components of BAs, mean (SD) | ||||
| FEV1 (L)* | 2.83 (0.83) | 2.62 (0.74) | 2.84 (0.83) | < 0.001 |
| SBP (mm Hg)* | 143.62 (18.54) | 143.92 (19.90) | 143.62 (18.53) | 0.723 |
| Total cholesterol (mg/dL)* | 219.41 (47.43) | 200.46 (51.60) | 219.52 (47.38) | < 0.001 |
| Glycated hemoglobin (%)* | 5.65 (0.79) | 5.96 (1.12) | 5.65 (0.78) | < 0.001 |
| Blood urea nitrogen (mg/dL)* | 15.69 (4.08) | 15.69 (4.90) | 15.69 (4.08) | 0.966 |
| Lymphocyte (%)# | 28.91 (7.39) | 28.13 (7.86) | 28.92 (7.39) | 0.015 |
| Mean cell volume (fL)* | 81.51 (5.01) | 83.68 (6.26) | 81.50 (5.00) | < 0.001 |
| Serum glucose (mmol/L)* | 96.29 (29.30) | 108.80 (46.73) | 96.22 (29.15) | < 0.001 |
| Red cell distribution width (%)* | 13.54 (0.96) | 13.86 (1.18) | 13.54 (0.96) | < 0.001 |
| White blood cell count (1,000 cells/uL)# | 7.26 (2.41) | 6.57 (1.08) | 7.26 (2.42) | 0.224 |
| Albumin (g/dL)*# | 45.06 (2.64) | 44.22 (3.16) | 45.06 (2.63) | < 0.001 |
| Creatinine (umol/L)*# | 76.05 (18.26) | 75.93 (21.12) | 76.06 (18.24) | 0.872 |
| C-reactive protein (mg/dL)*# | 0.36 (0.47) | 0.47 (0.51) | 0.36 (0.47) | < 0.001 |
| Alkaline phosphatase (U/L)*# | 89.45 (27.83) | 112.48 (74.04) | 89.31 (27.27) | < 0.001 |
Compared to individuals without cirrhosis, those with cirrhosis were more likely to be male and had higher CA, lower TDI, higher BMI, greater tobacco exposure, and a higher prevalence of hypertension, heart disease, and diabetes.
BA acceleration with cirrhosis risk
As shown in Table 2, after adjusting for CA and other potential confounders, higher BA acceleration was associated with an increased risk of cirrhosis. Each 1 standard deviation (SD) increment in KDM-BA acceleration corresponded to a fully adjusted HR of 1.12 (95%CI: 1.03-1.22) for cirrhosis. For PhenoAge acceleration, each SD increase was associated with a 39% higher risk of cirrhosis (HR 1.39, 95%CI: 1.32-1.47). Compared to individuals in the lowest quartile of KDM-BA acceleration, those in the highest quartile had a 1.28-fold higher risk of cirrhosis (95%CI: 1.00-1.64). The HR for the highest quartile of PhenoAge acceleration, compared with the lowest quartile, was 3.10 for cirrhosis (95%CI: 2.31-4.15). As expected, LTL was inversely associated with the risk of cirrhosis, with longer LTL corresponding to a lower risk.
Biological age indicators and risk of cirrhosis among individuals with MASLD
| Exposures | No. of incident cases/total participants | Model 1 | Model 2 | ||
| HR (95%CI) | P value | HR (95%CI) | P value | ||
| KDM-BA accelerationa | 519/89,935 | 1.17 (1.07-1.27) | < 0.001 | 1.12 (1.03-1.22) | 0.007 |
| KDM-BA accelerationb | |||||
| Q1 | 131/22,484 | Reference | Reference | ||
| Q2 | 120/22,484 | 1.01 (0.78-1.29) | 0.964 | 1.02 (0.80-1.31) | 0.853 |
| Q3 | 118/22,483 | 1.04 (0.81-1.34) | 0.767 | 1.03 (0.80-1.33) | 0.790 |
| Q4 | 150/22,484 | 1.38 (1.08-1.76) | 0.009 | 1.28 (1.00-1.64) | 0.047 |
| PhenoAge accelerationa | 519/89,935 | 1.49 (1.42-1.56) | < 0.001 | 1.39 (1.32-1.47) | < 0.001 |
| PhenoAge accelerationb | |||||
| Q1 | 60/22,484 | Reference | Reference | ||
| Q2 | 98/22,484 | 1.63 (1.18-2.24) | 0.003 | 1.54 (1.12-2.13) | 0.008 |
| Q3 | 111/22,483 | 1.83 (1.34-2.51) | < 0.001 | 1.64 (1.19-2.24) | 0.002 |
| Q4 | 250/22,484 | 4.27 (3.22-5.66) | < 0.001 | 3.10 (2.31-4.15) | < 0.001 |
| Leukocyte telomere lengtha | 519/89,935 | 0.82 (0.75-0.89) | < 0.001 | 0.84 (0.77-0.91) | < 0.001 |
| Leukocyte telomere lengthb | |||||
| Q1 | 184/22,484 | Reference | Reference | ||
| Q2 | 138/22,484 | 0.78 (0.63-0.98) | 0.032 | 0.81 (0.65-1.01) | 0.065 |
| Q3 | 104/22,483 | 0.62 (0.48-0.79) | < 0.001 | 0.64 (0.50-0.82) | < 0.001 |
| Q4 | 93/22,484 | 0.58 (0.45-0.75) | < 0.001 | 0.62 (0.48-0.80) | < 0.001 |
We further employed RCS models to systematically evaluate the nonlinear relationships between three BA indicators and the risk of cirrhosis. The results revealed that all three indicators were statistically significantly associated with cirrhosis risk (P for overall < 0.001), albeit with distinct patterns
PRS with cirrhosis risk
In our study, the PRS accounted for 1.14% of the variance in cirrhosis risk (P < 2 × 10-16). After adjusting for potential covariates, participants who developed cirrhosis tended to have a higher PRS than those without cirrhosis. When the PRS was divided into quintiles, the risk of cirrhosis across PRS groups showed a significant gradient-increasing trend (P for trend < 0.001) [Figure 1A]. Participants in the highest genetic risk category had a 2.43-fold higher risk of incident cirrhosis (95%CI: 1.85-3.19) compared to those in the lowest category [Figure 1B and Supplementary Table 4].
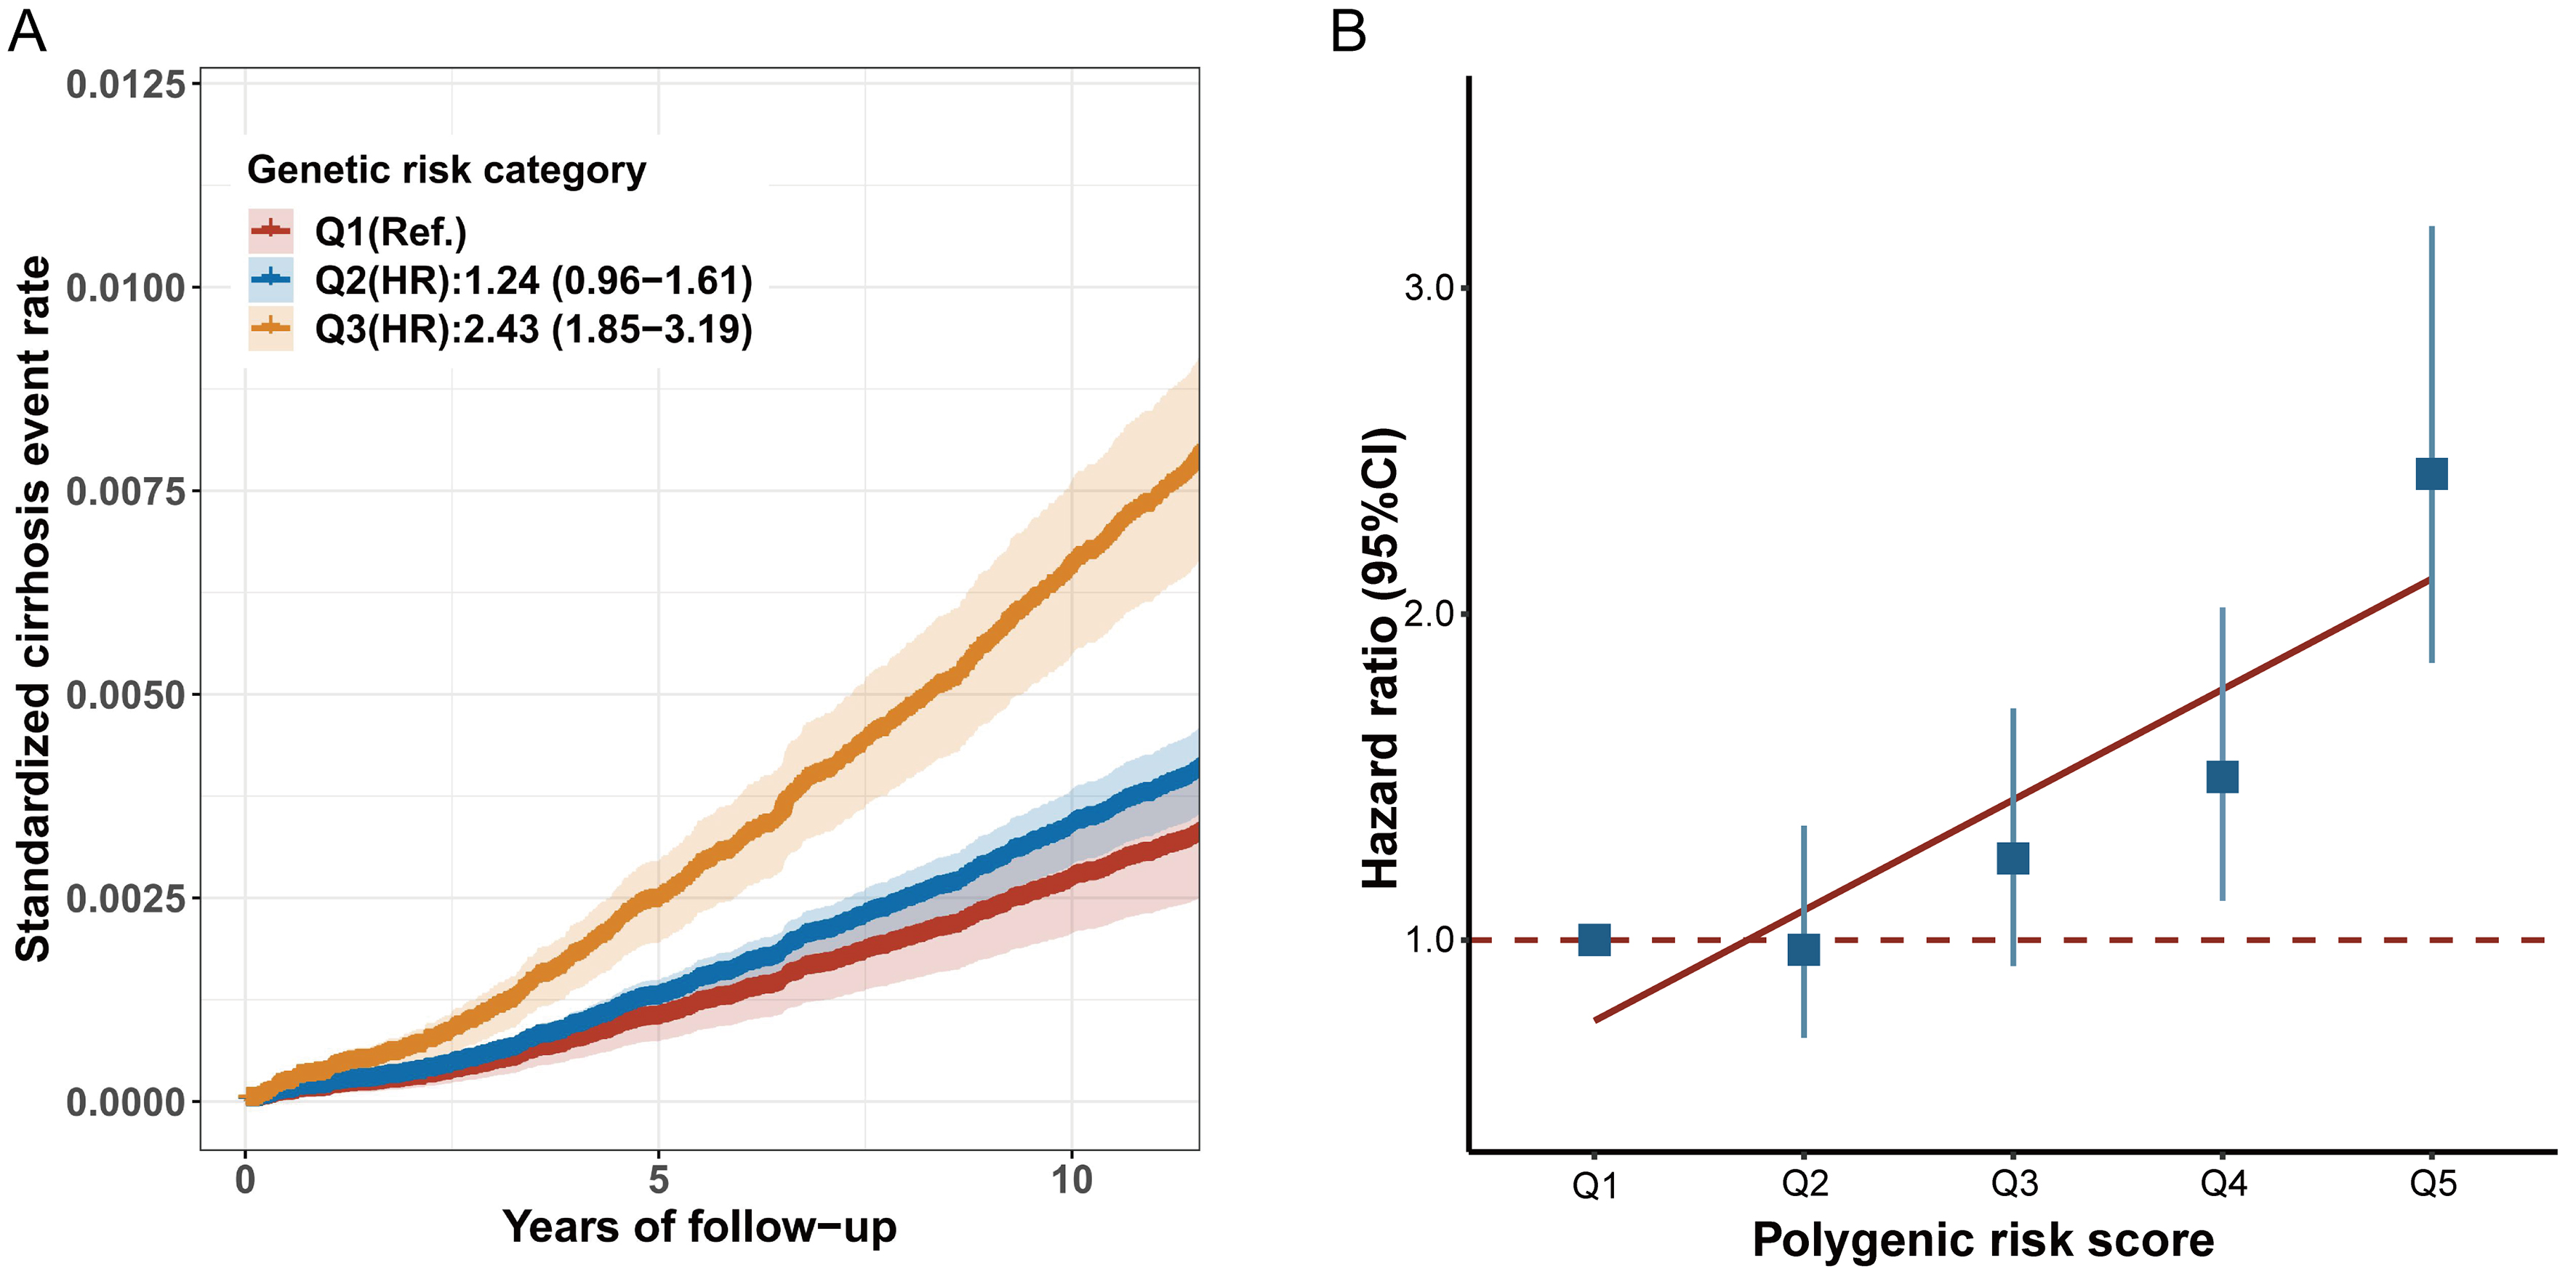
Figure 1. The association effects of PRS with incident cirrhosis among individuals with MASLD. (A) standardized cumulative cirrhosis rates in Q1 (lowest quintile), Q2 (2 to 4 quintile), and Q3 (highest quintile) genetic risk groups; (B) the association effects of PRS with incident cirrhosis risk. HRs and 95%CIs were estimated with adjustment for age, sex, ethnicity, Townsend deprivation index, body mass index, alcohol status, smoking status, physical activity, history of hypertension, history of diabetes, and history of heart disease. MASLD: Metabolic dysfunction-associated steatotic liver disease; 95%CI: 95% confidence interval; PRS: polygenic risk score; HR: hazard ratio.
Joint and interaction effect of BA acceleration and genetic susceptibility on cirrhosis risk
Our analysis revealed significant joint effects of BA indicators and genetic risk on cirrhosis development. Compared to participants with younger PhenoAge acceleration and low genetic risk, those with older PhenoAge acceleration and high genetic risk had a 7.65-fold higher risk of cirrhosis (95%CI: 5.08-11.52)
Stratified analysis for BA acceleration with cirrhosis risk
As shown in Figure 2, further subgroup analyses revealed that the positive association between PhenoAge acceleration and cirrhosis risk remained statistically significant across subgroups stratified by sex, age, ethnicity, BMI, smoking status, alcohol use, physical activity, diabetes, hypertension, and heart disease. Similar associations were observed for both KDM-BA acceleration and LTL [Supplementary Table 7]. Notably, although all interaction P-values were > 0.05, considering the potential influence of unknown confounders and the consistent direction of effect estimates, the clinical significance of these findings warrants further investigation.
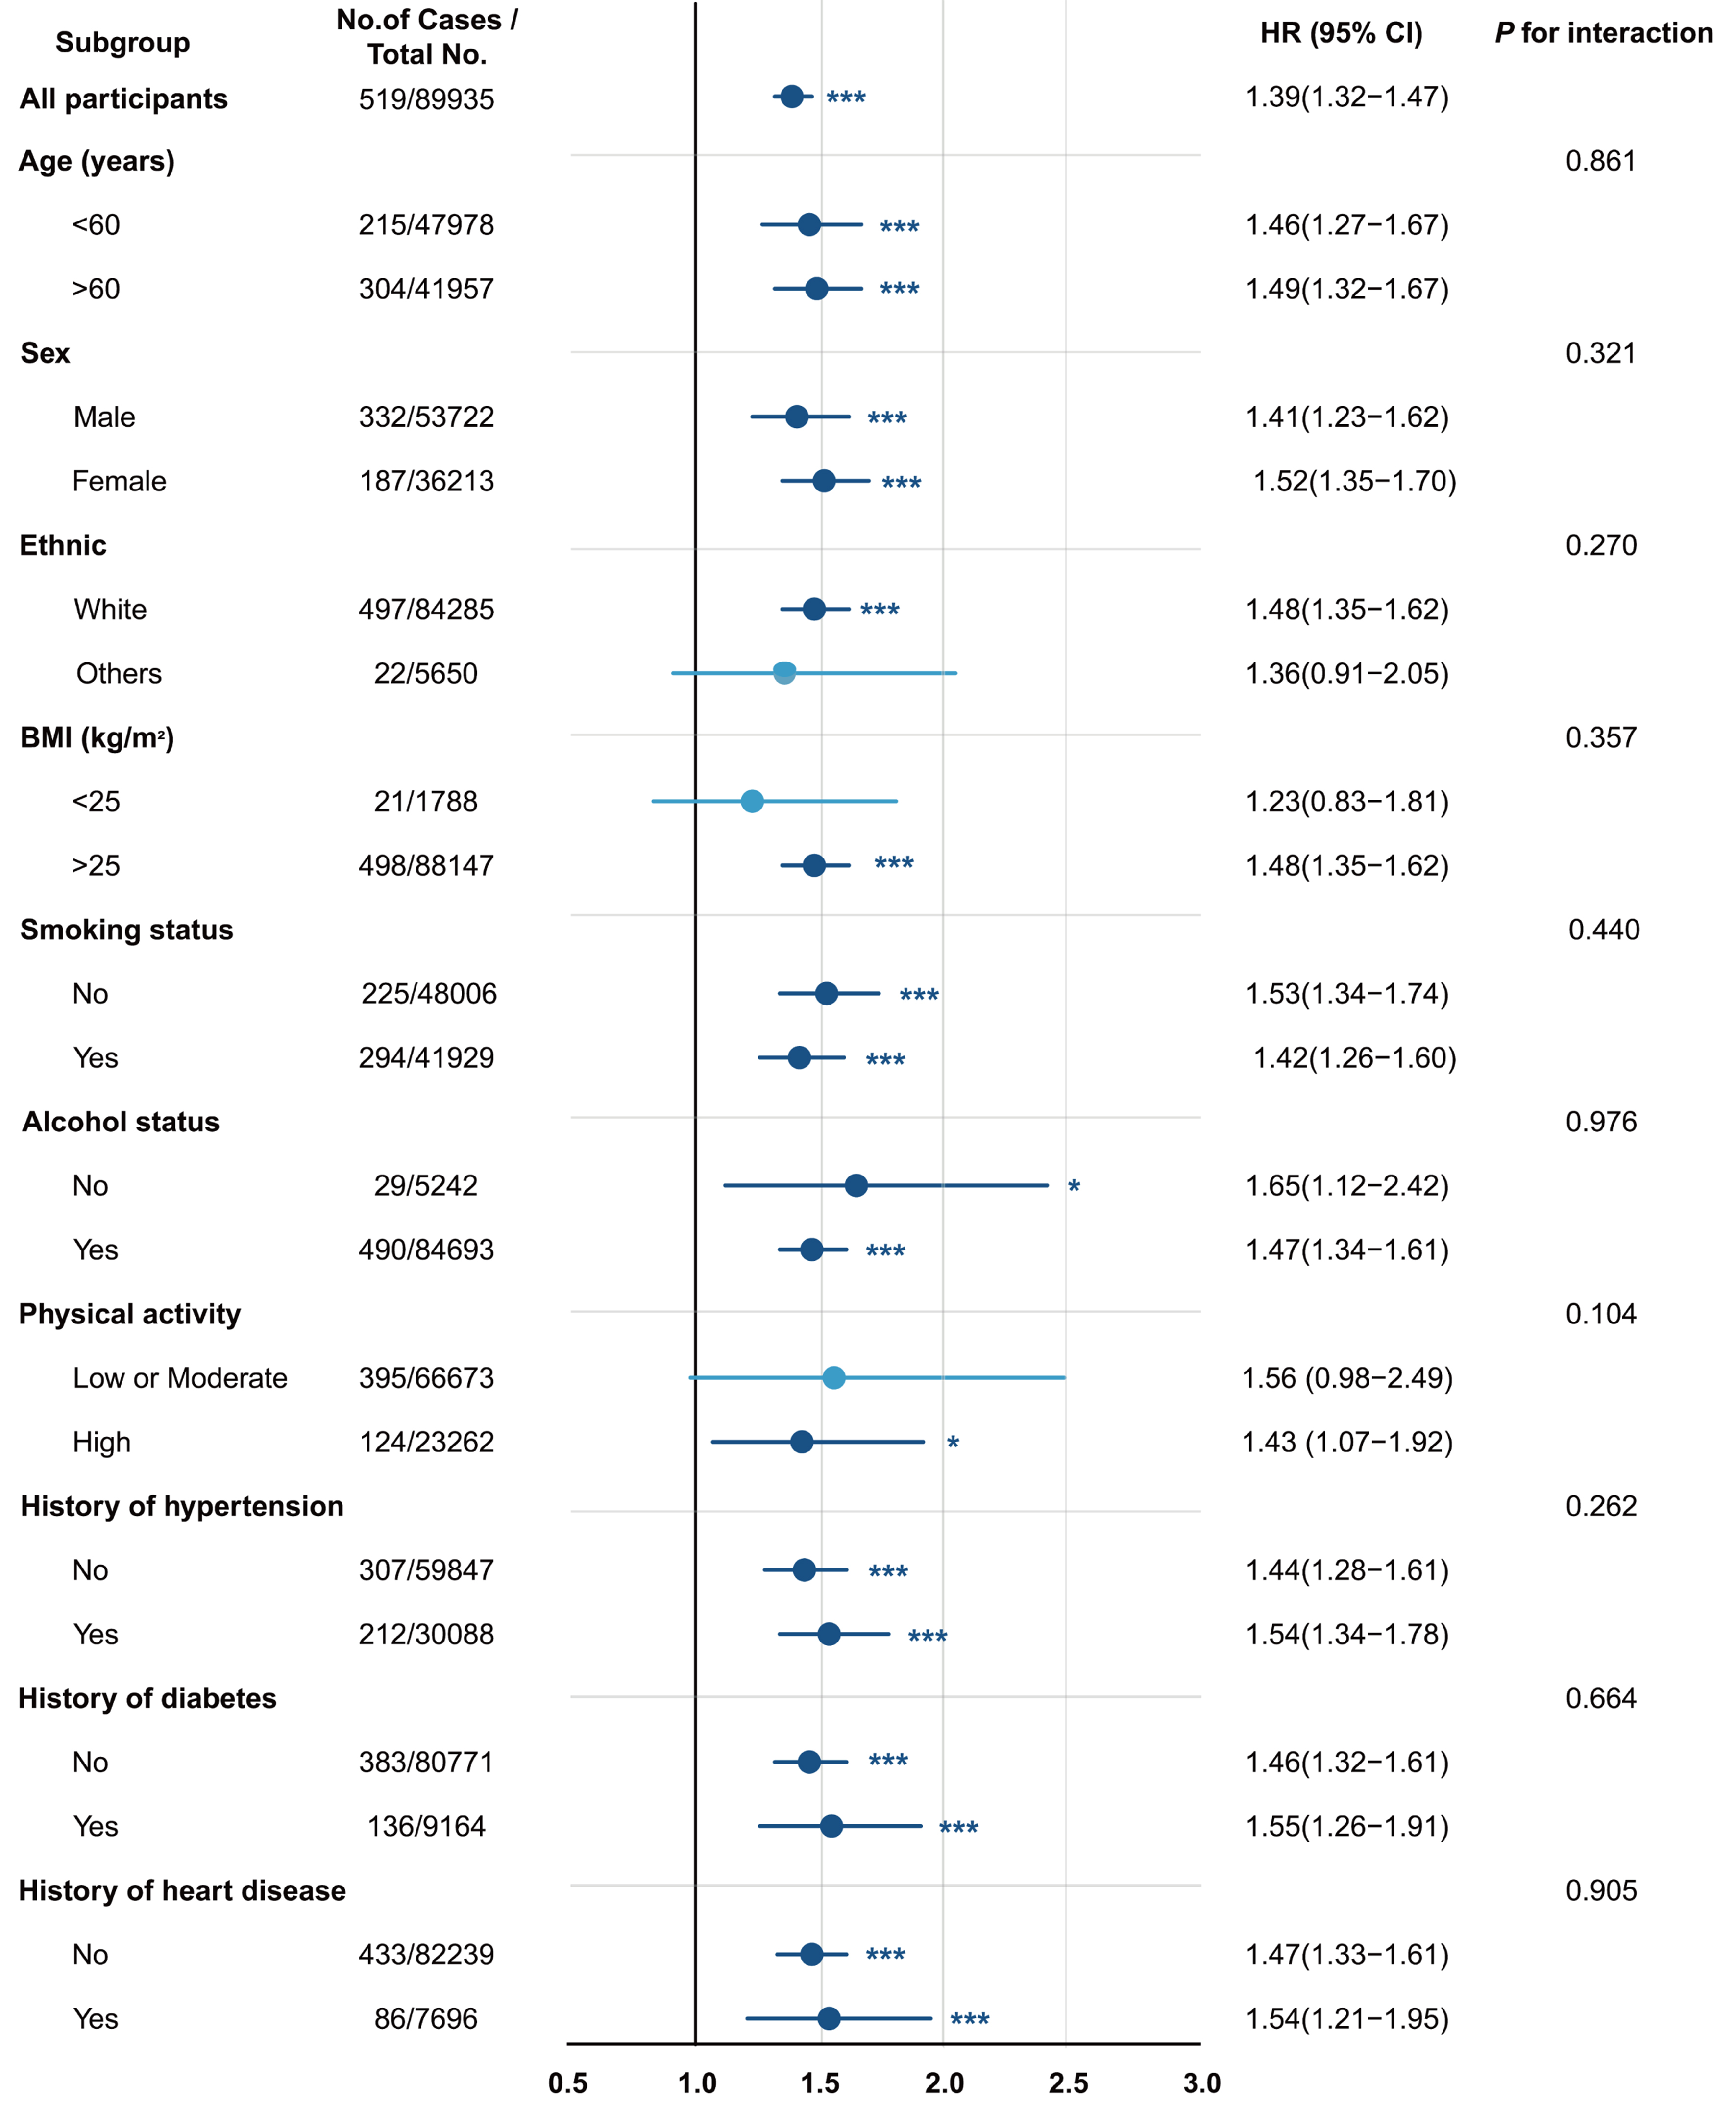
Figure 2. PhenoAge acceleration on cirrhosis in different subgroups among the MASLD population. HRs and 95%CIs were estimated with adjustment for age, sex, ethnicity, Townsend deprivation index, body mass index, alcohol status, smoking status, physical activity, history of hypertension, history of diabetes, and history of heart disease. MASLD: Metabolic dysfunction-associated steatotic liver disease; BMI: body mass index; HR: hazard ratio; 95%CI: 95% confidence interval.
Benefits of adherence to a younger BA acceleration with cirrhosis risk
Our study found that individuals with the highest genetic risk and highest BA acceleration had the highest standardized 10-year absolute risk of cirrhosis. Moreover, as BA acceleration decreased, participants within each genetic risk category showed a corresponding decline in the risk of cirrhosis. When PhenoAge acceleration was at its lowest, the standardized 10-year absolute risk of cirrhosis decreased by 7.72 (95%CI: 5.65-9.89) and 17.74 (95%CI: 11.11-24.16) per 1,000 person-years for the low-to-intermediate and high genetic risk categories, respectively [Figure 3]. Similar trends were observed for KDM-BA acceleration and LTL across different genetic risk groups [Supplementary Tables 8 and 9].
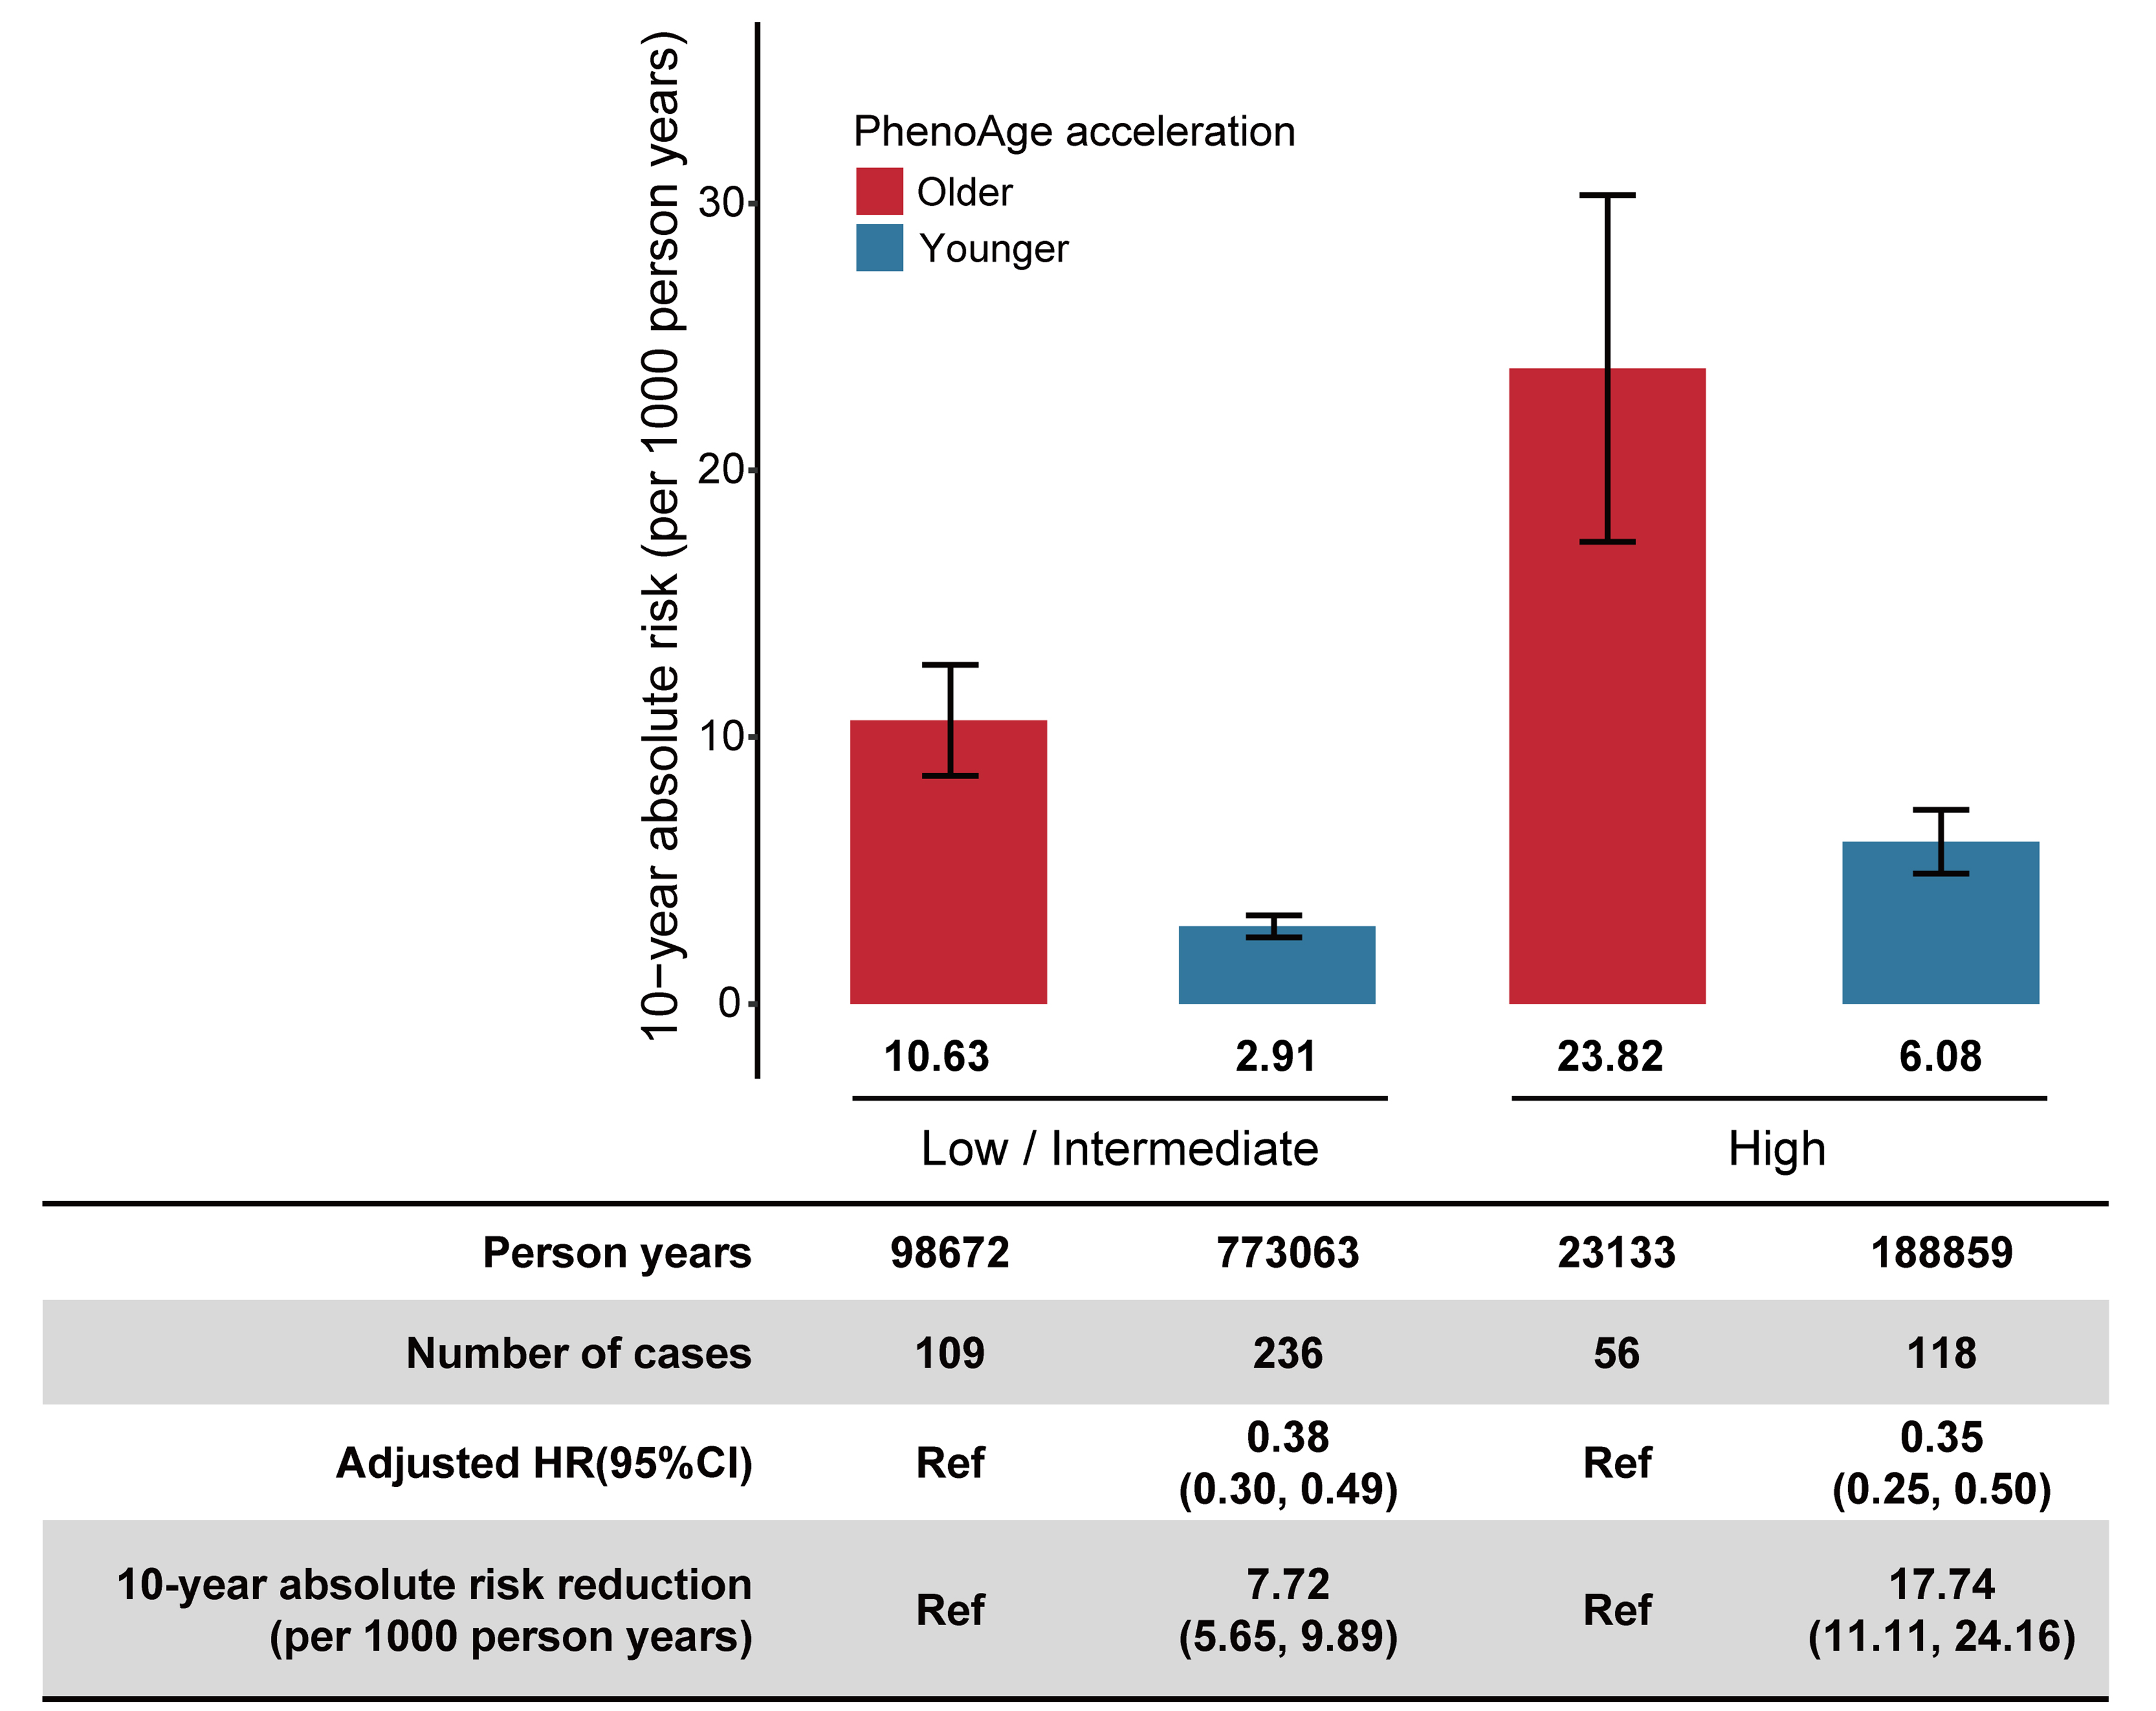
Figure 3. Absolute risk and risk reduction of incident cirrhosis in the MASLD population by PhenoAge acceleration across genetic risk category. Genetic risk was categorized into low-intermediate (quintiles 1-4), and high (the highest quintile). The 10-year absolute risks were standardized for age and sex in the UK Biobank. The HRs were estimated using Cox proportional hazards regression with adjustment for age, sex, ethnicity, Townsend deprivation index, body mass index, alcohol status, smoking status, physical activity, history of hypertension, history of diabetes, and history of heart disease. The 10-year absolute risk reduction and 95%CI were generated by drawing 1,000 bootstrap samples from the estimation dataset. MASLD: metabolic dysfunction-associated steatotic liver disease; 95%CI: 95% confidence interval; HR: hazard ratio; Ref: reference.
After conducting a series of sensitivity analyses, we found that the robust associations between BA acceleration and cirrhosis risk remained consistent even after excluding participants diagnosed with cirrhosis within the first, second, and third years of follow-up [Supplementary Tables 10-12], imputing missing covariate information [Supplementary Table 13], and further adjusting for C-reactive protein and self-reported overall health status [Supplementary Table 14].
DISCUSSION
“In this prospective cohort study, using three BA indicators validated in the UK Biobank, we found that accelerated KDM-BA and PhenoAge, as well as shorter LTL, were significantly associated with an increased risk of MASLD-related cirrhosis. Furthermore, joint effects were observed between BA indicators and the genetic risk of cirrhosis. Notably, participants with the highest genetic risk showed the greatest 10-year absolute risk reduction for cirrhosis (17.74 per 1,000 person-years) when PhenoAge acceleration was lowered.
Previous studies have predominantly focused on the role of BA indicators in the development of certain chronic liver diseases[14,34-36]. Xia et al. reported that participants with accelerated DNA methylation age had a higher risk of incident MASLD than those without accelerated age[35]. Another study found that patients with MASH exhibited accelerated epigenetic age, which was associated with increased liver fibrosis[14]. A recent study also showed that longer telomere length was linked to a reduced risk of MASLD incidence and identified a positive additive interaction between high PRS and shorter telomere length, suggesting that genetic factors may increase disease risk by accelerating telomere attrition[36]. However, most existing studies are limited to single BA indicators or specific liver disease stages, with a paucity of prospective cohort studies examining the relationship between multiple BA indicators and cirrhosis risk in the MASLD population. Our study demonstrates that accelerated BA is associated with an increased risk of MASLD-related cirrhosis and further reveals combined effects with PRS. These findings suggest that mitigating biological aging may be crucial for preventing MASLD progression to cirrhosis and could help offset the adverse effects of inherent genetic risks.
Several potential biological mechanisms may mediate the link between BA and liver diseases. Studies have shown that senescent hepatocytes exhibit characteristic changes such as telomere shortening, nuclear shrinkage, and mitochondrial DNA damage, which promote pro-inflammatory cytokine secretion and cell cycle arrest, ultimately leading to liver injury[37]. These aging-related liver changes not only directly induce hepatocyte apoptosis and necrosis but also contribute to the progression of MASLD to more advanced liver diseases through multiple mechanisms, including hepatic stellate cell activation, mitochondrial dysfunction, and fibrosis promotion[7,38]. Kim et al. explored the relationship between liver fat deposition and hepatocyte senescence using a high-fat diet (HFD) mouse model. They found that senescence significantly increased the liver’s susceptibility to HFD-induced fibrosis and inflammation, and compared to younger mice, older mice exhibited more advanced liver fibrosis and higher expression of fibrosis markers such as alpha smooth muscle actin (αSMA), transforming growth factor (TGF)-β1, TGF-β2 and tissue inhibitor metalloproteinase (TIMP) 1[39]. However, the mechanisms by which aging contributes to different pathological stages of MASLD progression - from simple steatosis to fibrosis, cirrhosis, and hepatocellular carcinoma - as well as their interactions with genetic factors, remain to be further investigated.
Given that aging is a multifactorial process, a single BA predictor is insufficient to monitor risk across diverse age-related disease phenotypes. Several existing BA predictors - including epigenetic clocks, telomere length, transcriptomic, proteomic, and metabolomic markers - have been widely applied to predict health outcomes[10]. Since each predictor reflects a specific aspect of the aging process, integrating these indicators appears to be an ideal strategy for predicting the risk of cirrhosis among the MASLD population. However, obtaining a comprehensive indicator from multiple tissue sources is impractical. In contrast, conventional clinical biomarkers, which offer convenient detection and cost advantages, are more suitable for large-scale population screening and dynamic monitoring. Regarding genetic factors, the number of identified susceptibility loci for cirrhosis remains limited. Although explaining only 1.14% of the phenotypic variance, the PRS developed in this study was statistically significant and showed potential for population risk stratification. Future research should focus on discovering additional genetic variants to improve the predictive performance of the PRS, aiming to achieve more accurate identification of high-risk individuals. Notably, BA was consistently lower than CA. This may be attributable to the healthy volunteer effect, where participants’ overall health status is generally better than that of the general population, or to the physiological indicators of older adults approaching their lower limits, leading the model to overestimate the physiological status of older individuals.
This study demonstrated that in MASLD individuals with high genetic risk, maintaining the lowest level of PhenoAge acceleration significantly reduced the incidence of cirrhosis (17.74 per 1,000 person-years). This risk reduction corresponds to a Number Needed to Treat (NNT) of 56, meaning that one case of MASLD progression to cirrhosis could be prevented for every 56 high-risk individuals receiving intervention. This intervention efficiency surpasses that of many established primary prevention strategies for chronic diseases, highlighting the clinical value of BA-targeted interventions in delaying MASLD progression. Previous research has shown that anti-aging drugs aimed at eliminating senescent cells or mitigating their senescence-associated secretory phenotype (SASP) have become effective approaches against liver diseases[40]. Numerous natural products with anti-aging potential, such as ganoderic acid A and berberine, have also demonstrated the ability to ameliorate liver aging phenotypes[41,42], providing a mechanistic basis for targeting “delayed biological aging” in interventions for chronic liver disease. In the current research landscape, various non-pharmacological intervention strategies show promising potential in the prevention of liver diseases. For example, Zhao et al. found that remote limb ischemic conditioning can ameliorate steatohepatitis through extracellular vesicle-mediated muscle-liver crosstalk[43]. Other studies have shown that microbiome-targeted interventions, such as probiotics, antibiotics, and fecal microbiota transplantation, exert beneficial effects on liver health[44]. Concurrently, treatment strategies for liver diseases are evolving toward combination and individualized approaches. As noted by Tincopa et al. in their research on non-alcoholic steatohepatitis (NASH) treatment, combination therapies using drugs with different mechanisms of action can simultaneously achieve multiple goals, including anti-fibrotic, metabolic regulatory, and anti-inflammatory effects[45]. Accordingly, we propose that future research should extend beyond traditional liver targets to explore the integration of delayed biological aging with existing therapies. A multi-pronged strategy combining lifestyle management and pharmacological interventions could establish a multimodal prevention and control system, thereby providing a new evidence base for the management of chronic liver diseases.
Several limitations of the current study should be acknowledged. First, because the clinical parameters used to construct the three BA indicators (KDM-BA, PhenoAge, and LTL) were measured only at baseline, we were unable to evaluate the association between their dynamic trajectories and the risk of incident cirrhosis. Future validation in longitudinal cohorts with repeated biomarker measurements is warranted. Second, due to the inherent limitations of observational study design, this study cannot provide definitive causal evidence. Although we adjusted for multiple known potential confounders and obtained results consistent with the main findings, unmeasured confounders, residual confounding, or reverse causality cannot be completely ruled out. For instance, subclinical liver disease may influence biomarker levels and interfere with the assessment of BA. Future studies employing interventional designs or more robust causal inference methods are needed to validate our findings. Third, because this study is based on a single cohort from the UK Biobank, the results may be affected by optimism bias. Validation in independent populations is required to enhance generalizability and reliability. Fourth, this study employed the FLI as one diagnostic criterion for MASLD. However, FLI has limited diagnostic accuracy compared with gold-standard methods such as imaging or histology. For example, the index is influenced by demographic factors including sex and ethnicity[46] and cannot accurately grade the severity of hepatic steatosis[47]. These limitations may lead to case misclassification and an underestimation of observed effect sizes. Finally, because the majority of participants in the UK Biobank cohort were middle-aged and elderly Europeans, the effect of accelerated BA on cirrhosis in MASLD patients requires further examination in younger populations.
Our findings demonstrate that in patients with MASLD, accelerated BA (KDM-BA and PhenoAge acceleration) based on clinical biomarkers is positively associated with the risk of cirrhosis, whereas longer LTL is associated with a reduced risk. These results highlight that interventions aimed at delaying biological aging, such as regular exercise and maintaining a balanced diet, may represent potential strategies to prevent disease progression and improve outcomes in patients with MASLD.
DECLARATIONS
Acknowledgments
We thank all UK Biobank participants and the management team for their contribution and support. We also extend our sincere gratitude to Professor Haifeng Pan for providing data support for this study.
Authors’ contributions
Conceptualization: Tian T, Zhu L, Ni J
Formal analysis: Tian T, Zhu L
Methodology: Tian T, Zhu L, Wu Z, Xuan W
Visualization: Tian T, Zhu L, Wu Z, Xuan W
Writing - original draft: Tian T, Ni J
Funding acquisition: Ni J
Supervision: Li Y, Fan J, Zeng J, Ni J
Writing - review and editing: Li Y, Fan J, Zeng J, Ni J
All authors approved the final submitted manuscript.
Availability of data and materials
Data used in this study are available from the UK Biobank upon request (www.ukbiobank.ac.uk). The data supporting the results of this study were accessed under license and are not publicly available.
Financial support and sponsorship
This work was supported by the National Natural Science Foundation of China (82103932), the Research Fund of Anhui Institute of Translational Medicine (2023zhyx-C07), and the Research Fund of the Center for Big Data and Population Health of IHM (JKS2023008).
Conflicts of interest
Fan J is an Editorial Board Member of the journal Metabolism and Target Organ Damage. Fan J was not involved in any steps of the editorial process, notably including reviewers’ selection, manuscript handling, or decision-making. The other authors declare that there are no conflicts of interest.
Ethical approval and consent to participate
The UK Biobank study received ethical approval from the North West Multi-Centre Research Ethics Committee, Manchester, UK (REC reference: 21/NW/0157), and all participants provided written informed consent. The present analysis was conducted under UK Biobank Application Number 80827 and did not require additional institutional ethical approval, as only de-identified data were used.
Consent for publication
Not applicable.
Copyright
© The Author(s) 2025.
Supplementary Materials
REFERENCES
1. Riazi K, Azhari H, Charette JH, et al. The prevalence and incidence of NAFLD worldwide: a systematic review and meta-analysis. Lancet Gastroenterol Hepatol. 2022;7:851-61.
2. Devarbhavi H, Asrani SK, Arab JP, Nartey YA, Pose E, Kamath PS. Global burden of liver disease: 2023 update. J Hepatol. 2023;79:516-37.
3. Lazarus JV, Mark HE, Villota-Rivas M, et al; NAFLD policy review collaborators. The global NAFLD policy review and preparedness index: are countries ready to address this silent public health challenge? J Hepatol. 2022;76:771-80.
4. Asrani SK, Devarbhavi H, Eaton J, Kamath PS. Burden of liver diseases in the world. J Hepatol. 2019;70:151-71.
5. Flemming JA, Djerboua M, Groome PA, Booth CM, Terrault NA. NAFLD and alcohol-associated liver disease will be responsible for almost all new diagnoses of cirrhosis in Canada by 2040. Hepatology. 2021;74:3330-44.
6. He Y, Su Y, Duan C, et al. Emerging role of aging in the progression of NAFLD to HCC. Ageing Res Rev. 2023;84:101833.
7. Wynne HA, Cope LH, Mutch E, Rawlins MD, Woodhouse KW, James OF. The effect of age upon liver volume and apparent liver blood flow in healthy man. Hepatology. 1989;9:297-301.
8. Wang J, Zhang W, Liu X, Kim M, Zhang K, Tsai RYL. Epigenome-wide analysis of aging effects on liver regeneration. BMC Biol. 2023;21:30.
9. Hamczyk MR, Nevado RM, Barettino A, Fuster V, Andrés V. Biological versus chronological aging: JACC focus seminar. J Am Coll Cardiol. 2020;75:919-30.
11. Nie C, Li Y, Li R, et al. Distinct biological ages of organs and systems identified from a multi-omics study. Cell Rep. 2022;38:110459.
12. Diebel LWM, Rockwood K. Determination of biological age: geriatric assessment vs biological biomarkers. Curr Oncol Rep. 2021;23:104.
13. Schneider CV, Schneider KM, Teumer A, et al. Association of telomere length with risk of disease and mortality. JAMA Intern Med. 2022;182:291-300.
14. Loomba R, Gindin Y, Jiang Z, et al. DNA methylation signatures reflect aging in patients with nonalcoholic steatohepatitis. JCI Insight. 2018;3:96685.
15. Sudlow C, Gallacher J, Allen N, et al. UK biobank: an open access resource for identifying the causes of a wide range of complex diseases of middle and old age. PLoS Med. 2015;12:e1001779.
16. Bedogni G, Bellentani S, Miglioli L, et al. The Fatty Liver Index: a simple and accurate predictor of hepatic steatosis in the general population. BMC Gastroenterol. 2006;6:33.
17. Ho B, Thompson A, Jorgensen AL, Pirmohamed M. Role of fatty liver index in risk-stratifying comorbid disease outcomes in non-alcoholic fatty liver disease. JHEP Rep. 2023;5:100896.
18. Hong S, Hao Y, Sun L, et al. Prevalence and risk factors of significant fibrosis in chronic hepatitis B patients with concurrent metabolic dysfunction-associated steatotic liver disease. Ann Hepatol. 2025;30:101589.
19. Emdin CA, Haas M, Ajmera V, et al. Association of genetic variation with cirrhosis: a multi-trait genome-wide association and gene-environment interaction study. Gastroenterology. 2021;160:1620-33.e13.
20. Nagelkerke NJD. A note on a general definition of the coefficient of determination. Biometrika. 1991;78:691-2.
21. Klemera P, Doubal S. A new approach to the concept and computation of biological age. Mech Ageing Dev. 2006;127:240-8.
22. Levine ME. Modeling the rate of senescence: can estimated biological age predict mortality more accurately than chronological age? J Gerontol A Biol Sci Med Sci. 2013;68:667-74.
23. Levine ME, Lu AT, Quach A, et al. An epigenetic biomarker of aging for lifespan and healthspan. Aging. 2018;10:573-91.
24. Belsky DW, Caspi A, Arseneault L, et al. Quantification of the pace of biological aging in humans through a blood test, the DunedinPoAm DNA methylation algorithm. Elife. 2020;9:e54870.
25. Kwon D, Belsky DW. A toolkit for quantification of biological age from blood chemistry and organ function test data: BioAge. Geroscience. 2021;43:2795-808.
26. McEwen LM, Jones MJ, Lin DTS, et al. Systematic evaluation of DNA methylation age estimation with common preprocessing methods and the Infinium MethylationEPIC BeadChip array. Clin Epigenetics. 2018;10:123.
28. Mather KA, Jorm AF, Parslow RA, Christensen H. Is telomere length a biomarker of aging? A review. J Gerontol A Biol Sci Med Sci. 2011;66:202-13.
29. Hastings WJ, Shalev I, Belsky DW. Comparability of biological aging measures in the National Health and Nutrition Examination Study, 1999-2002. Psychoneuroendocrinology. 2019;106:171-8.
30. Parker DC, Bartlett BN, Cohen HJ, et al. Association of blood chemistry quantifications of biological aging with disability and mortality in older adults. J Gerontol A Biol Sci Med Sci. 2020;75:1671-9.
31. Bassett DR Jr. International physical activity questionnaire: 12-country reliability and validity. Med Sci Sports Exerc. 2003;35:1396.
32. Li R, Chambless L. Test for additive interaction in proportional hazards models. Ann Epidemiol. 2007;17:227-36.
33. Assmann SF, Hosmer DW, Lemeshow S, Mundt KA. Confidence intervals for measures of interaction. Epidemiology. 1996;7:286-90.
34. Tian T, Zeng J, Meng SY, et al. Accelerated biological aging, genetic susceptibility, and incident severe MASLD, liver cirrhosis and cancer. 2024.
35. Xia M, Li W, Lin H, et al. DNA methylation age acceleration contributes to the development and prediction of non-alcoholic fatty liver disease. Geroscience. 2024;46:3525-42.
36. Tang L, Li D, Ma Y, Cui F, Wang J, Tian Y. The association between telomere length and non-alcoholic fatty liver disease: a prospective study. BMC Med. 2023;21:427.
37. Papatheodoridi AM, Chrysavgis L, Koutsilieris M, Chatzigeorgiou A. The role of senescence in the development of nonalcoholic fatty liver disease and progression to nonalcoholic steatohepatitis. Hepatology. 2020;71:363-74.
38. Dabravolski SA, Bezsonov EE, Orekhov AN. The role of mitochondria dysfunction and hepatic senescence in NAFLD development and progression. Biomed Pharmacother. 2021;142:112041.
39. Kim IH, Xu J, Liu X, et al. Aging increases the susceptibility of hepatic inflammation, liver fibrosis and aging in response to high-fat diet in mice. Age. 2016;38:291-302.
40. Du K, Umbaugh DS, Ren N, Diehl AM. Cellular senescence in liver diseases: from molecular drivers to therapeutic targeting. J Hepatol. 2025;Epub ahead of print.
41. Chen L, Wu B, Mo L, et al. High-content screening identifies ganoderic acid A as a senotherapeutic to prevent cellular senescence and extend healthspan in preclinical models. Nat Commun. 2025;16:2878.
42. Tang W, Zhang Q, Qin L, et al. M6PR upregulation by berberine attenuates hepatic senescence via sorting STING into endosome for degradation. Phytomedicine. 2025;145:157089.
43. Zhao Y, Gao L, Chen J, et al. Remote limb ischemic conditioning alleviates steatohepatitis via extracellular vesicle-mediated muscle-liver crosstalk. Cell Metab. 2025;37:886-902.e7.
44. Saenz E, Montagut NE, Wang B, et al. Manipulating the gut microbiome to alleviate steatotic liver disease: current progress and challenges. Engineering. 2024;40:51-60.
45. Tincopa MA, Anstee QM, Loomba R. New and emerging treatments for metabolic dysfunction-associated steatohepatitis. Cell Metab. 2024;36:1430.
46. Ruhl CE, Everhart JE. Fatty liver indices in the multiethnic United States National Health and Nutrition Examination Survey. Aliment Pharmacol Ther. 2015;41:65-76.
Cite This Article
How to Cite
Download Citation
Export Citation File:
Type of Import
Tips on Downloading Citation
Citation Manager File Format
Type of Import
Direct Import: When the Direct Import option is selected (the default state), a dialogue box will give you the option to Save or Open the downloaded citation data. Choosing Open will either launch your citation manager or give you a choice of applications with which to use the metadata. The Save option saves the file locally for later use.
Indirect Import: When the Indirect Import option is selected, the metadata is displayed and may be copied and pasted as needed.
About This Article
Copyright

Data & Comments
Data
0


Comments
Comments must be written in English. Spam, offensive content, impersonation, and private information will not be permitted. If any comment is reported and identified as inappropriate content by OAE staff, the comment will be removed without notice. If you have any queries or need any help, please contact us at [email protected].