




Fast three-dimensional nanoimaging of electron-beam-sensitive metal-organic frameworks-encapsulated materials
 0
0 Abstract
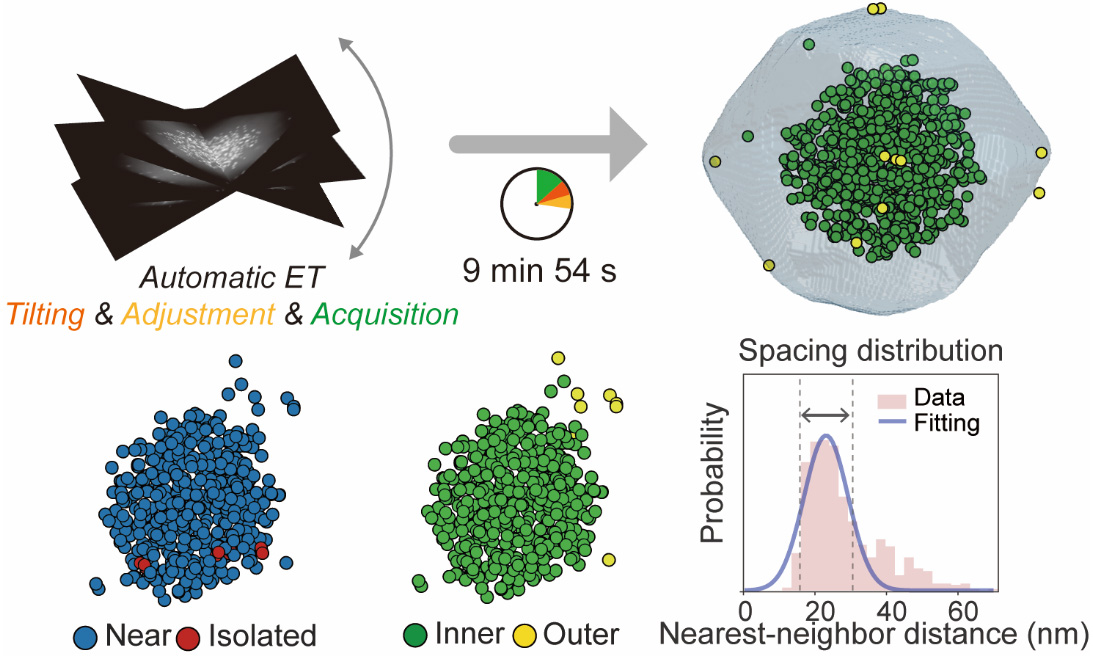
Understanding the three-dimensional (3D) micro-arrangement of active phases in metal-organic frameworks (MOFs) is paramount for the rational design of MOFs-based encapsulation materials. While electron tomography (ET) enables 3D reconstruction of real-space microstructures with high spatial resolution, conventional ET is time-consuming and dose-intensive, which sacrifices characterization efficiency and introduces the risk of sample damage. Herein we develop a pre-calibration fast ET acquisition method that reduces ET series acquisition time from 1 h 20 min to 9 min 54 s and decreases the cumulative electronic dose by 88.9%. The fast ET delivers detailed 3D information of metal nanoparticles encapsulated within zeolitic imidazolate framework-8 (MNPs@ZIF-8). Unlike ambiguous qualitative assessment in two-dimensional (2D) projections, we precisely quantify the encapsulation efficiency, aggregation ratio, radial distribution and nearest-neighbor distance (NND) of MNPs based on the 3D reconstruction. These unique analyses reveal that MNPs’ encapsulation exhibits two modes: saturated adsorption and adsorption decay, which can be regulated by altering the relative abundance between MNPs and adsorption active sites. It is also found that MNPs exhibit unbiased isotropic dispersion characteristics, which is evidenced by the NND following a single-peaked Gaussian distribution. This work achieves a leap from 2D qualitative to 3D quantitative analysis of MOFs-encapsulated materials, thereby paving the way to structure-oriented rational design.
Keywords
INTRODUCTION
Metal-organic frameworks (MOFs)-based encapsulation materials combine the controllable porous network of MOFs hosts with the excellent reactivity of encapsulated active phases, which have been widely applied in gas adsorption and storage, heterogeneous catalysis, sensing, and drug delivery[1-6]. The ordered network, akin to a honeycomb, confines the active phases. This can not only effectively prevent the migration and aggregation of active phases, but also promote the mass transfer and diffusion of substrates and products[7-10]. Moreover, this modular architecture provides considerable design flexibility to tailor structures of composites[10-13]. For instance, the framework structure of MOFs or the type, size, dispersion, and encapsulation efficiency of the active phases can be modulated to adjust the mass transfer selectivity, reaction activity, and stability[14-17]. Therefore, high spatial resolution characterization is of great significance for accurately understanding the architecture of samples and thereby assisting in their rational design. However, for composites with small-sized, complex-encapsulated, and densely dispersed active phases, it remains challenging to accurately evaluate their structural characteristics[18-20].
Transmission electron microscopy (TEM) is the most commonly used technique for directly imaging 2D-MOFs[21], 3D MOFs[22], and MOFs-based encapsulation materials[23-26]. The inherent high-resolution transmission imaging capability of TEM makes it a powerful tool to characterize the morphology and crystal structure of MOFs, and presence, encapsulation, and dispersion of active phases within them. However, conventional TEM imaging can only provide two-dimensional (2D) projections of three-dimensional (3D) samples, thereby losing the depth information along the direction of the electron beam[27-29]. Electron tomography (ET) is a technique that reconstructs the 3D structure from a series of 2D projections acquired at different tilt angles[30-34]. However, during the ET data acquisition, manual sample tracking and re-focusing steps are time-consuming and result in additional electron accumulation, making electron-beam-sensitive materials (e.g. MOFs) generally unsuitable for conventional ET analysis[35,36].
Here, we present a fast pre-calibration ET acquisition method that reduces the total acquisition time from 1 h 20 min to 9 min 54 s and decreases the cumulative electron dose by 88.9%. This method achieves automatic sample tracking and refocusing by pre-calibrating the sample movement during the sample tilting. Using metal nanoparticles encapsulated within zeolitic imidazolate framework-8 (MNPs@ZIF-8) as a model system, we quantitatively determine the size, number, encapsulation efficiency, aggregation ratio, radial distribution (RD), and nearest neighbor distribution (NND) of MNPs from real-space 3D reconstructions. The RD analysis reveals that MNPs encapsulation process exhibits two modes: a saturated adsorption mode, characterized by a plateau region in the RD curve, which indicates that MNP adsorption remains stable despite decreasing concentration; and an adsorption decay mode, marked by an exponential decay region in the RD curve, signifying that adsorption weakens significantly as MNP concentration declines. The NND follows a single-peaked Gaussian distribution, which reflects MNPs exhibit random dispersion in 3D space. Furthermore, we also observe that the introduction of the capping agent simultaneously enhances spatial exclusion and distribution disorder, which is evidenced by positive peak shift and peak broadening in the NND fitting curves. These findings not only expand the understanding of the 3D structure of MNPs@ZIF-8 but also provide a general workflow for the structure-oriented design of MOFs-based encapsulation materials.
METHODS
Materials
Chemicals and solvents involved in this work were purchased and used without further purification. Platinum acetylacetonate (C10H14O4Pt) was purchased from Bide Pharmatech. Zinc acetylacetonate (C10H14ZnO4), sodium tetrachloropalladate (Na2PdCl4), chloroauric acid (HAuCl4) and 2-methylimidazole (C4H6N2) were purchased from Aladdin. Graphene oxide (GO) was purchased from Tanfeng Technology. Polyvinyl pyrrolidone (PVP) was purchased from Macklin. Zinc nitrate hexahydrate (Zn(NO3)2·6H2O), sulfuric acid (H2SO4), nitric acid (HNO3), acetone, methanol and ethanol were purchased from the Sinopharm Chemical Reagent Co. Ltd.
Synthesis of PtZn/GO
GO was pretreated in a mixed solution of H2SO4 (10 mL) and HNO3. C10H14O4Pt (22.4 mg), C10H14ZnO4 (11.2 mg), and GO (48 mg) were dispersed in a mixture of ethanol (40 mL) and acetone (40 mL). The mixture was sonicated for 1 h and subsequently stirred at 300 rpm to dryness in a water bath at 30 °C for approximately 6 h. The resulting dry powder was annealed in a tube furnace at 700 °C for 2 h under 10% H2/Ar flow. The final product was designated as PtZn/GO.
Synthesis of MNPs and MNPs@ZIF-8
MNPs were synthesized by the reported synthesis method[18,37]. MNPs were capped by PVP (Mw = 55,000) first as reported methods. Then 1 mL MNPs solution, 5 mL solution of 2-methylimidazole (25 mM, in methanol), and 5 mL solution of Zn(NO3)2•6H2O (25 mM, in methanol) were mixed. The solutions were then reacted for 24 h without stirring at room temperature. The product was collected by centrifugation, washed several times with methanol.
Instruments
The morphology, structure and elemental information of materials were observed on transmission electron microscope (TEM, JEOL JEM-F200 200kV, Japan) coupled with EDS (JEOL Super Dual EDS System, Japan). The XRD was recorded using an X-ray diffractometer (Rigaku Miniflex600, Japan) with a Cu-Kα radiation source (λ = 1.54 Å). Ultrasonication was performed using an ultrasonic cleaner (KQ-400DE, Kunshan Ultrasonic Instruments Co., Ltd., China). Stirring was performed using a magnetic stirrer (MS-H380-Pro, DLAB Scientific Co., Ltd., China). Centrifugation was carried out using a centrifuge (TG16-WS, Hunan Xiangyi Laboratory Instrument Development Co., Ltd., China). The annealing process was performed in a tube furnace (ZHK-G05123K, Tianjin Zhonghuan Electric Furnace Co., Ltd., China).
Particle size distribution
We performed a Gaussian filter on several TEM images to remove the image noise. Subsequently, the images were binarized using the Otsu thresholding algorithm to select the region of MNPs. Connected regions were segmented using the watershed algorithm, with only regions exhibiting a circularity >0.7 selected for statistical analysis. The mean value of the major and minor axes of bounding box for each isolated region was calculated as the particle diameter. We employed this procedure to calculate the particle size distribution of Au NPs (15.70 ± 1.80 nm) and Pd NPs (15.40 ± 2.12 nm), as shown in Supplementary Figure 1.
3D ET pipelines and particle tracking algorithm
The same pre-processing procedure were utilized on all tilt series of sample, including intensity normalization, image alignment, background subtraction. Subsequently, 200 cycles of simultaneous iterative reconstruction technique (SIRT) algorithm were performed to reconstruct the 3D volumes, followed by volume segmentation to extract structural information. To minimize the impact of missing wedges and other reconstruction artifacts on particle localization, we employed a three-dimensional Gaussian peak fitting method for particle localization[38]. Local maxima were first determined for all particles in the 3D volume data, and then the particle center positions were determined by the polynomial fitting method. In addition, we removed weak intensity positions and repetitive positions by setting limits on the integral intensity of the 3D box centered on the local maxima and on the minimum distance between the two local maxima, respectively.
Determination of aggregation and encapsulation
We used the measured distance between two particles (d), the average of particle size (μ) and mean square of distribution (σ) to determine whether MNPs were agglomerated [Supplementary Figure 2A]. From a statistical perspective, for NP particle sizes that follow a near-normal distribution, the range of μ ± 2σ encompasses approximately 95% of the particles. If d ≥ μ + 2σ, two particles are recognized as non-aggregated. If μ - 2σ < d < μ + 2σ, two particles are recognized as aggregated. μ-2σ is taken as the minimum distance for particle tracking. Since a cutoff value for the distance has been selected, the minimum resolution distance for this analysis is μ-2σ.
To determine whether the MNPs are encapsulated in the ZIF-8 shell, we first identified the ZIF-8 shell with the intensity threshold and further extracted its surface layer position [Supplementary Figure 2B]. The distance of each particle relative to the shell layer was calculated as ddepth. If
Radial distribution calculation
The three-dimensional centers of all NPs were localized, and the distance from each NP to the center was calculated. Particles within each concentric shell were counted and normalized by the corresponding shell volume. The shell thickness was set to 25 nm, and the innermost shell began at a radial distance of 50 nm from the center (to avoid large counting errors arising from the small volume near the center).
RESULTS AND DISCUSSION
Overall workflow
We propose the following items to systematically accelerate ET data acquisition: First, within or near the region of interest (ROI), the image shifts in the x- and y- directions along with defocus values are rapidly recorded at coarse tilt increments. These datasets are then used to fit the function of stage shifts and defocusing. Subsequently, the actual tilt series is acquired at fine angular increments with automated correction [Figure 1A and B]. Using this method, the total ROI acquisition time is reduced from 1 h 20 min to 9 min 54 s with high automation. Considering an electron beam in annular dark-field scanning TEM mode with a 50 pA beam current[39], the estimated total electron dose is reduced from 8.90 × 10³ e/Å2 to 988.7 e/Å2 - representing an 88.9% reduction, see details in Supplementary Table 1. The image difference of the projections at 0° before and after conventional/fast methods demonstrates that the fast method causes significantly less damage to MNPs@ZIF-8 samples than the conventional method [Figure 1C]. When MNPs@ZIF-8 is subjected to prolonged electron beam irradiation, the sample is at risk of damage and rotation, which constitutes the primary cause of ET reconstruction failure [Figure 1D(i)]. In contrast, the 3D volume reconstructed from fast ET acquisition method shows higher spatial accuracy [Figure 1D(ii)].
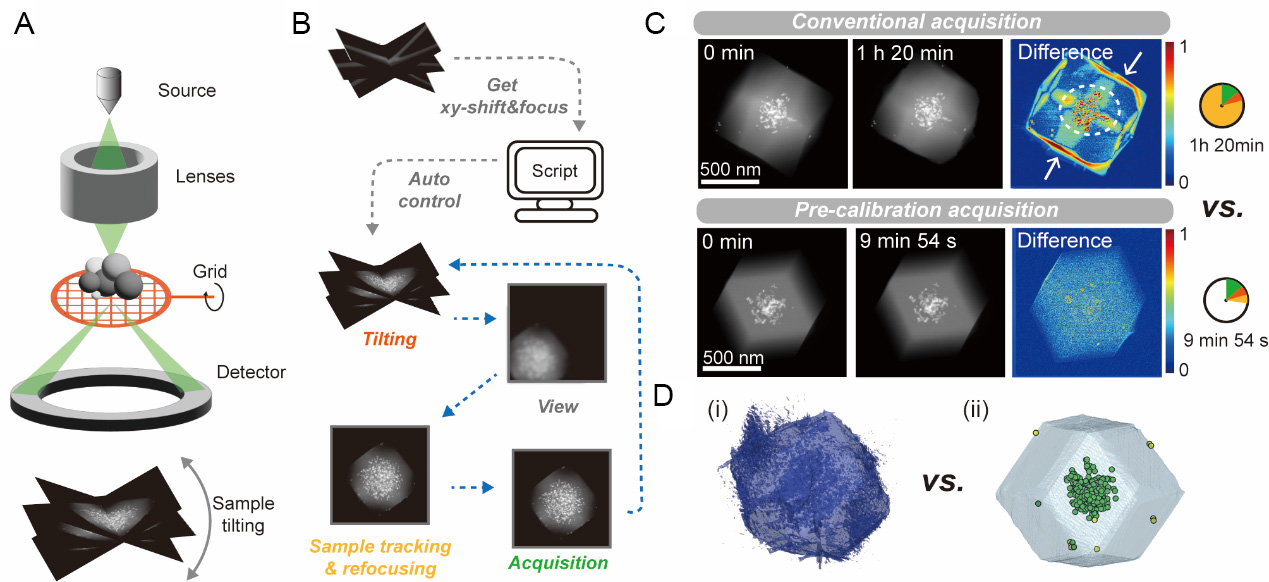
Figure 1. Pre-calibration fast ET acquisition method. (A) 3D ET scheme; (B) Workflow of pre-calibration fast ET series acquisition; (C) Comparison of conventional and pre-calibration acquisition in sample damage, with significant deformation regions clearly marked by white arrows and dashed borders; (D) Comparison of inaccurate reconstruction in conventional acquisition methods with accurate reconstruction in fast acquisition methods. ET: Electron tomography.
Implementation and performance testing of Fast ET acquisition
We specifically discussed the advantages of fast ET acquisition in reducing image drift and defocusing. Compared to the no-calibration method, the pre-calibration acquisition significantly minimized both image shifts (the maximum from ~ 2 μm to < 150 nm) and defocus values (the maximum from ~ 3 μm to < 250 nm), as shown in Figure 2A and B. To further investigate the impact of different calibration positions, we manually recorded multiple tilt-series datasets include xy-shifts and defocus values from reference position (A0), the identical position (A1~3), and two near positions (B for 2 μm offset, C for 10 μm offset), with 4° increments across ±65°, 33 in total, as shown in Figure 2C. The test results of stage xy-shifts offsets and defocus demonstrate reproducible behavior at both identical and near positions [Figure 2D-F]. Without pre-calibration, image shifts in x-direction (parallel to the tilt axis, the shift maximum is about 300 nm) are consistently smaller than those in y-direction (perpendicular to the tilt axis, shift maximum ~ 2 μm), consistent with previous studies[40].
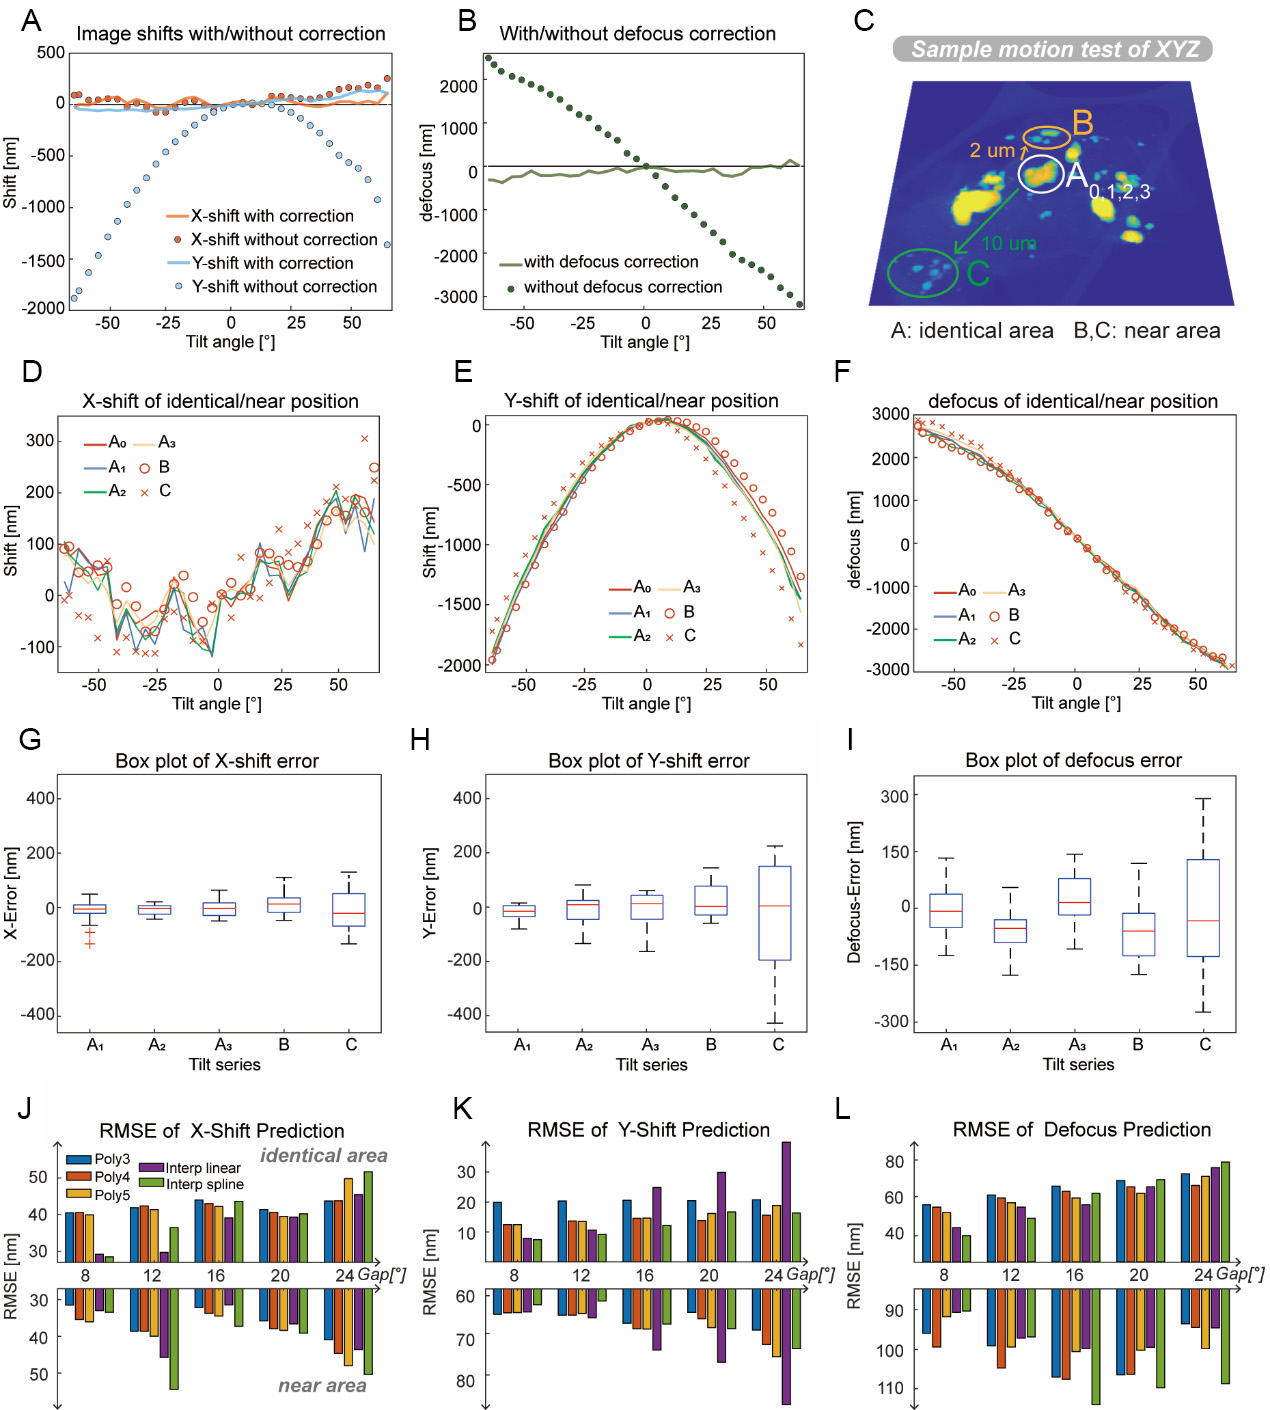
Figure 2. Implementation and performance testing of fast ET acquisition. (A and B) Comparison between conventional and pre-calibration acquisition in terms of image shifts and defocus values, respectively. The pre-calibration method significantly reduces both image shifts and defocus values; (C) Diagram of the measurement zone for assessing specimen movement reproducibility and predictability; (D-F) Repeatability of sample shifts in x-direction, y-direction and defocus value; (G-I) Box plot analysis of repetition error in x-direction, y-direction and defocus value. Sample size for each group is 33. Boxes represent the 25th–75th percentile intervals, and whiskers extend to 1.5 × IQR (interquartile range); (J-L) Prediction RMSE of x-shift, y-shift and defocus for different angular increment. Colored lines in subgraphs K and L are identical in meaning to those in subgraph J. ET: Electron tomography; RMSE root mean square error.
In order to quantify the reproducibility of stage shifts and defocus values, we calculated x-shift errors, y-shift errors and defocus errors of A1~3, B and C, presenting the results as box plots [Figure 2G-I, see details in Supplementary Tables 2-4]. The results demonstrate that stage shifts and defocus values acquired from near positions (B and C) exhibit larger errors compared to those collected at identical positions (A1~3). These errors increase progressively with the distance between the reference (A0) and test positions. The box plots also indicate that, with few exceptions, xy-shift errors in identical position acquisitions and near position B are constrained to within 200 nm. These errors primarily originate from mechanical vibrations of stage during tilting, which fundamentally limit the minimum acquirable window size in pre-calibration methods. Without additional manual adjustment, a margin of at least 200 nm must be reserved on all sides of the acquisition window to prevent sample drift beyond the imaging area. It is worth mentioning that data from position B exhibits consistent positive y-direction shifts relative to A0 between 25°-60° [Figure 2E]. A minor manual adjustment (applying a -80 nm image shift in the y-direction at 25°) can significantly reduce y-shift errors from [-55.0 nm, 128.9 nm] to [-55.0 nm, 54.1 nm], as shown in Supplementary Figure 3. This suggests that simple manual adjustments could further decrease the necessary margins of this pre-calibration method. It is worth noting that the safety window may vary depending on the mechanical stability of different electron microscope sample stages.
After verifying the reproducibility of stage shifts and defocus during tilting, we evaluated the types and parameters of the fitting functions. Pre-calibration data, consisting of a subset of the A0 or B data, are used to fit multiple polynomial and interpolation functions that predict image shifts and defocus values at other tilt angles. The root mean square error (RMSE) between A3 data and predicted data is utilized to assess the prediction accuracy of the fitted functions[Figure 2J-L]. The subsets are constructed using anchor points selected at varying angular increments (8°, 12°, 16°, 20°, 24°). The results reveal that: (i) For both identical-position and near-position predictions, the RMSE of x-direction functions falls within 25-60 nm; (ii) y-direction prediction functions exhibit RMSE of 5-40 nm (identical-position) and 60-90 nm (near-position) respectively; (iii) Defocus value predictions show RMSE ranging from 40-80 nm (identical-position) and 90-115 nm (near-position). Considering both inherent prediction inaccuracies and reproducibility errors across tilt series, these observed deviations fall within expected ranges. Fitting functions utilizing more anchor points (or smaller angular increments) demonstrate improved prediction accuracy, particularly in the y-direction. Regarding the type of fitting function, interpolation methods generally outperform with abundant anchor points, while polynomial fitting exhibits better stability with fewer anchor points. In addition, the images acquired using the rapid method exhibit sufficiently high integrity and clarity, which validates the effectiveness of sample motion and defocus (see Comparison of fast and conventional acquisition Section, and Supplementary Figures 4 and 5 in Supplementary Materials for details).
3D ET of MNPs@ZIF-8
The standard Au NPs@ZIF-8 is synthesized following established methods[17], and characterized by TEM, energy dispersive X-ray spectroscopy (EDS) mapping, and powder X-ray diffraction (XRD), as shown in Supplementary Figure 6. Subsequent synthesis is performed following a controlled-variable approach, yielding various samples as summarized in Supplementary Table 5. The developed fast ET method is employed to study the 3D architecture of MNPs@ZIF-8 (see MNPs@ZIF-8 series acquisition Section in Supplementary Materials for details), thereby establishing a direct relationship between synthesis parameters and 3D structural characteristic. Comparison of 0° projections before and after fast ET acquisition shows no detectable structural damage, confirming ET acquisition reliability [Supplementary Figure 7]. The dispersed MNPs (higher voxel intensity) are embedded in a ZIF-8 matrix (lower voxel intensity), and are observed both incorporated inside the matrix and attached to the surface, with distinct aggregations present in specific regions [Figure 3A]. The 3D coordinates of MNPs are determined from the 3D volumes based on the voxel intensity, enabling quantitative assessment of MNPs aggregation ratio and encapsulation efficiency [Figure 3B]. The spatial distribution patterns of MNPs are further quantified through NND distribution fitting and RD fitting, as shown in Figure 3C. The developed 3D voxel analysis workflow is universally applicable for structural investigations of diverse samples with various synthesis conditions, as shown in Figure 4.
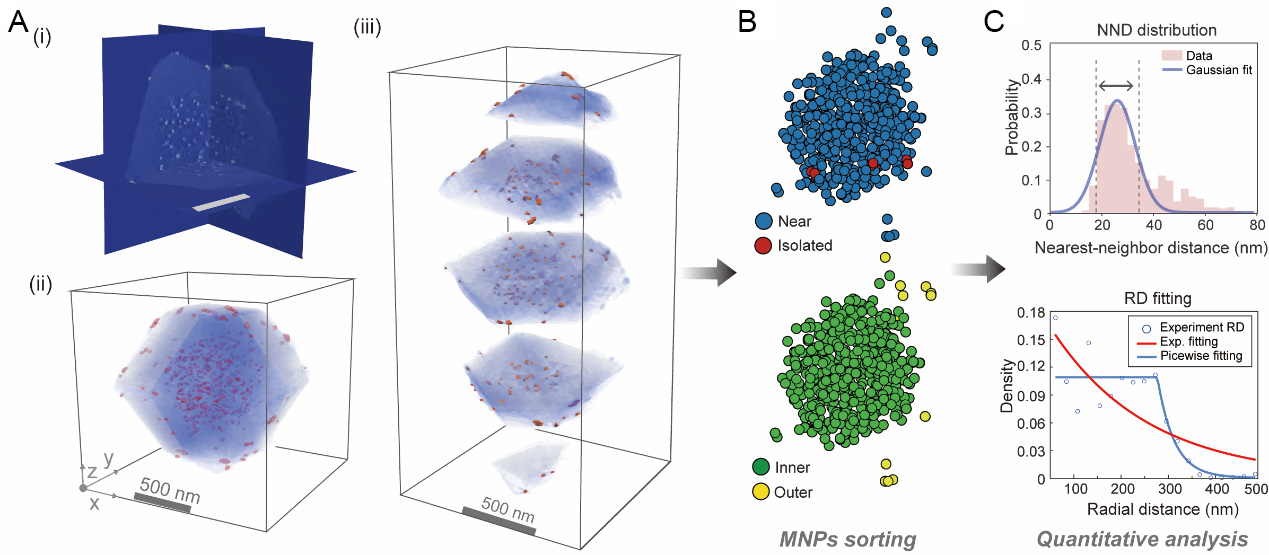
Figure 3. 3D reconstruction and quantitative analysis. (A) Orthogonal slices, 3D volume, and 3D sectioned views of MNPs@ZIF-8 samples exhibit intact ZIF-8 shells with clearly distinguishable MNPs; (B) Classification of aggregated and encapsulated MNPs; (C) NND distribution and RD analysis to characterize specific dispersion patterns and radial distribution features, respectively. NND: Nearest-neighbor distance; RD: radial distribution; MNPs@ZIF-8: metal nanoparticles encapsulated within zeolitic imidazolate framework-8.
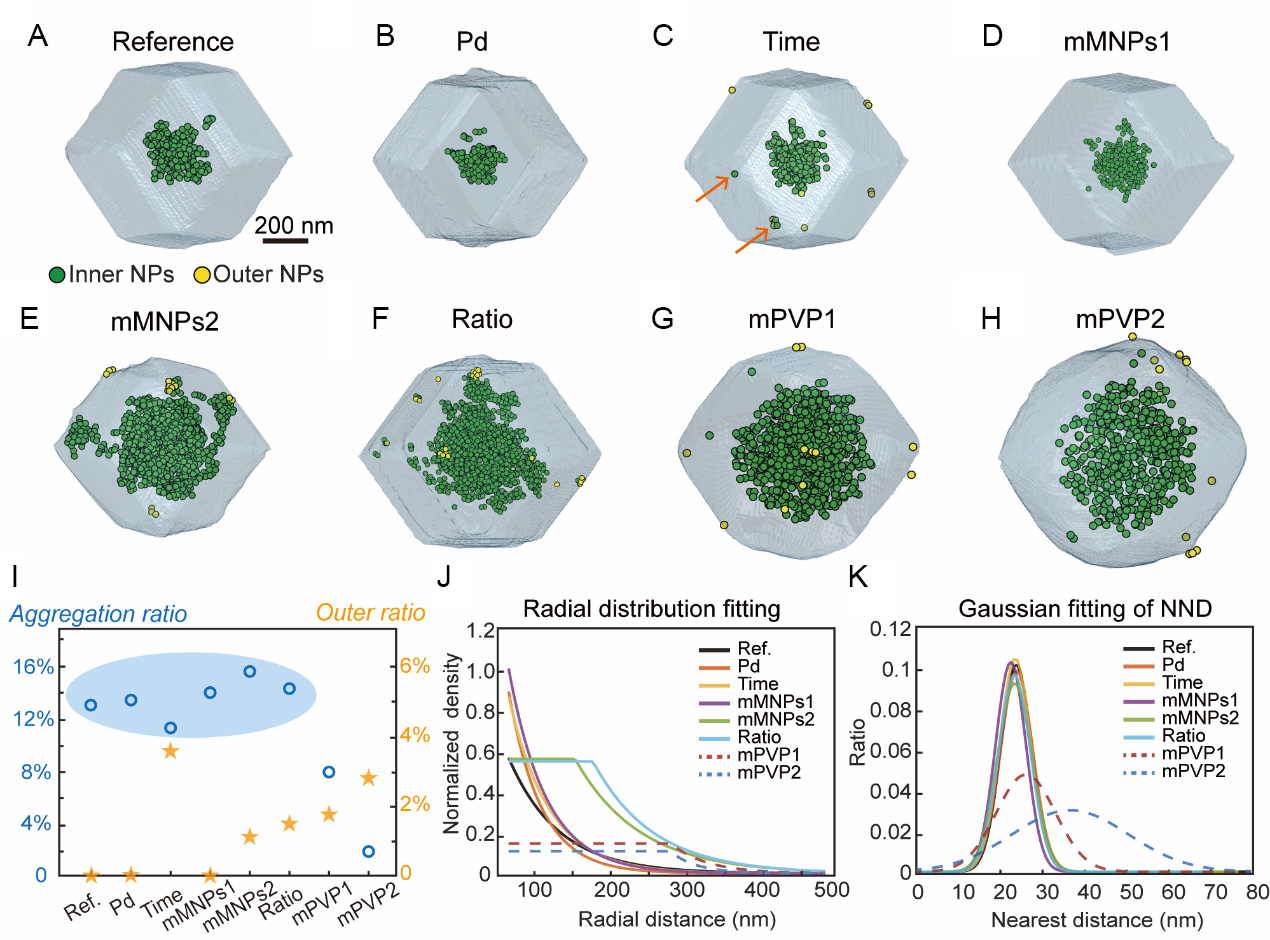
Figure 4. 3D architecture-synthesis relationship of MNPs@ZIF-8 samples. 3D volume of reference Au NPs@ZIF-8 (A); Pd NPs@ZIF-8 (B); samples with twice synthesis time (C); samples with 1.15 times, 2-fold MNPs concentration (D and E); samples with 1.25 times Zn2+: ligand ratio (F); 1 × 10⁻⁴ wt.% and 5 × 10⁻⁴ wt.% extra PVP addition samples (G and H); respectively; (I) Quantitative comparison of MNPs dispersion and encapsulation. Aggregation ratios of MNPs within blue circles shows approximate equivalence; (J) Radial distribution fitting curves of MNPs for all samples. Curves fit either exponential decay or “plateau + exponential decay” models; (K) Gaussian fitting of nearest-neighbor distances for all samples. Additional PVP specifically induces both peak shift and broadening in Gaussian fitting curves. The orange arrow in (C) points to the shallowly encapsulated MNPs. NP: Nanoparticle; MNP: metal nanoparticle; PVP: polyvinylpyrrolidone; NND: nearest-neighbor distance; MNPs@ZIF-8: metal nanoparticles encapsulated within zeolitic imidazolate framework-8.
Quantitative analysis of reference Au NPs@ZIF-8 sample reveals complete encapsulation of all 219 Au NPs within ZIF-8 matrix, with MNPs aggregation ratio of 12.8% [Figure 4A]. In Comparison to the reference sample, the Pd NPs@ZIF-8 sample exhibits similar MNPs distribution characteristics [Figure 4B], with comparable MNPs encapsulation efficiency, dispersion quality, and analogous RD and NND patterns. These results indicate that the type of MNPs has a limited effect on the 3D architecture of sample. This observation aligns with the known mechanism where Zn2+ sites on fresh ZIF-8 surfaces adsorb polyvinylpyrrolidone (PVP) capping agents of MNPs@PVP[6,10], thereby rendering MNPs dispersion largely independent of the MNPs core composition.
Extension of the synthesis time to 48 h results in the appearance of unencapsulated MNPs [Figure 4C]. Since the growth of ZIF-8 is basically completed within the standard reaction time, the ions and ligands in the solution are insufficient to support the growth of new ZIF-8 shells. Subsequent reaction leads to the adsorption of residual free MNPs onto the ZIF-8 surface. Interestingly, along with unencapsulated MNPs, several MNPs are found to be shallowly encapsulated (orange arrows in Figure 4C). These shallowly encapsulated MNPs, which are also prevalent in other samples exhibiting external MNPs, are difficult to detect by conventional 2D projection techniques. In solution environments, ripened ZIF-8 undergoes dissolution-recrystallization dynamics[40], enabling partial internalization of surface-adsorbed MNPs into the ZIF-8 matrix to form shallow encapsulation structures.
We also investigated the influence of adjusting MNPs concentration and Zn2+: ligand ratio. At the moderately increased concentration (1.15×, named mMNPs1), both the quantity and encapsulation efficiency of MNPs remain comparable to the reference sample. In contrast, the higher concentration (2×, named mMNPs2) exhibits both greater abundance of encapsulated MNPs and the emergence of unencapsulated MNPs [Figure 4D and E]. Samples with higher Zn2+: ligand ratio exhibited similar encapsulation and agglomeration phenomena [Figure 4F]. Previous studies have indicated that an increased salt-to-ligand ratio suppresses the final yield of ZIF-8 and increases the particle size of ZIF-8[41]. This results in an increase in the relative concentration of MNPs when the Zn2+: ligand ratio is increased.
We further investigated the effect of extra PVP addition: a sample with an extra 1 × 10⁻⁴ wt.% PVP addition (denoted as mPVP1) and another with an extra 5 × 10⁻⁴ wt.% PVP addition (denoted as mPVP2), as shown in Figure 4G and H. The extra addition of PVP significantly reduces the aggregation ratio of MNPs, and this trend became more pronounced as the PVP addition increase [Figure 4I]. Unencapsulated particles are also detected, and their fraction increases proportionally with the PVP concentration. Previous studies have indicated that the introduction of additional PVP molecules competitively occupies the adsorption active sites originally available for MNPs@PVP[42]. This leads to a sparse distribution of adsorption sites on the ZIF-8 shell, thereby causing the MNPs to exhibit enhanced dispersibility.
Insight into the radial characteristics of MNPs is essential for the mechanistic understanding of the encapsulation process. We conduct a discussion on the RD of all the above-mentioned samples, and the results reveals two distinct distribution patterns [Figure 4J]. For Type I (Ref., Pd, Time and mMNPs1), the RD fitting curves follow an exponential decay pattern, as shown in Supplementary Figure 8A-D. This RD features correlates with the temporal decrease in MNPs concentration during synthesis. During the initial nucleation stage of ZIF-8, the high concentration of free MNPs exhibits higher adsorption probability. As ZIF-8 growth progresses, the concentration of available MNPs decreases, leading to a corresponding reduction in adsorption probability. For Type II (mMNPs2, Ratio, mPVP1 and mPVP2), The fitting curves are better described by a piecewise function combining a saturation plateau with exponential decay [Supplementary Figure 8E-H]. The detailed parameters of the RD fit are shown in Supplementary Tables 6 and 7. The observed plateau in the RD profiles suggest saturation behavior in the MNPs adsorption process. All four conditions in Type II are designed to increase the relative concentration between MNPs and adsorption sites. Specifically, mMNPs2 achieves this by raising the MNP concentration, while Ratio, mPVP1, and mPVP2 work by reducing the concentration of ZIF-8 adsorption sites. This saturation of adsorption sites during the initial stage generates a characteristic plateau in the RD profile. As the reaction progresses, the continuing growth of ZIF-8 provides an increasing number of adsorption sites, while the concentration of free MNPs decreases. This dynamic disrupts the initial saturation state, causing the RD profile to transition into an exponential decay mechanism. Interestingly, the RD plateau of mPVP1 and mPVP2 are notably lower [Figure 4J]. This can be attributed to extra PVP’s mechanism: it preferentially occupies adsorption sites on the ZIF-8 shell, which consequently depresses the maximum saturation plateau.
While the aggregation ratio metric can reflect the degree of MNPs dispersion, its “dichotomous” evaluation method is unable to reveal the continuous distribution characteristics of MNPs. To address this, we introduce NND analysis to provide a more refined statistical description of the spatial arrangement. The NND follows single-peaked Gaussian distribution, which reflects MNPs exhibit isotropic, random dispersion in 3D space [Supplementary Figure 9 and Figure 4K]. The fitting parameters summarized in Supplementary Table S8. The fitting curves for samples without extra PVP addition are remarkably consistent (peak: ~ 23 nm, full width at half maximum, FWHM: ~ 9 nm), which reflects that the MNPs in these samples possess highly similar interparticle distances and dispersion uniformity. These conditions do not affect the actual dispersion characteristics of the MNPs. In comparison, extra PVP addition samples exhibited concentration-dependent positive shifts in peak position (mPVP1: 25.03 nm, mPVP2: 36.57 nm) and concomitant broadening of FWHM (mPVP1: 16.59 nm, mPVP2: 32.60 nm). The positive shift in peak position reflects an increase in the average NND between MNPs. Given the constant MNPs size, this increased interparticle distance directly accounts for the observed reduction in the aggregation fraction. Furthermore, the concurrent broadening of FWHM indicates that the increase in NND is spatially heterogeneous. Free-state PVP molecules stochastically block ZIF-8 adsorption sites, thereby inducing a more disordered spatial distribution of MNPs. This contrasts with an alternative mode where PVP preferentially forms rigid steric barriers around MNPs - a scenario that would not produce significant FWHM broadening accompanying the peak shift.
CONCLUSION
In summary, we developed a fast ET acquisition approach that reduces tilt series acquisition time from 1 h 20 min to 9 min 54 s and decreases the cumulative electronic dose by 88.9%. Applying this method, we identified the 3D coordination, encapsulation efficiency, aggregation ratio, RD and NND features of active phases in MNPs@ZIF-8 system. Unlike the ambiguous distribution assessment based on 2D projections, accurate 3D reconstruction enables accurately quantitative characterization of the dispersity and distribution features of active phases with high spatial resolution, thereby guiding structure-oriented rational design. Our work provides a straightforward approach for accurate 3D reconstruction of MOFs-based encapsulation materials. This structural assessment and mechanism elucidation based on precise 3D information holds promise for application in other complex systems.
DECLARATIONS
Acknowledgments
The authors greatly appreciate the support by Transmission Electron Microscope Platform of the Fujian Science & Technology Innovation Laboratory for Optoelectronic Information of China.
Authors’ contributions
Investigation: Ma, K.
Methodology development: Ma, K.
Data acquisition and analysis: Ma, K.
Visualization: Ma, K.
Writing of the original manuscript: Ma, K.
Data collection and analysis: Yu, L.; Wang, B.; Zhu, J.
Project supervision: Feng, S.
Directing the study: Feng, S.
Manuscript revision: Feng, S.
Project administration: Han, L.
Funding acquisition: Han, L.
Resources: Han, L.
Supervision: Han, L.
Writing - review & editing: Han, L.
Availability of data and materials
All data within the article and the Supplementary Materials that support the findings of this study are available, or from the corresponding authors upon request.
AI and AI-assisted Tools Statement
Not applicable.
Financial support and sponsorship
This work was supported by the National Key R&D Program of China (2022YFA1505700), National Natural Science Foundation of China (22475214 and 22205232), Talent Plan of Shanghai Branch, Chinese Academy of Sciences (CASSHB-QNPD-2023-020), Natural Science Foundation of Fujian Province (2023J06044 and 2024J08292), and Self-deployment Project Research Program of Haixi Institutes, Chinese Academy of Sciences (CXZX-2022-JQ06 and CXZX-2022-GH03).
Conflicts of interest
All authors declared that there are no conflicts of interests.
Ethical approval and consent to participate
Not applicable.
Consent for publication
Not applicable.
Copyright
© The Author(s) 2026.
Supplementary Materials
REFERENCES
1. Wu, Q.; Liang, J.; Wang, D.; Wang, R.; Janiak, C. Host molecules inside metal-organic frameworks: host@MOF and guest@host@MOF (Matrjoschka) materials. Chem. Soc. Rev. 2025, 54, 601-22.
2. Zhang, J.; Zhang, X.; Fang, K.; et al. Efficient glycerol oxidation on PMo12‐encapsulated MOF‐74 electrocatalyst coupled with hydrogen evolution at industrial-level current density. Adv. Funct. Mater. 2025, 35, 2502616.
3. Wang, J.; Gao, Z.; Jia, Y.; et al. MAPbBr3 quantum dots encapsulated within lanthanide-MOFs for time-resolved multicolor dynamic anticounterfeiting. Adv. Mater. 2025, 37, 2501271.
4. Yu, C.; Zhang, W.; Xian, M.; et al. Copper azide nanoparticle-encapsulating MOF-derived porous carbon: electrochemical preparation for high-performance primary explosive film. Small 2022, 18, 2107364.
5. Suresh, K.; Matzger, A. J. Enhanced drug delivery by dissolution of amorphous drug encapsulated in a water unstable metal-organic framework (MOF). Angew. Chem. Int. Ed. 2019, 58, 16790-4.
6. Vijayakumar, E.; Ramakrishnan, S.; Sathiskumar, C.; et al. MOF-derived CoP-nitrogen-doped carbon@NiFeP nanoflakes as an efficient and durable electrocatalyst with multiple catalytically active sites for OER, HER, ORR and rechargeable zinc-air batteries. Chem. Eng. J. 2022, 428, 131115.
7. Li, G.; Zhao, S.; Zhang, Y.; Tang, Z. Metal-organic frameworks encapsulating active nanoparticles as emerging composites for catalysis: recent progress and perspectives. Adv. Mater. 2018, 30, 1800702.
8. Pan, T.; Khalil, I. E.; Xu, Z.; et al. Spatial compartmentalization of metal nanoparticles within metal-organic frameworks for tandem reaction. Nano. Res. 2021, 15, 1178-82.
9. Wu, C.; Luo, M.; Zhao, Y.; et al. CO2 hydrogenation using MOFs encapsulated PdAg nano-catalysts for formate production. Chem. Eng. J. 2023, 475, 146411.
10. Chen, L.; Luque, R.; Li, Y. Controllable design of tunable nanostructures inside metal-organic frameworks. Chem. Soc. Rev. 2017, 46, 4614-30.
11. Gao, C.; Lyu, F.; Yin, Y. Encapsulated metal nanoparticles for catalysis. Chem. Rev. 2020, 121, 834-81.
12. Ke, F.; Yuan, J.; Zhang, C.; Ye, S.; Ramachandraiah, K.; Pang, H. Core-shell nanostructured metal-organic frameworks with encapsulated magnetic nanoparticles for magnetically recyclable catalysis. Coord. Chem. Rev. 2024, 518, 216116.
13. He, H.; Li, L.; Liu, Y.; et al. Rapid room-temperature synthesis of a porphyrinic MOF for encapsulating metal nanoparticles. Nano. Res. 2020, 14, 444-9.
14. Dhaoui, R.; Cazarez, S. L.; Xing, L.; et al. 3D visualization of proteins within metal-organic frameworks via ferritin-enabled electron microscopy. Adv. Funct. Mater. 2023, 34, 2312972.
15. Dai, S.; Ngoc, K. P.; Grimaud, L.; Zhang, S.; Tissot, A.; Serre, C. Impact of capping agent removal from Au NPs@MOF core-shell nanoparticle heterogeneous catalysts. J. Mater. Chem. A. 2022, 10, 3201-5.
16. Yang, Q.; Liu, W.; Wang, B.; et al. Regulating the spatial distribution of metal nanoparticles within metal-organic frameworks to enhance catalytic efficiency. Nat. Commun. 2017, 8, 14429.
17. Li, S.; Huo, F. Hybrid crystals comprising metal-organic frameworks and functional particles: synthesis and applications. Small 2014, 10, 4371-8.
18. Lu, G.; Li, S.; Guo, Z.; et al. Imparting functionality to a metal-organic framework material by controlled nanoparticle encapsulation. Nature. Chem. 2012, 4, 310-6.
19. Meledina, M.; Watson, G.; Meledin, A.; Van Der Voort, P.; Mayer, J.; Leus, K. Ru Catalyst encapsulated into the pores of MIL-101 MOF: direct visualization by TEM. Materials 2021, 14, 4531.
20. Li, L.; Li, Z.; Yang, W.; et al. Integration of Pd nanoparticles with engineered pore walls in MOFs for enhanced catalysis. Chem 2021, 7, 686-98.
21. Deng, T.; Shi, X.; Zhang, W.; Wang, Z.; Zheng, W. In-plane assembly of distinctive 2D MOFs with optimum supercapacitive performance. iScience 2020, 23, 101220.
22. Wang, X.; Peng, Z.; Zhou, W.; et al. Ligand modulation in metal-organic frameworks derived regenerable oxygen evolution electrocatalysts. Angew. Chem. Int. Ed. 2025, 64, e202504148.
23. Yan, J.; Gao, C.; Qi, S.; et al. Encapsulation of nano-Si into MOF glass to enhance lithium-ion battery anode performances. Nano. Energy. 2022, 103, 107779.
24. Ogata, A. F.; Rakowski, A. M.; Carpenter, B. P.; et al. Direct observation of amorphous precursor phases in the nucleation of protein-metal-organic frameworks. J. Am. Chem. Soc. 2020, 142, 1433-42.
25. Wu, X.; Yue, H.; Zhang, Y.; et al. Packaging and delivering enzymes by amorphous metal-organic frameworks. Nat. Commun. 2019, 10, 5165.
26. Qi, Z.; Pei, Y.; Goh, T. W.; et al. Conversion of confined metal@ZIF-8 structures to intermetallic nanoparticles supported on nitrogen-doped carbon for electrocatalysis. Nano. Res. 2018, 11, 3469-79.
27. Girod, R.; Lazaridis, T.; Gasteiger, H. A.; Tileli, V. Three-dimensional nanoimaging of fuel cell catalyst layers. Nat. Catal. 2023, 6, 383-91.
28. Yu, K.; Li, C.; Xie, J.; Ferreira, P. J. Understanding the degradation mechanisms of Pt electrocatalysts in PEMFCs by combining 2D and 3D identical location TEM. Nano. Lett. 2023, 23, 1858-64.
29. Ma, K.; Feng, S.; Hu, H.; Cai, Y.; Chen, D.; Han, L. Deep learning-based workflow for atomic image denoising and chemical identification. Chin. J. Struct. Chem. 2025, 44, 100572.
30. Zhang, L.; Hu, H.; Sun, C.; et al. Bimetallic nanoalloys planted on super-hydrophilic carbon nanocages featuring tip-intensified hydrogen evolution electrocatalysis. Nat. Commun. 2024, 15, 7179.
31. Song, H.; Yang, Y.; Geng, J.; Gu, Z.; Zou, J.; Yu, C. Electron tomography: a unique tool solving intricate hollow nanostructures. Adv. Mater. 2018, 31, 1801564.
32. Hugenschmidt, M.; Jannis, D.; Kadu, A. A.; et al. Low-dose 4D-STEM tomography for beam-sensitive nanocomposites. ACS. Materials. Lett. 2023, 6, 165-73.
33. Esken, D.; Turner, S.; Lebedev, O. I.; Van Tendeloo, G.; Fischer, R. A. Au@ZIFs: stabilization and encapsulation of cavity-size matching gold clusters inside functionalized zeolite imidazolate frameworks, ZIFs. Chem. Mater. 2010, 22, 6393-401.
34. Chen, Y.; Gu, B.; Uchida, T.; et al. Location determination of metal nanoparticles relative to a metal-organic framework. Nat. Commun. 2019, 10, 3462.
35. Albrecht, W.; Bals, S. Fast electron tomography for nanomaterials. J. Phys. Chem. C. 2020, 124, 27276-86.
36. Koneti, S.; Roiban, L.; Dalmas, F.; et al. Fast electron tomography: applications to beam sensitive samples and in situ TEM or operando environmental TEM studies. Mater. Charact. 2019, 151, 480-95.
37. Zhang, M.; Yang, Y.; Li, C.; Liu, Q.; Williams, C. T.; Liang, C. PVP-Pd@ZIF-8 as highly efficient and stable catalysts for selective hydrogenation of 1,4-butynediol. Catal. Sci. Technol. 2014, 4, 329-32.
38. Yang, Y.; Chen, C.; Scott, M. C.; et al. Deciphering chemical order/disorder and material properties at the single-atom level. Nature 2017, 542, 75-9.
39. Vanrompay, H.; Skorikov, A.; Bladt, E.; et al. Fast versus conventional HAADF-STEM tomography of nanoparticles: advantages and challenges. Ultramicroscopy 2021, 221, 113191.
40. Cravillon, J.; Schröder, C. A.; Nayuk, R.; Gummel, J.; Huber, K.; Wiebcke, M. Fast nucleation and growth of ZIF‐8 nanocrystals monitored by time-resolved in situ small-angle and wide-angle X-ray scattering. Angew. Chem. Int. Ed. 2011, 50, 8067-71.
41. Troyano, J.; Carné-Sánchez, A.; Avci, C.; Imaz, I.; Maspoch, D. Colloidal metal-organic framework particles: the pioneering case of ZIF-8. Chem. Soc. Rev. 2019, 48, 5534-46.
Cite This Article
 Open Access
How to Cite
Download Citation
Export Citation File:
Type of Import
Tips on Downloading Citation
Citation Manager File Format
Type of Import
Direct Import: When the Direct Import option is selected (the default state), a dialogue box will give you the option to Save or Open the downloaded citation data. Choosing Open will either launch your citation manager or give you a choice of applications with which to use the metadata. The Save option saves the file locally for later use.
Indirect Import: When the Indirect Import option is selected, the metadata is displayed and may be copied and pasted as needed.
About This Article
Special Topic
Copyright

Data & Comments
Data
0










Comments
Comments must be written in English. Spam, offensive content, impersonation, and private information will not be permitted. If any comment is reported and identified as inappropriate content by OAE staff, the comment will be removed without notice. If you have any queries or need any help, please contact us at [email protected].