

fig2
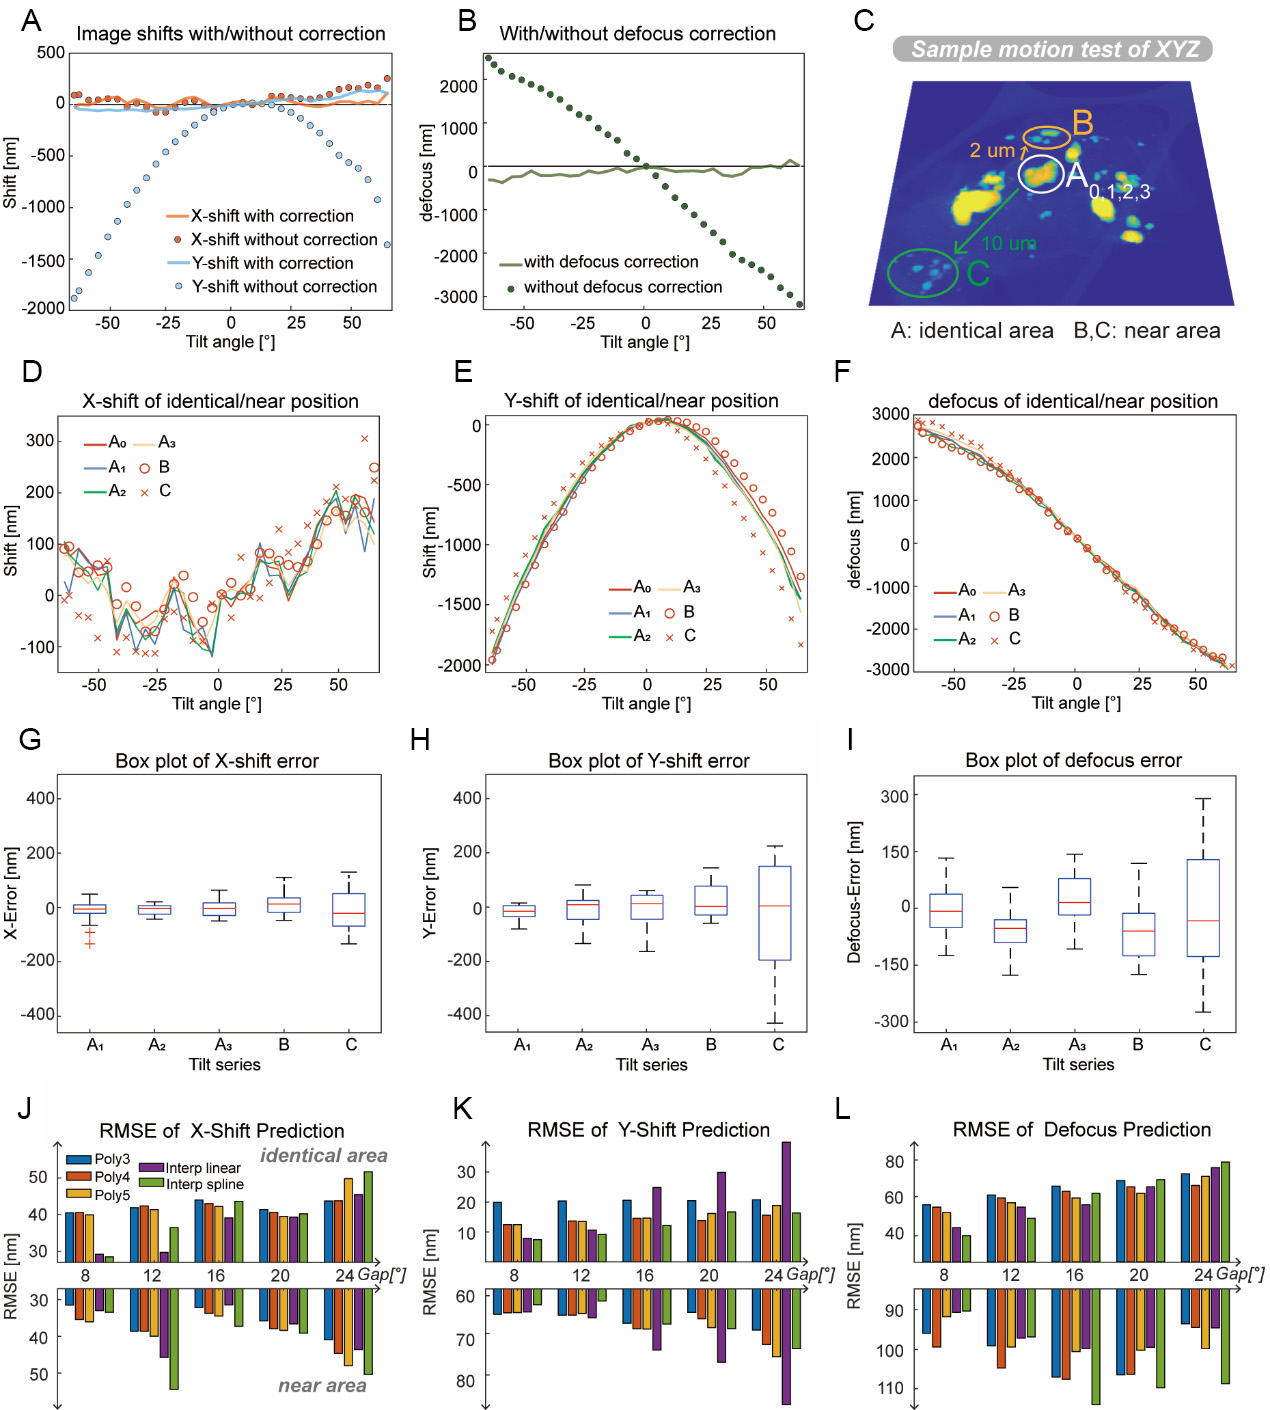
Figure 2. Implementation and performance testing of fast ET acquisition. (A and B) Comparison between conventional and pre-calibration acquisition in terms of image shifts and defocus values, respectively. The pre-calibration method significantly reduces both image shifts and defocus values; (C) Diagram of the measurement zone for assessing specimen movement reproducibility and predictability; (D-F) Repeatability of sample shifts in x-direction, y-direction and defocus value; (G-I) Box plot analysis of repetition error in x-direction, y-direction and defocus value. Sample size for each group is 33. Boxes represent the 25th–75th percentile intervals, and whiskers extend to 1.5 × IQR (interquartile range); (J-L) Prediction RMSE of x-shift, y-shift and defocus for different angular increment. Colored lines in subgraphs K and L are identical in meaning to those in subgraph J. ET: Electron tomography; RMSE root mean square error.





