


Void bias in irradiated model metals
 0
0 
Abstract
Void swelling plays a critical role in the microstructural evolution and mechanical property degradation observed in irradiated materials. The preferential absorption of mobile point defects by microstructural sinks (e.g., dislocations) is postulated to be the driving force behind this phenomenon. While most studies treat voids as neutral sinks, this assumption has been challenged both theoretically and experimentally, emphasizing the necessity of quantitatively determining the void bias under various irradiation conditions. This study employs a state-of-the-art atomistic Kinetic Monte Carlo approach to determine the void bias in irradiated pure Fe, Cu, and Ni, examining the effects of size, temperature, density, and void morphology. Our findings reveal that voids in all examined metals act as non-neutral sinks for mobile point defects, particularly at small sizes (e.g., ~2 nm). Furthermore, this study demonstrates that voids have lower efficiency in absorbing mobile point defects compared to dislocation loops and stacking fault tetrahedra. These findings provide quantitative estimates of the competition of different sinks, which is responsible for the growth and shrinkage of voids under different irradiation conditions. The implications of void bias on swelling rate calculations in both fcc and bcc metals are also discussed, offering crucial insights for predicting void swelling behaviors, microstructure evolutions, and related properties in irradiated metals.
Keywords
INTRODUCTION
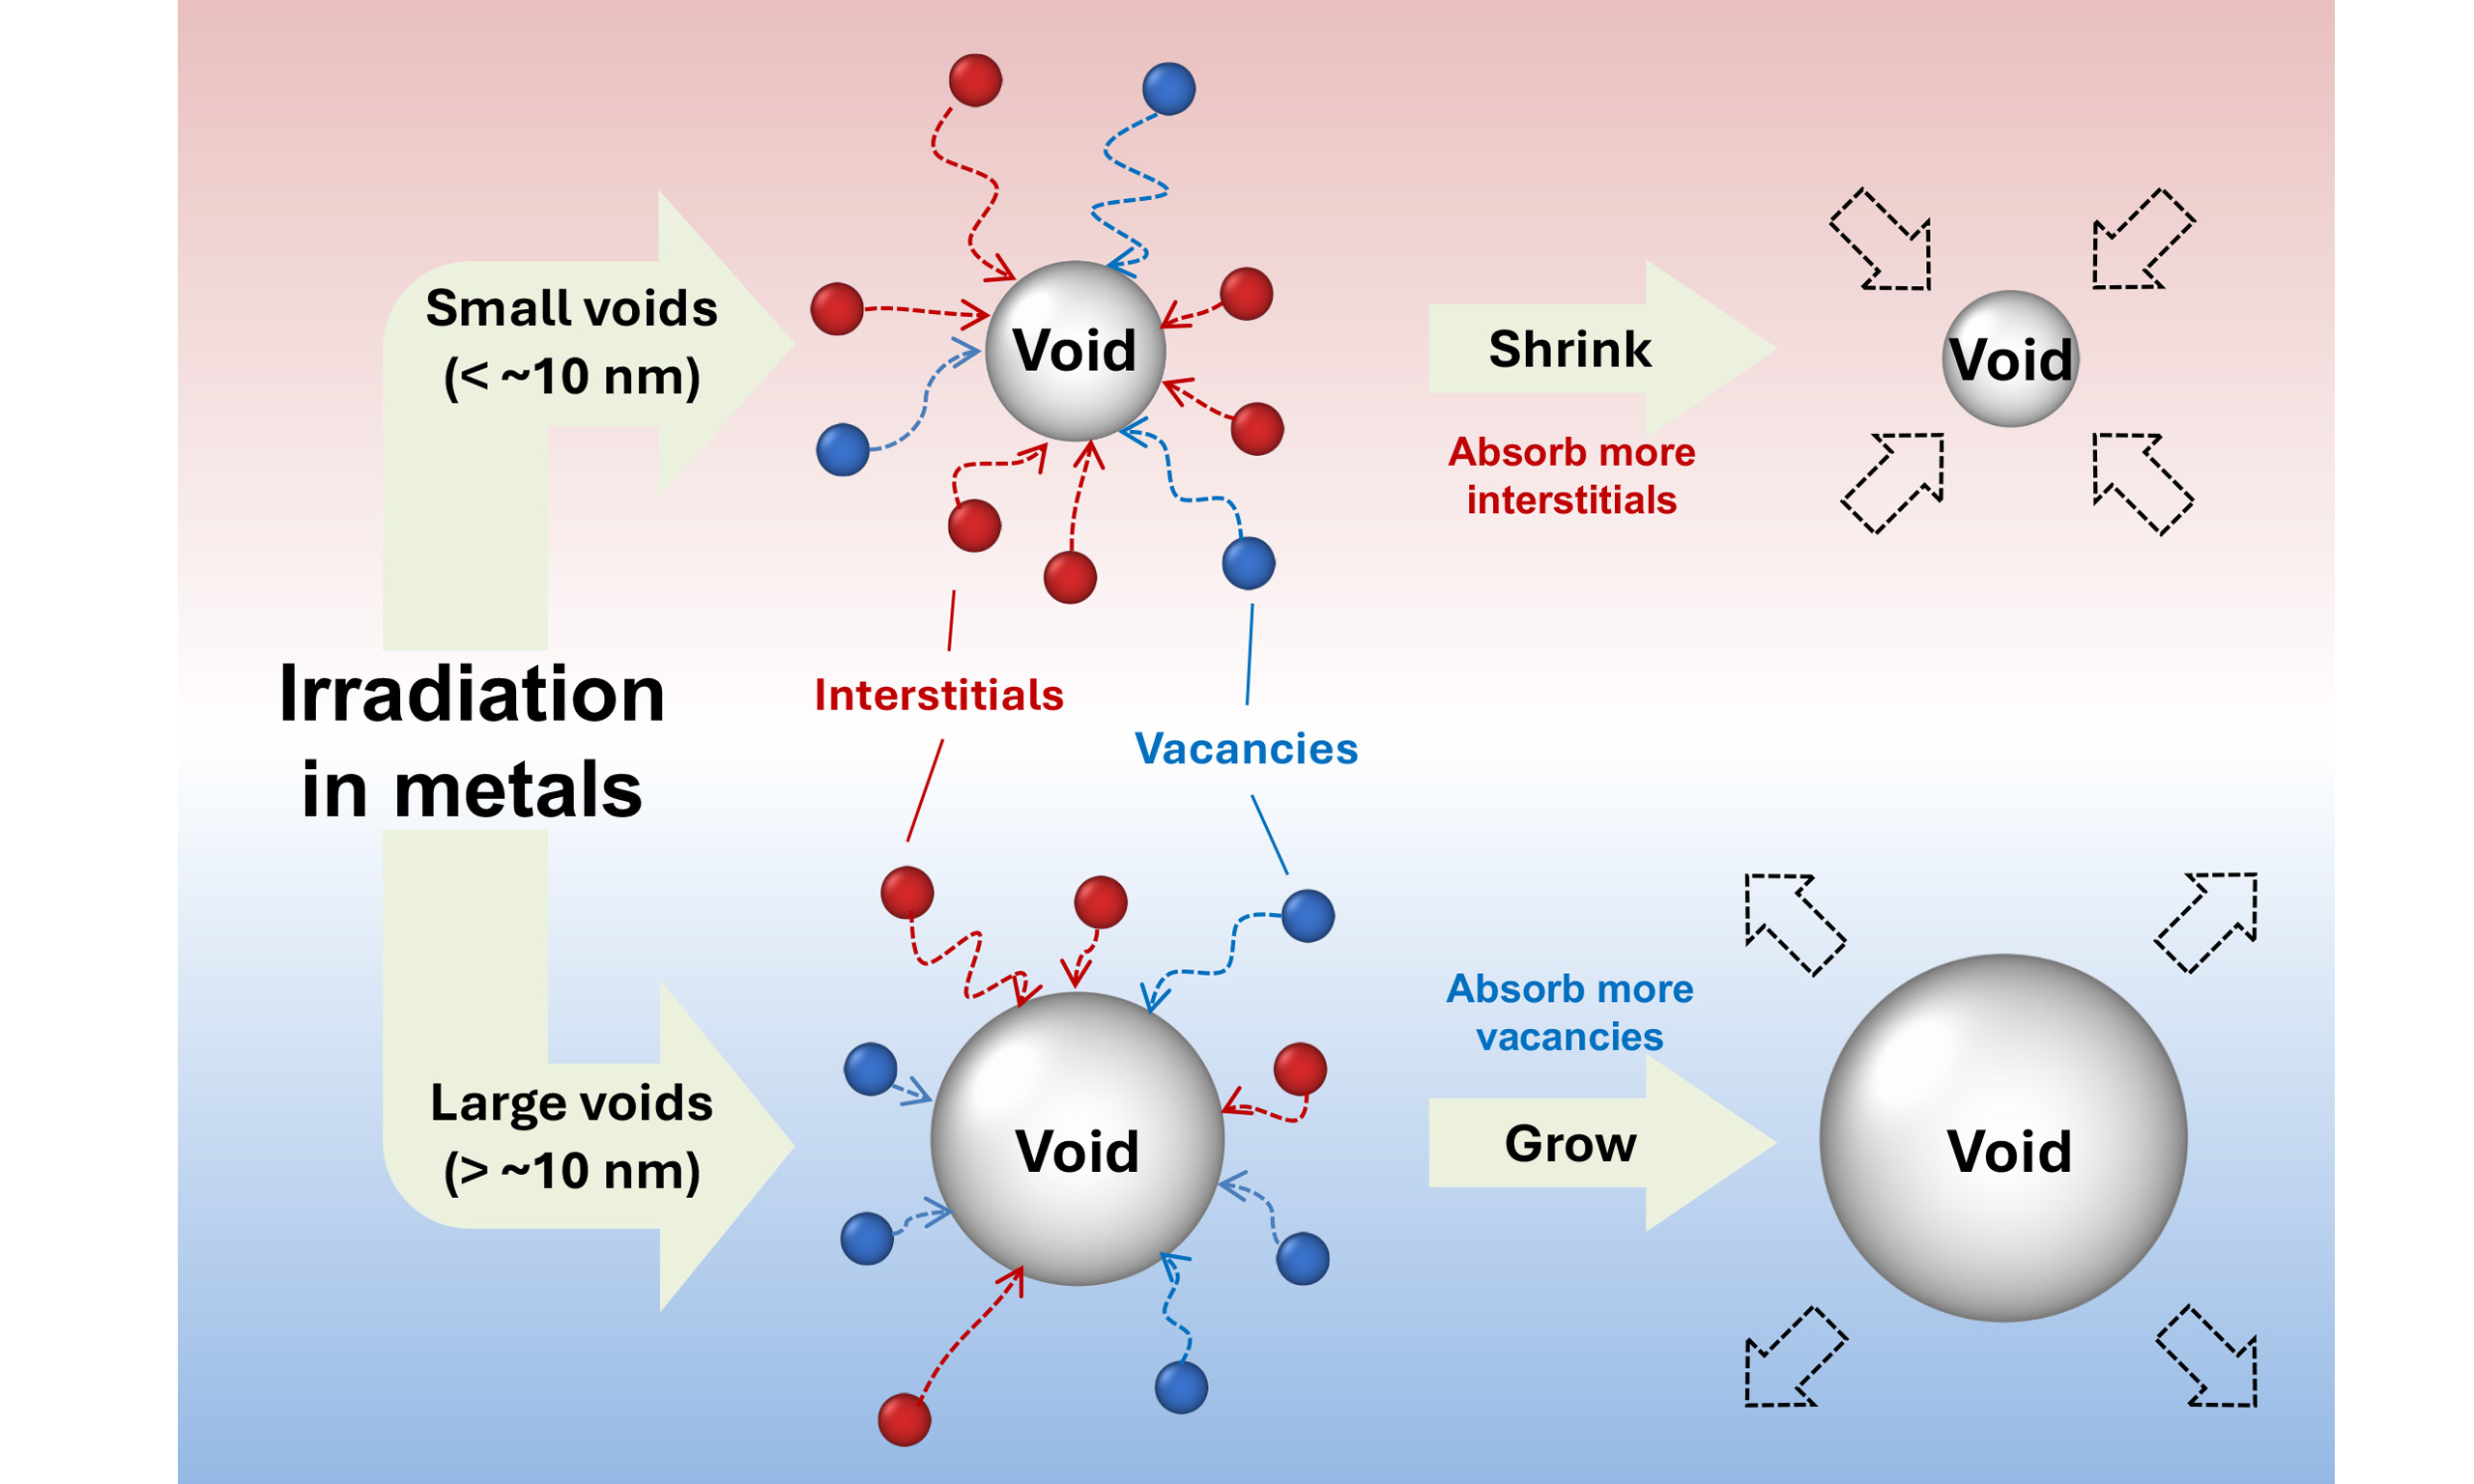
Void swelling is a key degradation phenomenon that may cause intolerable volumetric expansion in irradiated metals and alloys[1,2]. The underlying mechanism of this phenomenon is known as the bias of microstructural sinks[3]. For instance, dislocations have long been considered to absorb more self-interstitials (SIAs) than vacancies, resulting in an excess concentration of vacancies and the growth of voids[4]. Thus, the bias of each type of sink is crucial for microstructural evolutions and swelling behaviors in irradiated materials. Since voids serve as reference sinks for the point defect flux[5], their bias is critical for understanding and predicting void swelling[6]. Furthermore, the void bias has crucial implications for dislocation loop nucleation and growth[7], radiation-induced segregation[8], and irradiation hardening[9] in irradiated materials. These phenomena are highly correlated and determined by the competitive absorption of mobile point defects among various sinks. In many studies[5,10-13], voids are assumed to be neutral sinks, with their bias neglected in void swelling calculations (e.g., flux models). However, this cannot explain the experimental observations that voids may shrink or grow under different irradiation conditions[14-24]. The underlying challenge is that void swelling is inherently multiscale in both length and time and depends on the capture efficiencies and sink strengths of all relevant sinks, despite the long history of studying void swelling in structural materials.
Following the initial observation of voids in irradiated steels[14], subsequent studies using a high-voltage electron microscope (HVEM) in annealed nickel[16] and neutron-irradiated stainless steel[17] revealed void growth. Both works reported a rapid increase in void size alongside a decrease in void number density with rising irradiation temperature, highlighting the importance of incorporating voids as point defect sinks in theoretical models. The bias model was then developed to elucidate the underlying mechanism of void growth[6], suggesting a lower void bias compared to dislocations or dislocation loops. However, Loomis and Gerber[18] observed both growth and shrinkage of voids in ion-irradiated Nb at varying temperatures, indicating evolving interactions between voids and mobile point defects. In a recent in situ Transmission Electron Microscopy (TEM) investigation, Chen et al. reported the shrinkage of voids in Kr-irradiated Ni below ~0.5 Tm (the melting temperature) and the growth above this temperature, with faster shrinkage noted for smaller voids[20]. This aligns with other heavy ion irradiation studies that observed the void shrinkage[21-24]. Small voids are suggested to capture point defects more rapidly and exhibit higher shrinkage rates than large voids in irradiated copper samples with abundant nanovoids and twin boundaries[22]. More recently, Niu et al. reported continuous shrinkage of pre-existing nanovoids in irradiated fcc copper[23,24]. Additionally, the shrinkage phenomenon was also observed for nanopores in Au[21], which was attributed to the higher tensile stress generated by smaller voids, leading to preferential absorption of mobile SIAs over vacancies. These experimental observations underscore the significant variability of void bias based on critical parameters such as void size and irradiation temperature.
Theoretically, most void bias calculations rely heavily on elasticity theory[6,13,25-27]. For instance, Wolfer and Ashkin[27] formulated equations grounded in elastic interactions between spherical voids and point defects in an idealized isotropic elastic medium, using a flux model. Their findings indicated a tendency for voids to preferentially absorb interstitials over vacancies, with void growth occurring only when interstitials interact more strongly with dislocations than with voids. This was subsequently supported by Dubinko et al., highlighting the importance of void size in absorbing SIAs and the consequent evolution of voids under irradiation[13]. To improve the accuracy, Borodin et al. delved into the anisotropic effects of point defect diffusion by introducing averaged point defect dipole tensors[28]. The significance of the anisotropic diffusion of point defects was then systematically determined by Carpentier et al.[29]. Additionally, several studies challenged the notion of voids as neutral sinks. For instance, a molecular dynamics (MD) study by
In this study, we have employed a recently developed atomistic kinetic Monte Carlo (AKMC) approach[31] to calculate the void bias in typical irradiated structural metals. This AKMC approach is found to yield quantitative agreement with experimental results for dislocation loops and SFTs. We focus on pure Cu, Ni, and Fe, considering the complexity of the problem, yet these metals also underpin many important alloys[1,2]. The factors that influence the void bias, as identified in previous theoretical studies[13,25,27,28,33,34], including void size, temperature, void density, and metal structures (bcc vs. fcc), are systematically examined. Experimental values of these parameters across different metals and irradiation conditions are employed in our model[36-39]. The effect of void morphology is also analyzed in this study, as various void shapes have been observed in experimental investigations[40-43]. Furthermore, a comparative assessment of point defect absorption efficiencies of major sinks in both bcc and fcc metals, including dislocations, dislocation loops, and stacking fault tetrahedra (SFTs, exclusively in fcc systems), is conducted. This simulation system has also been employed to calculate dislocation bias and loop bias in bcc Fe, exhibiting close alignment with experimental observations[31]. Using this model, a quantitative prediction of void swelling is feasible, regardless of the type of defect included.
METHODS
Simulation setup
The atomistic configurations of voids are constructed by removing the atoms in a spherical region of 2, 4, and 10 nm diameters using LAMMPS[44], followed by a relaxation process. The interatomic potentials for bcc Fe, fcc Cu, and fcc Ni are those developed by Ackland et al.[45], Mishin et al.[46], and Mendelev et al.[47], respectively. These potentials have been tested and used extensively for understanding irradiation effects in these systems.
The scheme of the atomistic KMC simulation system is provided in Figure 1. This AKMC simulation is employed to determine the lifetime of mobile point defects (both SIAs and vacancies), which is defined as the duration it takes for a point defect to diffuse from its initial position to the void. Point defects start their diffusion from the surface of this spherical simulation system. When a point defect diffuses out of the simulation system, another defect of the same type is randomly placed on the system surface. This ensures that the distance between the point defect and the void remains constant. Such a boundary condition is defined as Random Boundary Condition (RBC), which has been previously employed in dislocation bias calculations[48]. Periodic Boundary Conditions (PBCs) are avoided because the centrosymmetric strain field of the void imposes identical driving forces on the point defect before and after boundary crossing. This effect artificially influences the point defect diffusion but diminishes with increasing simulation system size. The time for each diffusive step is determined by the migration energy barrier (MEB) at its current atomic position and point defect configuration. The details of MEBs are shown in Section "Migration energy barriers". A point defect is considered absorbed upon entering the spontaneous absorption region (SAR). When a point defect diffuses into the SAR, it is considered spontaneously absorbed by the void. The SAR for the void is determined through binding energy calculations, with the criteria set as -0.1 eV for SIAs and
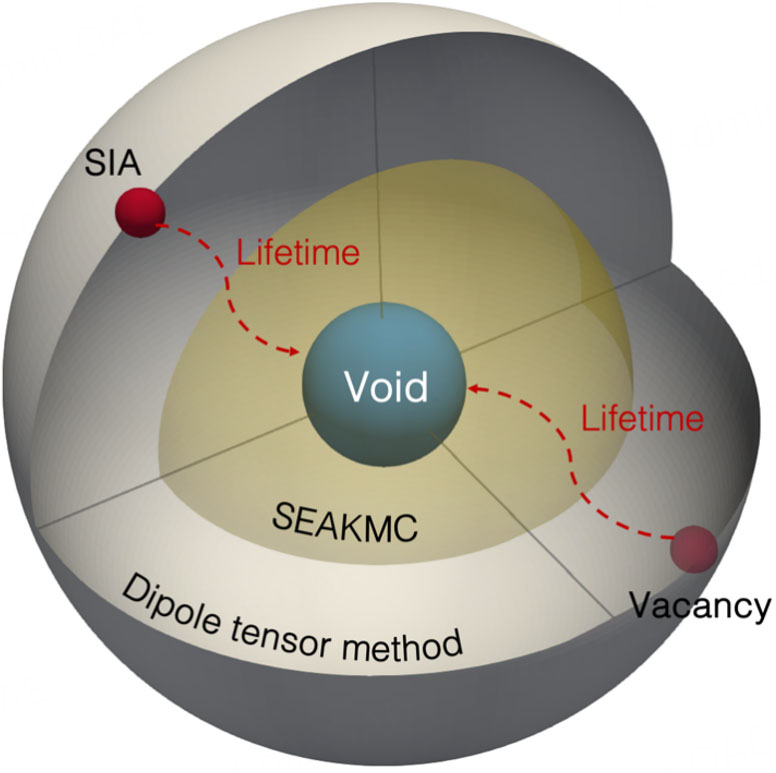
Figure 1. The scheme of the AKMC simulation system. The trajectories of mobile point defects are illustrated by dotted lines, starting from the boundary of the simulation system, and continuing until point defects are absorbed by the void. The duration along this trajectory is termed the lifetime.
Migration energy barriers
Migration energy barriers (MEBs) of mobile point defects are the saddle point energy when a point defect migrates to its first nearest neighbor lattice points, which is crucial for AKMC simulations and analyses of their interactions with sinks. The MEBs of two types of point defects, interstitials (dumbbells) and single vacancies, are considered in bcc Fe, fcc Cu, and fcc Ni. Specifically, for bcc iron, there are six dumbbell configurations (<110>, <101>, <011>, <1
To calculate the MEBs in the region close to the void, we use the self-evolving atomistic kinetic Monte Carlo (SEAKMC)[49], which accounts for the non-elastic interactions between a void and a point defect with atomistic fidelity. The point defect is inserted into the atomic system as the initial configuration, and the saddle point energies for migrations are obtained within an active volume, the radius of which is around
Beyond this core region, shown in grey in Figure 1, the dipole tensor method[29] based on elasticity theory is utilized for estimations of MEBs. The equations based on the elastic interactions between the point defect and the dislocation loop are listed below,
where εij is the strain tensor, Em is the point defect MEB considering elastic interaction, and
Void bias and sink strength using the KMC approach
In AKMC simulations, a random number is drawn to select one saddle point i from the saddle point list based on the relative probability Pi in each KMC step, which is given by,
where n represents the total number of saddle points for migrating to the first nearest neighbor. Γi is the probability of the diffusive step passing through the saddle point i,
where ν0 is the attempt frequency, which is set as 1012 s-1. Em,i stands for the MEB of saddle point i corresponding to a specific atomic position with a specific dumbbell configuration. k is Boltzmann’s constant, and T is the temperature in Kelvin. The lifetime of mobile point defect α (τα) is determined by summing the duration of each diffusive step (∆τ) using the residence-time algorithm,
where α is i or v for interstitials or vacancies, respectively, and the random number x
Subsequently, the capture efficiency is determined using a flux model[3], where, far from the sink, a reservoir of point defects exists, which is maintained at a constant concentration:
Note that Wolfer defined Zα as “bias” and B as “net bias”, which in this work correspond to the capture efficiency and bias, respectively. Thus, the capture efficiency of the void to point defect α is obtained as
where τα symbolizes the lifetime of the point defect when influenced by a void, while the superscript r denotes random walk, representing the absence of any interaction between the point defect and the void (MEBs are set to bulk values for random walk). The point defect random walk ends upon reaching the SAR. The bias of voids is derived based on the capture efficiency,
Moreover, the sink strength of a given void for point defect α (
where the capture efficiency Zα is introduced to represent the interactions between the void and point defect, and k2 represents the sink strength for random walks, where the elastic interactions are absent. This parameter is typically used to represent the interaction between mobile defects and the sink in rate theories, with higher values indicating stronger interactions. Here, the value of k2 can be obtained in the KMC simulation, where only one mobile point defect is present in the simulation system at a time. In KMC simulations, the sink strength is defined as the inverse of the square of the mean free path in 1D/3D diffusion[52-54],
where n is the dimensionality (n = 3 in this study), <nj > is the average number of jumps made by point defects (the number of jumps needed for a mobile point defect to be absorbed), and dj is the jump distance. This framework has been utilized to calculate the sink strength of dislocation loops, SFTs, and straight dislocations in irradiated Fe and Cu[31,32], providing a close agreement with experimental observations. Finally, the relation between the bias value and sink strength can be obtained based on capture efficiencies,
RESULTS
Migration energy barriers in the core region of voids
Migration energy barriers (MEBs) for SIAs (<110> dumbbell in bcc Fe and <100> dumbbell in fcc Cu/Ni) and vacancies near voids of different sizes have been determined in the investigated metals. As an example, the core effect of voids is illustrated using a 10 nm void and a 4 nm void in Fe, as shown in Figures 2 and 3, respectively. The [110] dumbbell MEBs are provided as representative examples. Since there are eight saddle points for first-nearest-neighbor diffusion in bcc iron[31,32], and the two saddle points along the diagonal of the unit cell lead to the same final configuration, four MEB maps for the [110] dumbbell are presented with their final dumbbell configurations. The comparison among SEAKMC results, dipole tensor method results, and their differences (calculated by subtracting dipole tensor method results from SEAKMC results) is shown in 3-D views. MEBs that are too close to the bulk value (within 0.002 eV) and differences smaller than 0.002 eV are hidden. Since voids at the atomic scale are not perfectly spherical due to atomic-scale irregularities, their shapes deviate from ideal spheres. These deviations arise from factors such as surface reconstruction and local atomic distortions, leading to anisotropic interactions between voids and mobile point defects, defined as the core effect.
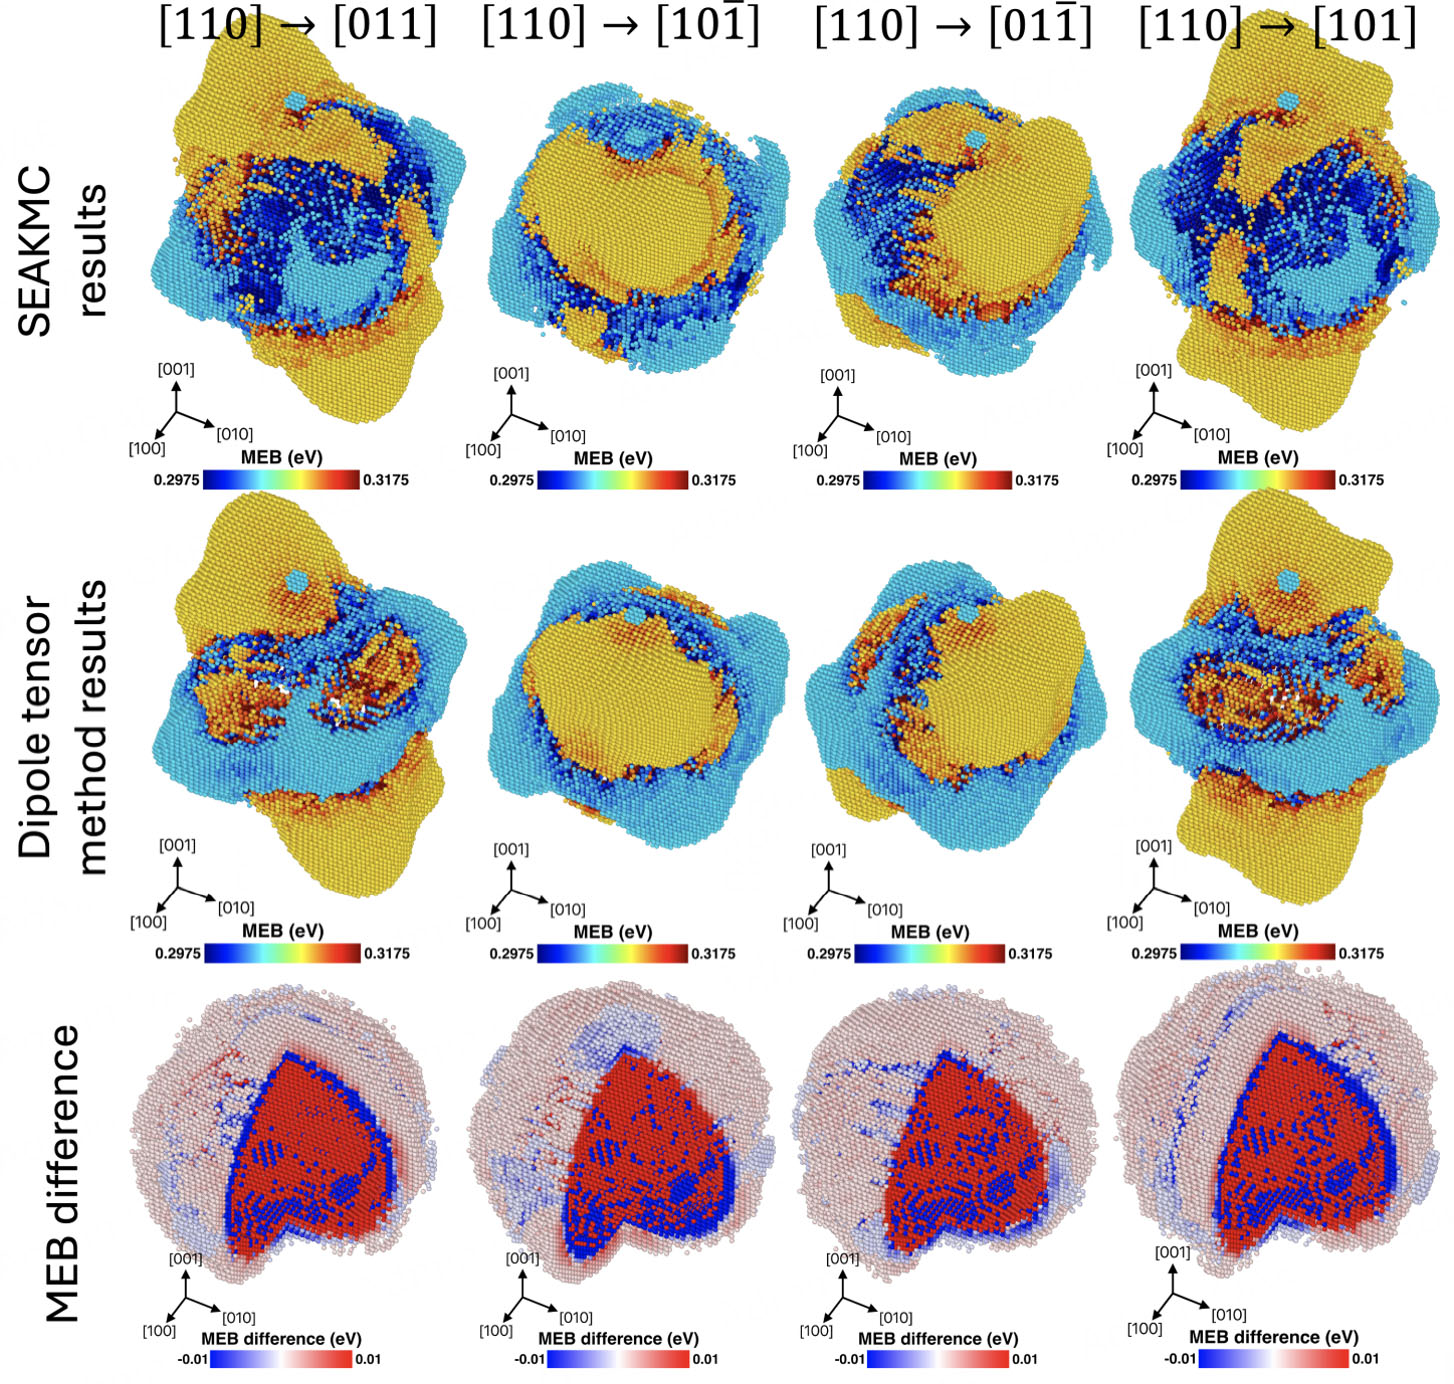
Figure 2. The 3-D MEB maps of a [110] dumbbell near a 10 nm void calculated using SEAKMC and dipole tensor method are compared, and the difference is displayed in red and blue. 1/4 of the MEB difference map is hidden for a clearer view in the core region.
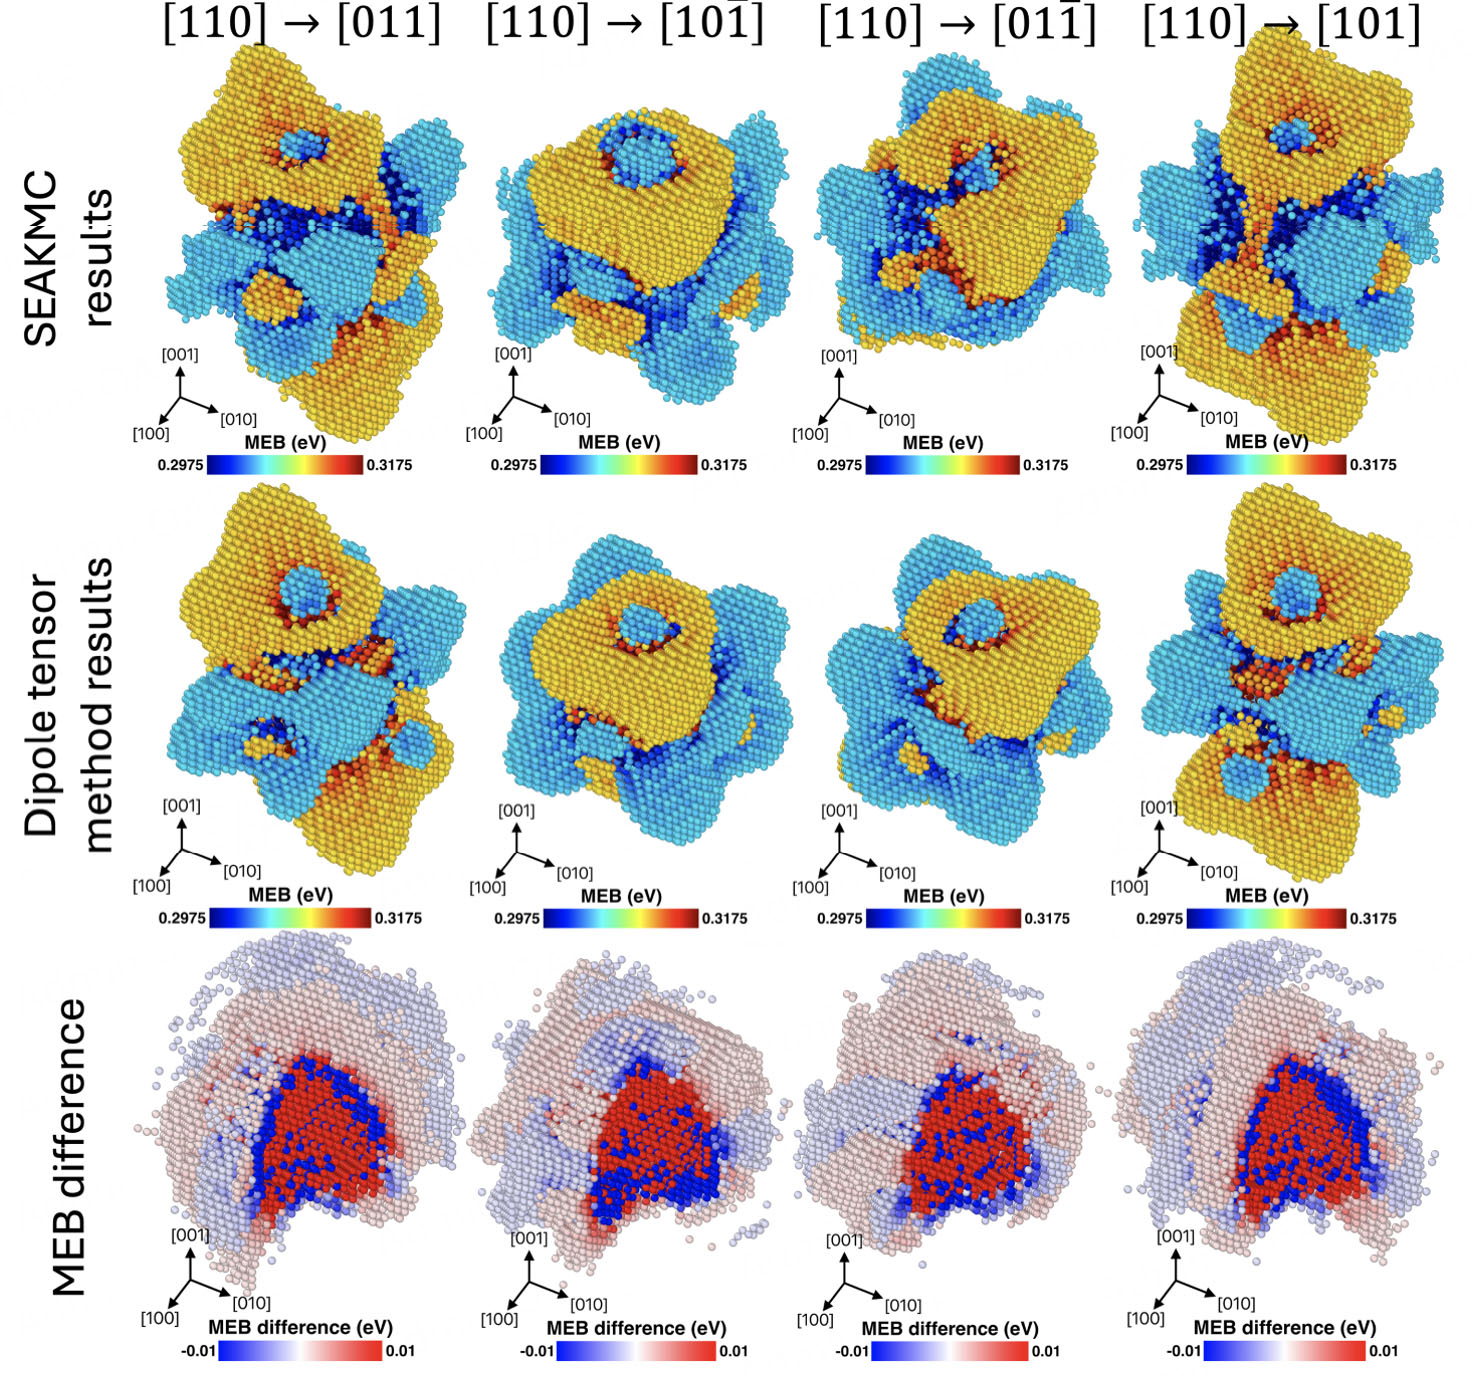
Figure 3. The 3-D MEB maps of a [110] dumbbell near a 4 nm void calculated using SEAKMC and dipole tensor method are compared, and the difference is displayed in red and blue. 1/4 of the MEB difference map is hidden for a clearer view in the core region.
MEBs exhibit strong anisotropy due to the atomistic interaction between mobile point defects and voids within the core regions, approximately 2 nm from the void surface in bcc Fe. Such an impact range remains relatively the same in Cu and Ni regardless of void sizes, details of which are presented in
This core effect is quantitatively presented in Figures 4 and 5, showing its long-range impact on defect lifetimes and void bias. Figure 4A and B presents the interstitial lifetime as a function of position near a
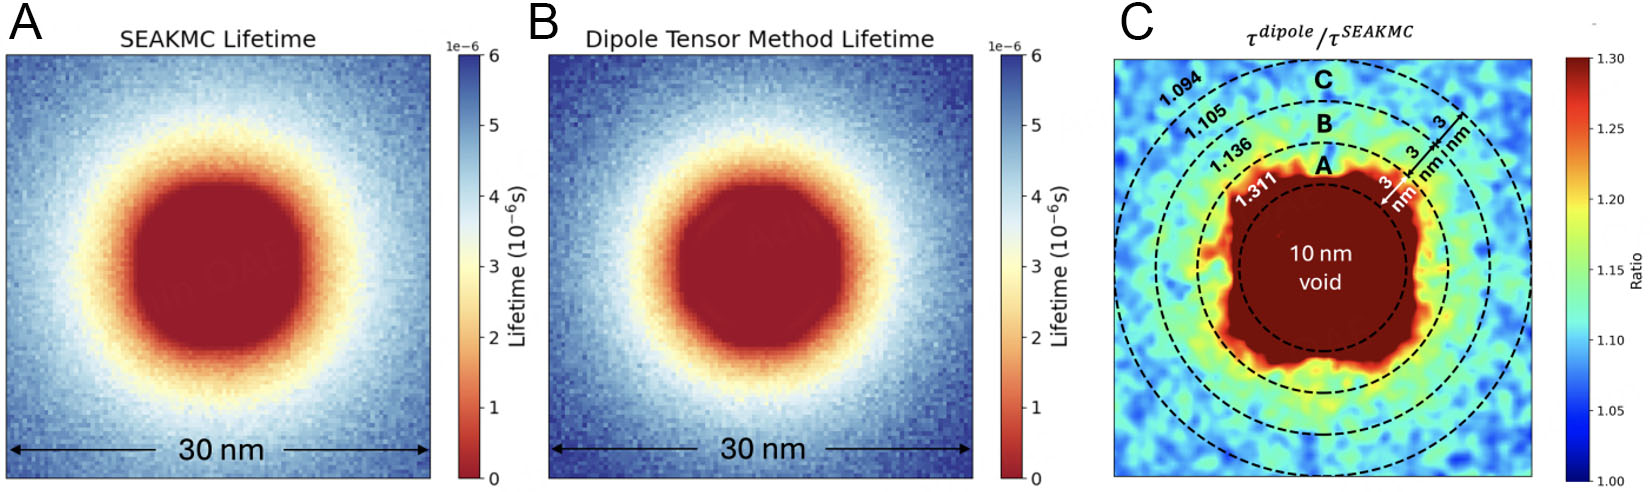
Figure 4. Interstitial lifetimes as a function of position near a 10 nm void, calculated using MEBs from (A) SEAKMC and (B) the dipole tensor method. The lifetime comparison is shown in (C), illustrating the significant deviations in the void core region. All figures are based on data from a [100] section plane passing through the center of the void.
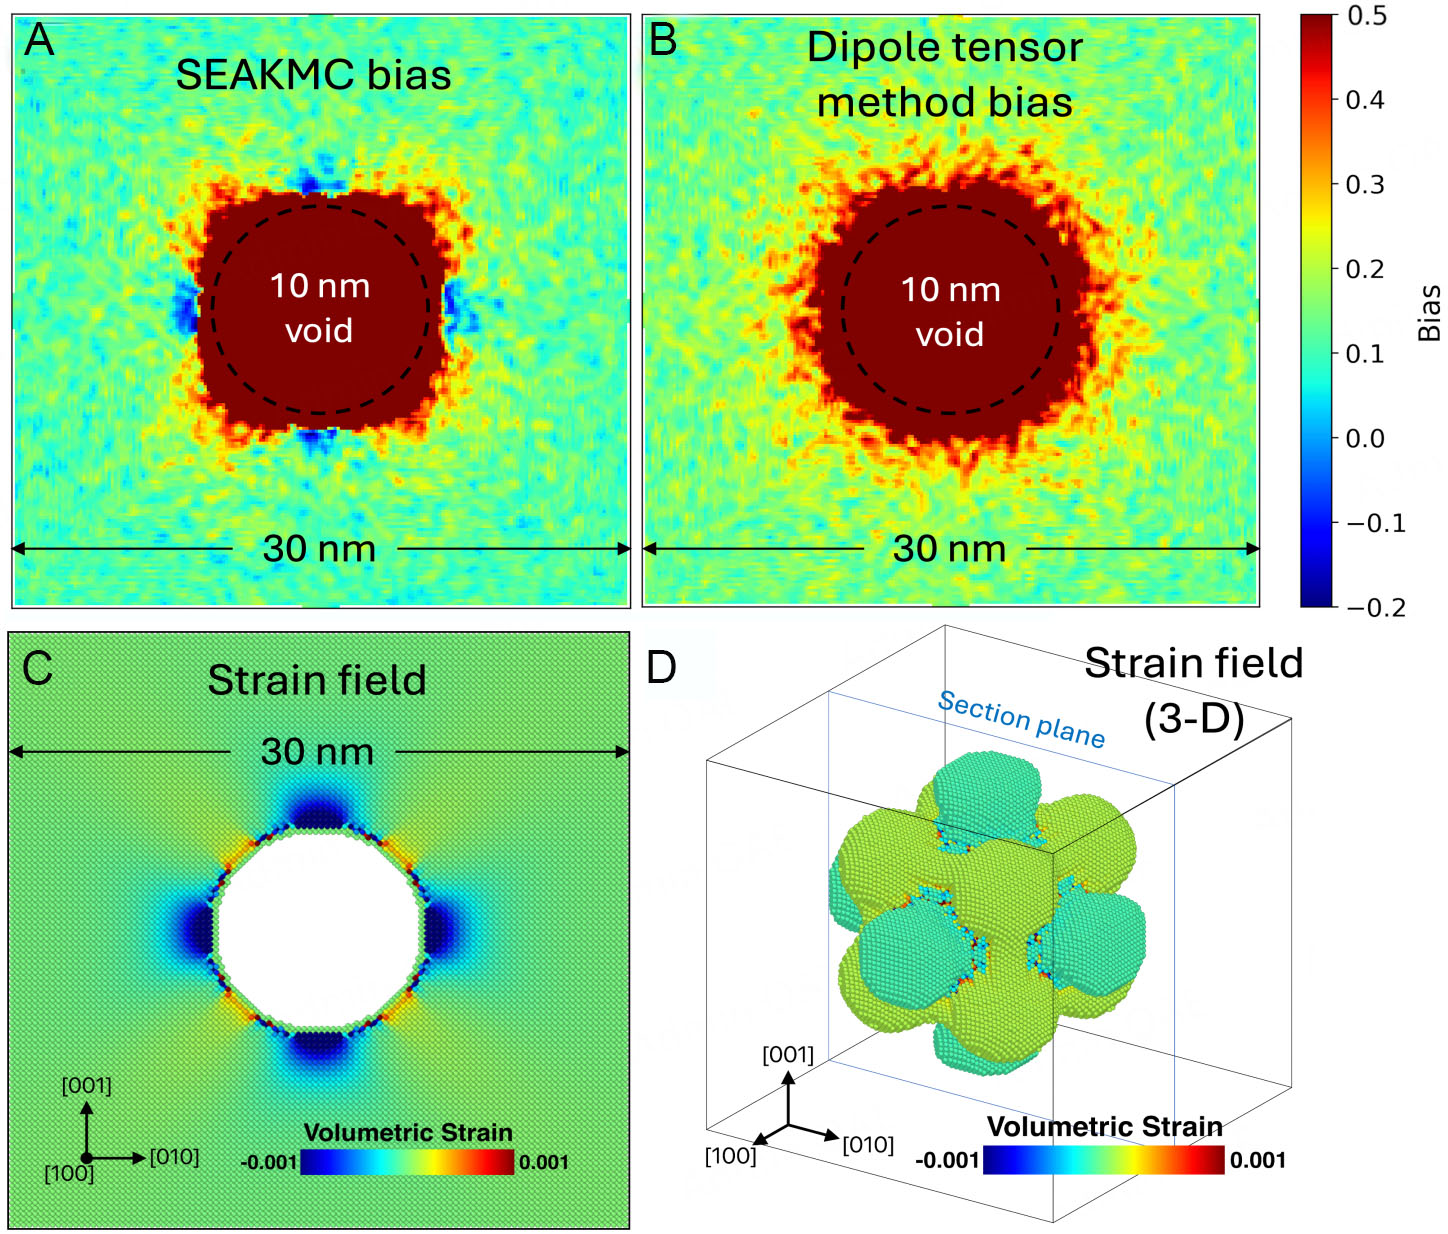
Figure 5. Bias values at each atomic position near a 10 nm void obtained using (A) SEAKMC and (B) the dipole tensor method. The volumetric strain field corresponding to the same section as (A and B) is shown in (C), where compressive regions correspond to the negative bias regions identified by SEAKMC. A 3D representation of the strain field is provided in (D) for reference, with the section plane corresponding to Figure 4 and (A-C) labeled.
The bias value as a function of positions near a 10 nm void, calculated using MEBs from SEAKMC and the dipole tensor method, is shown in Figure 5A and B, respectively. In general, the bias values calculated using SEAKMC are lower than those obtained from the dipole tensor method. This discrepancy occurs due to regions repelling interstitials, where negative bias values are observed, as labeled in blue in Figure 5A. The local atomic structure of the void along the <100> direction exhibits compressive regions, as illustrated in Figure 5C, while other directions lead to tensile regions [Figure 5D], where interstitials are preferred. This phenomenon leads to an overall positive bias with specific regions exhibiting a negative bias, which is a counter-intuitive and concrete representation of the core effect. However, this effect is underestimated by elasticity theory, leading to the uniformly positive bias distribution seen in Figure 5B. Notably, the distribution and shape of repulsion regions vary depending on the crystal structure (e.g., bcc or fcc) and void size, with the impact diminishing for larger voids. A detailed analysis of the shape effect is provided in the Supplementary Section IV.
The core effect also leads to distinct void bias predictions with a given void density. For a 10 nm void, the dipole tensor method overestimates the bias by 25% to 40% from 573 to 873 K, considering commonly observed void densities (1018 to 1021 m-3), as shown in Figure 6A. In contrast, the overestimation for a
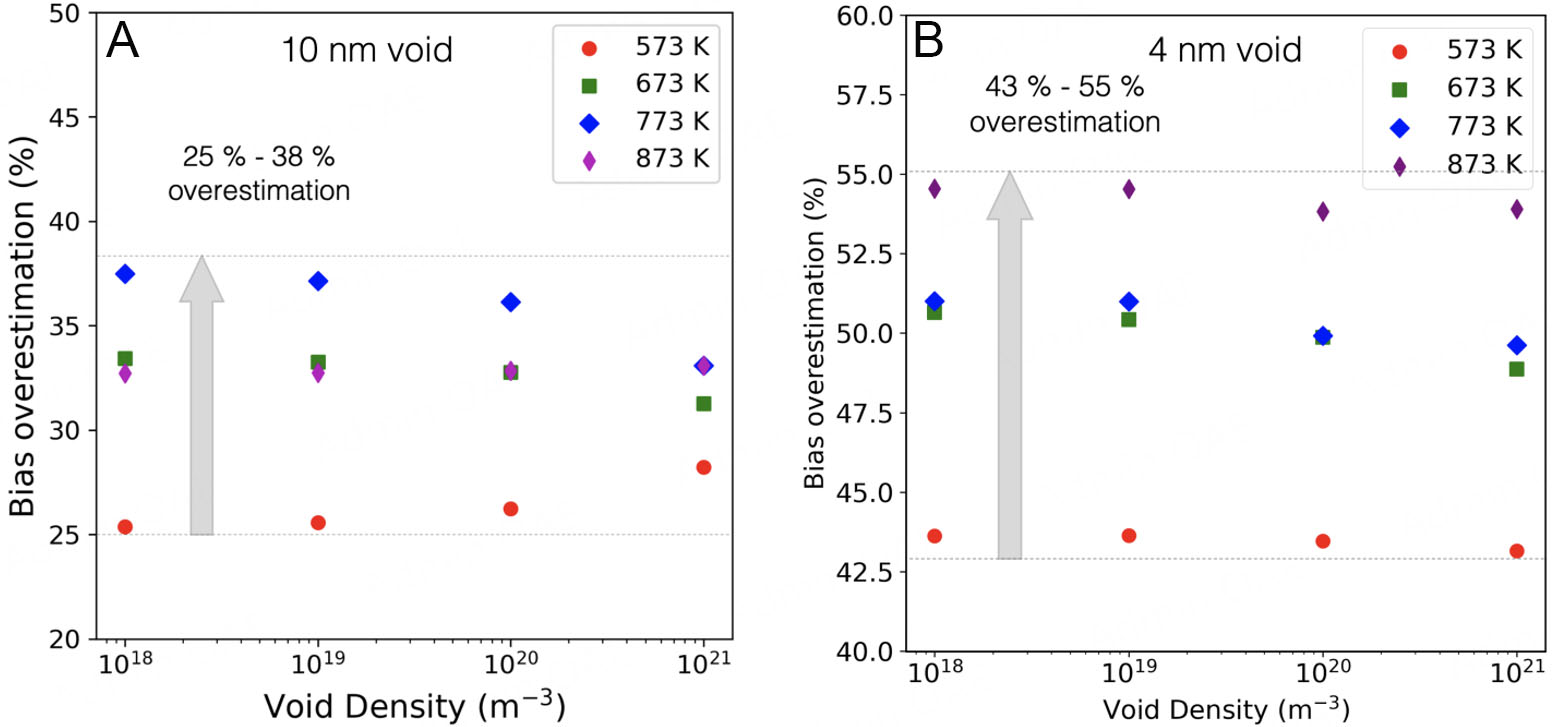
Figure 6. The bias overestimation using the dipole tensor method compared to SEAKMC is shown for (A) a 10 nm void system and (B) a 4 nm void system.
Void bias in Fe, Cu, and Ni
Void bias values have been determined in pure Fe, Cu, and Ni, varying void size and temperature, as shown in Figure 7. Three different void sizes (2, 4, and 10 nm in diameter) and temperatures (573, 673, and 773 K) have been investigated. The impact of void density is analyzed in Section "Temperature and void density effects" with data shown in Table 1.
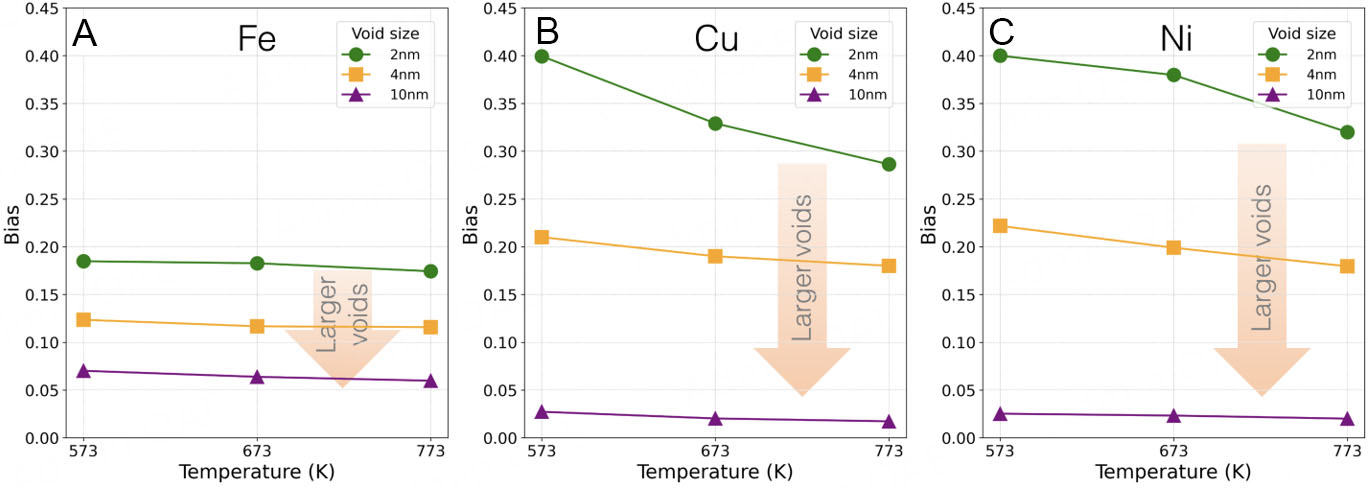
Figure 7. Void bias as a function of void sizes and temperatures in (A) Fe, (B) Cu, and (C) Ni. A commonly observed void density at
Bias of 2 and 10 nm voids with various number densities at 673 K
| Densities | 1022 m-3 | 1020 m-3 | 1018 m-3 |
| 2 nm void in Fe | 0.190 | 0.183 | 0.182 |
| 2 nm void in Cu | 0.336 | 0.329 | 0.328 |
| 2 nm void in Ni | 0.345 | 0.320 | 0.318 |
| 4 nm void in Fe | 0.130 | 0.117 | 0.116 |
| 4 nm void in Cu | 0.182 | 0.170 | 0.165 |
| 4 nm void in Ni | 0.191 | 0.180 | 0.175 |
| 10 nm void in Fe | 0.084 | 0.064 | 0.062 |
| 10 nm void in Cu | 0.024 | 0.020 | 0.019 |
| 10 nm void in Ni | 0.026 | 0.020 | 0.019 |
Void size effects
The void bias in Fe, Cu, and Ni decreases as void size increases, as demonstrated in Figure 7A-C. Specifically, in Fe, the void bias of a 2 nm void ranges from 0.17 to 0.19 between 573 and 773 K. This value decreases to 0.11-0.13 for a 4 nm void and further reduces to 0.06-0.07 for a 10 nm void. In comparison, voids in Cu and Ni show greater bias reduction with size increase than those in Fe. In Cu and Ni, the bias of 2 nm voids is mostly higher than 0.3, which decreases to around 0.2 with 4 nm voids. The bias of 10 nm voids is approximately 0.02, substantially lower than that of a 10 nm void in Fe.
This observed pattern is attributed to the core effect of voids, which are primarily caused by deviations from perfect sphericity due to atomic-scale irregularities. For smaller voids, the core effect strongly enhances the preferential absorption of interstitials over vacancies. As voids increase in size, their geometries approach ideal spherical symmetry while simultaneously exhibiting diminished absorption preferences, thereby reducing discrepancies between atomistic simulations and elasticity theory approaches. Therefore, it is reasonable to expect that the deviation of conventional calculations based on elasticity theory[13,28,33] will decrease and become negligible with large voids on the order of hundreds of nanometers in size.
Temperature and void density effects
A reduction in bias is observed with increasing temperatures across the three studied metals, as shown in Figure 7. This is because the impact of migration energy barrier Em,i [from Equation (4)], which reflects the interaction between the void and mobile point defect, decreases at higher temperatures. The effect of temperature is notably more pronounced with small void sizes in fcc metals. For example, the bias of a 2 nm void in Cu shows a decrease from 0.40 to 0.29 as the temperature increases from 573 to 773 K. Comparatively, within the same temperature range, the bias of a 10 nm void in Cu reduces from 0.027 to 0.017. In contrast, the temperature effect is relatively weaker in Fe, with a bias difference of ~0.01 observed between 573 and 773 K across various void sizes.
Compared to the temperature effect, the impact of void density on bias values is less significant. The bias values at three different void number densities ranging from 1018 to 1022 m-3 at 673 K are presented in Table 1. Generally, the void bias tends to decrease with lower number densities due to the extended diffusion distance of a point defect before it reaches the void. However, such a decrease in bias value converges at low densities (1018 to 1020 m-3) in all the investigated metals. This tendency is reflected by a tiny variation of approximately 0.001, despite significant changes in number density or the void size (2 to
Additionally, the key factor behind the difference between fcc and bcc metals remains unclear but may stem from the nature of their crystal structures or the anisotropic diffusion of point defects. BCC Fe exhibits higher capture efficiency for both interstitials and vacancies than fcc metals (Supplementary Section V), suggesting voids in bcc Fe absorb defects more effectively. In contrast, the difference between Cu and Ni is negligible.
DISCUSSION
Efficiency of point defect absorption by voids
Although voids are found biased sinks with a preference for absorbing SIAs over vacancies, this finding does not conflict with the conventional dislocation bias model, attributing the growth of voids to a net vacancy flux entering the voids[4]. This is because different sinks, e.g., dislocation, dislocation loops, precipitates, and SFTs, compete in point defect absorption. The corresponding defect partition can be analyzed from the following two aspects: the specific bias and the sink strength.
The specific bias of point defects
We propose a conceptual framework to explain the competition among different defect clusters for point defect absorption. Here, specific bias is defined as the ratio of the bias to the number of vacancies or SIAs within a sink. This parameter characterizes the normalized ability of a sink to absorb SIAs relative to vacancies. A sink with a low specific bias indicates either a low bias value or a large size (which correspondingly implies low densities in irradiated metals and a reduced impact on diffusion of point defects). Note that this definition is claimed for a more direct comparison, while the bias values will be used in rate theory calculations, rather than the specific bias. Figure 8A compares the specific bias of various sinks in Cu, Ni, and Fe at 573 K. In fcc metals (Cu and Ni), a SFT with a size of 2 nm encapsulates 36 vacancies and exhibits bias efficiencies of the order of 10-2. In comparison, a 10 nm interstitial loop containing 103 interstitials has a specific bias of 10-4, while a 10 nm void with roughly 104 vacancies has a specific bias of around 10-6. The voids exhibit a specific bias that is roughly two orders of magnitude lower than loops and is much lower overall. Thus, the absorption of SIAs by 10 nm voids is considerably weaker compared with dislocation loops and SFTs in Cu and Ni. In bcc Fe, the specific bias of voids is also significantly lower than that of dislocation loops.
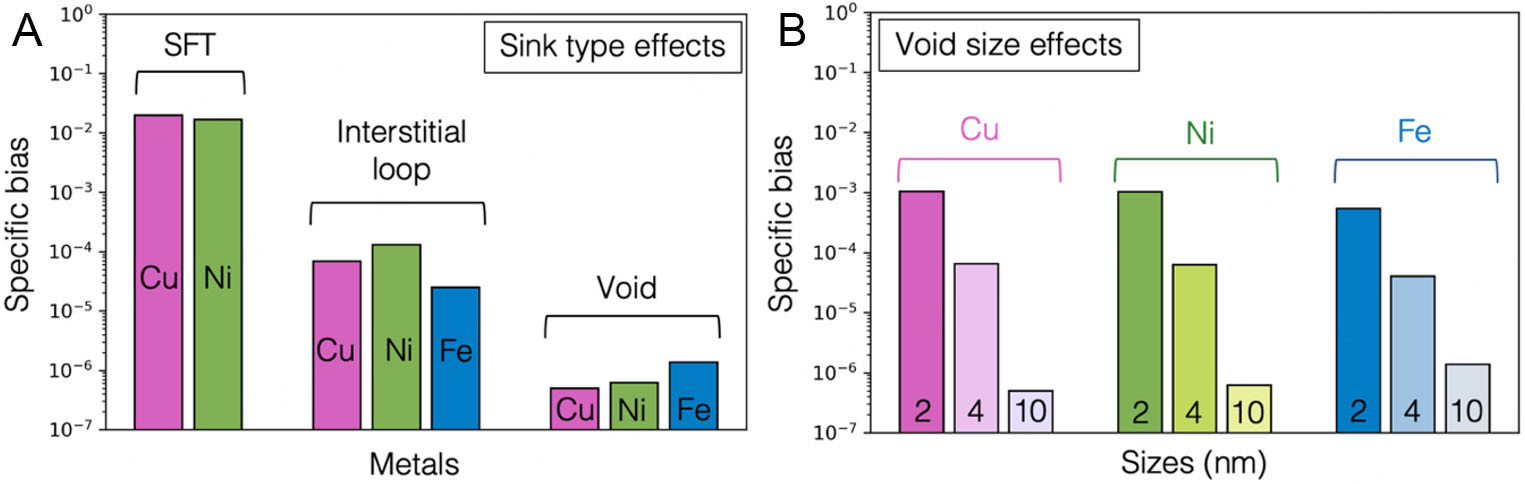
Figure 8. Specific bias of (A) voids with different sizes and (B) different sinks in Cu, Ni, and Fe. In (B), the SFT has a size of 2 nm, while both the loop and void have diameters of 10 nm. Dislocation loop types are selected based on experimental observations: 1/3<111> Frank loops observations for fcc Cu[57] and fcc Ni[39], and <100> Frank loops for bcc Fe[37].
Voids with a size of 4 nm exhibit a specific bias similar to 10 nm interstitial loops [Figure 8A], both around 10-4. The specific bias of smaller voids significantly exceeds that of 10 nm voids, as depicted in Figure 8B. Moreover, 2 nm voids show an ability to absorb SIAs that is roughly an order of magnitude greater than
Sink strength of point defect sinks
Sink strength not only characterizes the capture efficiency for point defect absorption but also reflects the effect of sink number density. Therefore, sink strength can be used to understand the overall effects of different types of sinks. Figure 9 illustrates the sink strength of a 10 nm void, 10 nm interstitial loop, and a
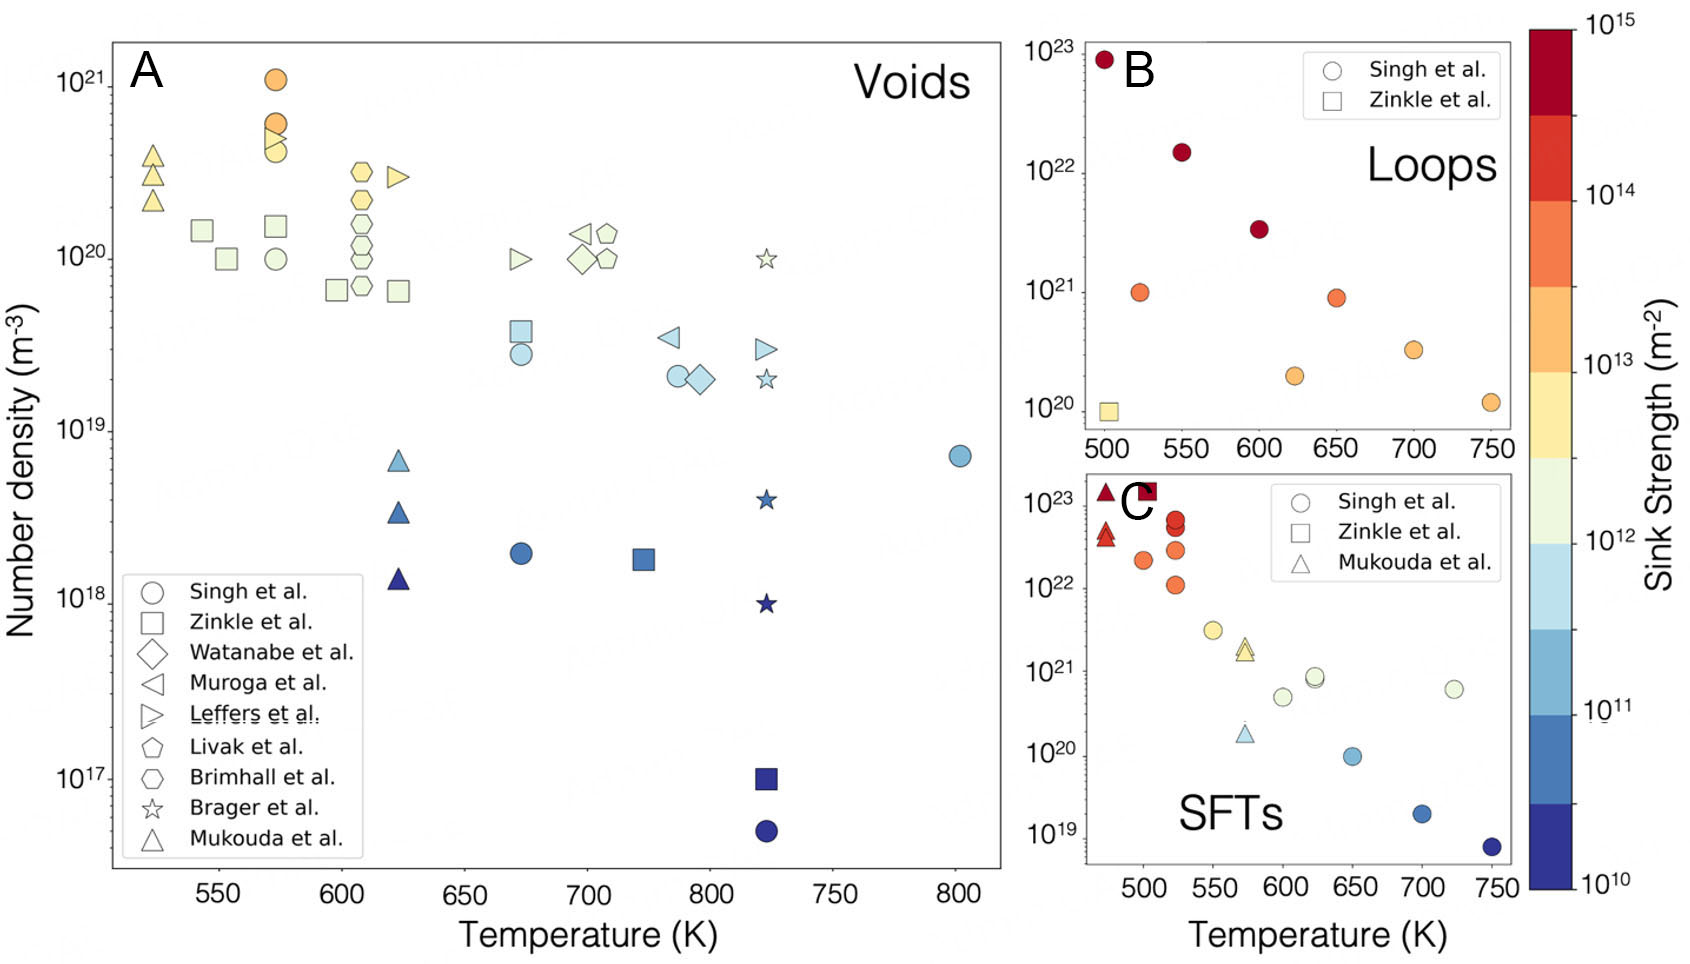
Figure 9. Comparative analysis of sink strengths among voids, loops, and SFTs in Cu. The range of temperatures and number densities for each sink varies based on experimental observations. (A) Voids; (B) Loops; (C) SFTs.
Void sink strength typically ranges between 1010 and 1013 m-2 and increases with decreasing temperatures and rising densities as shown in Figure 9A. Small voids (4.5-7.7 nm) have the highest sink strengths
The impact of void bias on void swelling
Voids have been treated as neutral sinks (Bias = 0) in many previous swelling rate calculations[5,10-13]. However, it is essential to take into account the actual void bias and sink strength in the swelling rate estimations because the void serves as the reference for all sinks. According to the rate theory[5], the swelling rate can be derived from the relation between the generation rate (G) and concentrations (Ci and Cv) of point defects (also called balance equations),
Here,
The swelling rate is thus obtained from the net flux of vacancies to voids,
Here, S stands for the total volume of voids and ϕ = Gt is the irradiation dose in dpa[5]. The sink strengths are obtained from capture efficiencies and bias of each type of sink following Equations (11-13). Considering the correlated defect recombination, a survival fraction at 0.1[67] is multiplied by the obtained swelling rate
As shown in Equation (18), the bias of the void (the ratio between
The competitive absorption of point defects and their effects on void swelling/shrinkage
The evolution of voids is critically affected by the competitive absorption of mobile point defects across various sinks. The material exhibits positive swelling when the sink strengths of voids are smaller than those of other sinks. Comparatively, the system may have potential negative swelling rates (corresponding to void shrinkage) when voids exhibit higher sink strengths than other sinks. We analyze the impacts of various major sinks on void swelling/shrinkage based on Equation (18) and provide the situations in which void shrinkage is likely to happen. Here, we take irradiated Cu as an example. Representative densities of voids, dislocation loops, and SFTs as a function of temperature are obtained by linear regressions of the experimental data[38,39,43,55,57-66]. Specifically, SFT density decreases from approximately 1023 to 6 × 10¹⁸ m-3 as the temperature increases from 473 to 773 K. Concurrently, dislocation loop density decreases from 1022 to 1019 m-3, and void density decreases from 1020 to 1018 m-3 within the same temperature range. Based on experimental observations, the representative density for dislocations is typically on the order of 1012 to
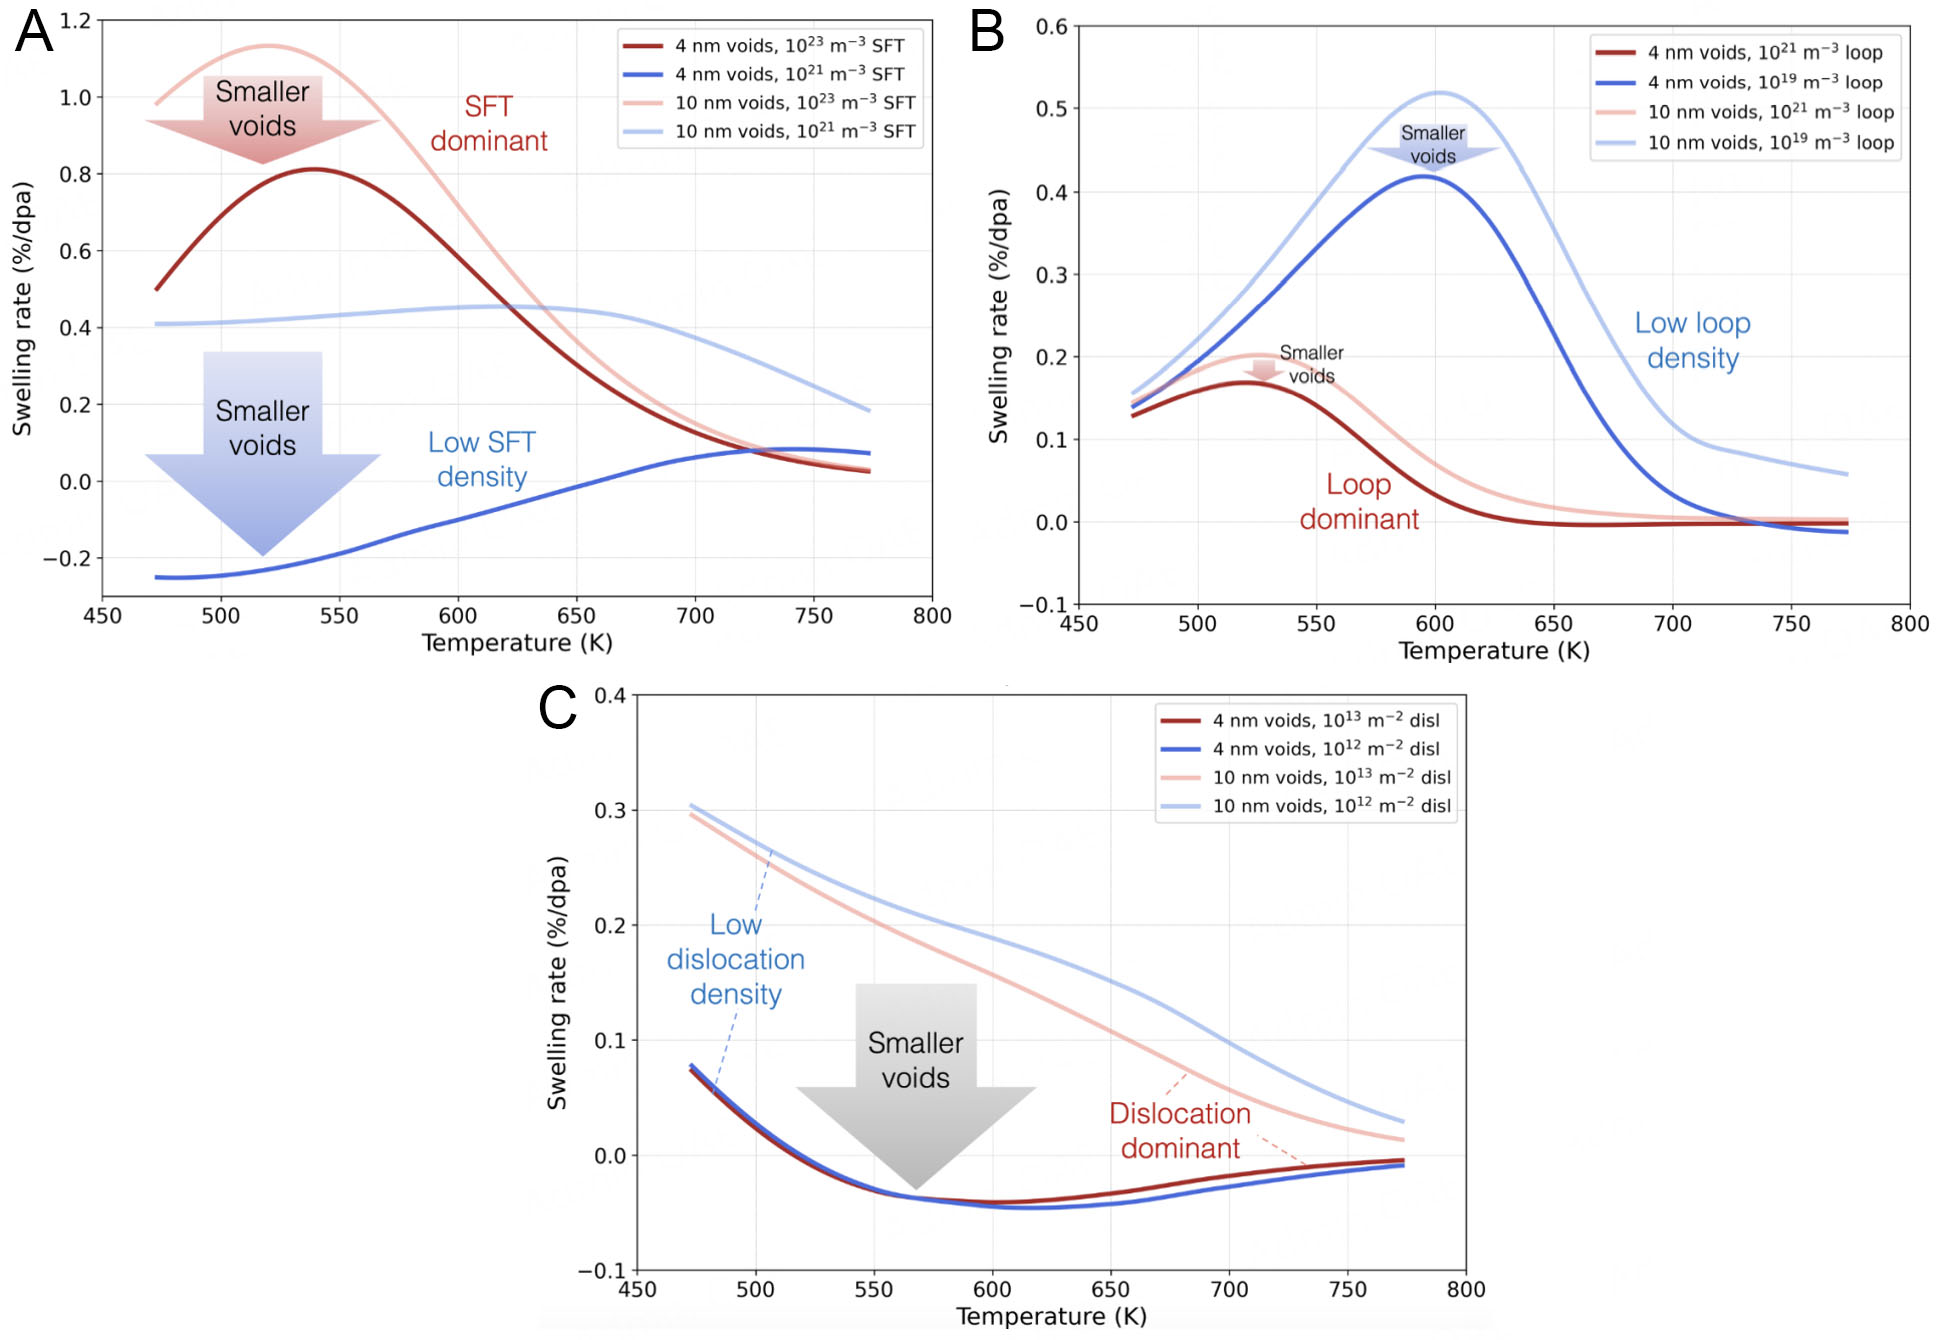
Figure 10. Predicted swelling rates based on representative sink densities. The effects of (A) SFT density, (B) dislocation loop density, and (C) dislocation density on predicted swelling rates are presented. Predictions with void sizes of 4 and 10 nm are presented in each figure to illustrate the void size effect.
Void shrinkage is generally observed only when the void size is small. In Figure 10A, both the SFT-dominant scenario (red curves, with a number density of 1023 m-3) and low-SFT-density (blue curves, with a number density of 1021 m-3) scenario demonstrate that 4 nm voids significantly reduce swelling rates and even lead to shrinkage under low SFT densities at temperatures below approximately 650 K. For the same void size, SFTs result in high swelling rates (peak bias exceeding 1% dpa-1) under 600 K. This behavior corresponds to experimental observations[39,55,57,61,62,66,71], illustrating that SFTs are highly competitive in point defect absorption under these conditions. In comparison, dislocation loops [Figure 10B] tend to reduce the swelling rate due to their low bias values (approximately 0.1) and high sink strength (over 1014 m-2). The peak swelling rate with a loop number density of 1019 m-3 is around 0.52% dpa-1 for 10 nm voids and
In conclusion, small voids tend to shrink, while large voids consistently swell, with the critical size falling between 4 and 10 nm. Biased sinks, especially SFTs and dislocation loops, are more effective in absorbing mobile point defects than small voids at high densities, thereby limiting the void shrinkage processes. Notably, the quantitative data obtained in this study are based on specific empirical interatomic potentials. Although these potentials are widely accepted and employed in numerous published studies, they still present certain limitations. Additionally, since all the density parameters are derived from irradiation experiments and the size parameters are based on estimations, the calculated swelling rates serve primarily as a guideline. Other parameters, such as void morphologies and sink distributions, may also influence swelling rate predictions. However, performing a systematic analysis of nanoscale void shapes or distributions observed in experiments remains challenging, as they can evolve during void growth.
CONCLUSIONS
This study systematically calculates the MEBs in the core region of voids and subsequently determines the void bias in irradiated Fe, Cu, and Ni using a recently developed atomistic KMC approach. The effects of void size, irradiation temperature, void density, and void morphology on bias values are presented. Small voids exhibit high bias values that decrease with increasing size, with a more drastic reduction observed in fcc metals compared to bcc Fe. Additionally, void bias consistently decreases with higher temperatures and lower void densities across all investigated metals.
The evolution of voids is found to be decisively influenced by the competitive absorption of mobile point defects among various sinks. Two crucial factors, the specific bias and sink strength, are employed to demonstrate such competition. Small voids (< 4 nm) are identified as highly biased sinks and display higher specific bias and sink strengths with high void densities, leading to the shrinkage of nanovoids. Moreover, the high bias values of small voids could potentially impede the growth of interstitial dislocation loops. In contrast, voids with diameters exceeding 4 nm exhibit a weaker capacity to absorb mobile point defects than dislocation loops and SFTs, leading to the growth of voids. These results reconcile the seemingly contradictory phenomena of void growth and void shrinkage, providing a consistent framework for predicting void evolution under irradiation.
Overall, the inclusion of precise void bias values addresses previous discrepancies arising from neglecting void bias or treating voids as neutral sinks. Furthermore, the bias values and sink strength derived from this study have broader applications, such as informing the modeling of other irradiation-induced processes and microstructural evolution or incorporating them into higher-scale simulations. Nevertheless, the current approach faces limitations in precipitation-based alloys due to the drastically increased computational load from solute-defect interactions and the added complexity of precipitate diffusion dynamics. Expanding this approach would be helpful for broader and more mechanistic insights into void swelling phenomena across different alloy systems.
DECLARATIONS
Authors’ contributions
Investigation, methodology, validation, formal analysis, writing - original draft, visualization: Yu, Z.
Conceptualization, methodology, formal analysis, writing - review & editing, supervision, project administration, funding acquisition: Xu, H.
Availability of data and materials
The raw data supporting the findings of this study are available within this Article and its
Financial support and sponsorship
This work is supported by the US Department of Energy, Office of Science, Basic Energy Sciences, under Award No. DE-SC0019151. This research used resources of the National Energy Research Scientific Computing Center, a DOE Office of Science User Facility supported by the Office of Science of the US Department of Energy under Contract No. DE-AC02-05CH11231. Partial funding for open access to this research was provided by University of Tennessee's Open Publishing Support Fund.
Conflicts of interest
All authors declared that there are no conflicts of interest.
Ethical approval and consent to participate
Not applicable.
Consent for publication
Not applicable.
Copyright
© The Author(s) 2026.
Supplementary Materials
REFERENCES
2. Zinkle, S. J.; Busby, J. T. Structural materials for fission & fusion energy. Mater. Today. 2009, 12, 12-9.
4. Brailsford, A.; Bullough, R. The rate theory of swelling due to void growth in irradiated metals. J. Nucl. Mater. 1972, 44, 121-35.
5. Golubov, S. I.; Barashev, A. V.; Stoller, R. E. Comprehensive nuclear materials; 2011, pp. 357-91. Available from: www.osti.gov/biblio/1035151 [Last accessed on 11 Aug 2025].
6. Mansur, L. K. Void swelling in metals and alloys under irradiation: an assessment of the theory. Nucl. Technol. 1978, 40, 5-34.
7. Bondarenko, A. I.; Konobeev, Y. V. Void growth kinetics in irradiated metals. Phys. Stat. Sol. (a). 1976, 34, 195-205.
8. Allen, T.; Cole, J.; Gan, J.; Was, G.; Dropek, R.; Kenik, E. Swelling and radiation-induced segregation in austentic alloys. J. Nucl. Mater. 2005, 342, 90-100.
9. Barrioz, P.; Hure, J.; Tanguy, B. Void growth and coalescence in irradiated copper under deformation. J. Nucl. Mater. 2018, 502, 123-31.
10. Bhattacharya, A.; Zinkle, S. J. 1.12 - Cavity swelling in irradiated materials. In: Comprehensive Nuclear Materials. Elsevier; 2020. pp. 406-55.
11. Was, G. S. Fundamentals of radiation materials science: metals and alloys; Berlin: Springer; 2007. pp. 343-431.
12. Chang, Z.; Olsson, P.; Terentyev, D.; Sandberg, N. Dislocation bias factors in fcc copper derived from atomistic calculations. J. Nucl. Mater. 2013, 441, 357-63.
13. Dubinko, V.; Ostapchuk, P.; Slezov, V. Theory of radiation-induced and thermal coarsening of the void ensemble in metals under irradiation. J. Nucl. Mater. 1989, 161, 239-60.
16. Norris, D. I. R. The growth of voids in nickel in a high-voltage electron microscope. Philos. Mag. 1971, 23, 135-52.
17. Harkness, S. D.; Li, C. A study of void formation in fast neutron-irradiated metals. Metall. Trans. 1971, 2, 1457-70.
18. Loomis, B.; Gerber, S. Effects of irradiation-temperature change on void growth and shrinkage in ion-irradiated Nb. J. Nucl. Mater. 1981, 102, 154-69.
19. Ayanoglu, M.; Motta, A. T. Void shrinkage in 21Cr32Ni austenitic model alloy during in-situ ion irradiation. J. Nucl. Mater. 2021, 543, 152636.
20. Chen, W.; Mei, Z.; Ward, L.; et al. In-situ TEM investigation of void swelling in nickel under irradiation with analysis aided by computer vision. Acta. Mater. 2023, 254, 119013.
21. Li, J.; Fan, C.; Li, Q.; Wang, H.; Zhang, X. In situ studies on irradiation resistance of nanoporous Au through temperature-jump tests. Acta. Mater. 2018, 143, 30-42.
22. Chen, Y.; Yu, K. Y.; Liu, Y.; et al. Damage-tolerant nanotwinned metals with nanovoids under radiation environments. Nat. Commun. 2015, 6, 7036.
23. Niu, T.; Nasim, M.; Annadanam, R. G. S.; et al. Recent studies on void shrinkage in metallic materials subjected to in situ heavy ion irradiations. JOM 2020, 72, 4008-16.
24. Niu, T.; Rayaprolu, S.; Shang, Z.; et al. In situ study on heavy ion irradiation induced microstructure evolution in single crystal Cu with nanovoids at elevated temperature. Mater. Today. Commun. 2022, 33, 104418.
25. Dubinko, V.; Guglya, A.; Donnelly, S. Radiation-induced formation, annealing and ordering of voids in crystals: theory and experiment. Nucl. Instrum. Meth. B. 2011, 269, 1634-9.
26. Samaras, M.; Hoffelner, W.; Victoria, M. Irradiation of pre-existing voids in nanocrystalline iron. J. Nucl. Mater. 2006, 352, 50-6.
27. Wolfer, W.; Ashkin, M. Stress-induced diffusion of point defects to voids. Scr. Metall. 1973, 7, 1175-80.
28. Borodin, V.; Ryazanov, A.; Abromeit, C. Void bias factors due to the anisotropy of the point defect diffusion. J. Nucl. Mater. 1993, 207, 242-54.
29. Carpentier, D.; Jourdan, T.; Le, Bouar. Y.; Marinica, M. Effect of saddle point anisotropy of point defects on their absorption by dislocations and cavities. Acta. Mater. 2017, 136, 323-34.
30. Wang, Y.; Gao, F.; Wirth, B. D. Atomic modeling assessment of the interaction distance and effective bias for small defect clusters absorption at a void in BCC Fe. J. Nucl. Mater. 2022, 568, 153882.
31. Yu, Z.; Xu, H. Dislocation loop bias and void swelling in irradiated α-iron from mesoscale and atomistic simulations. Commun. Mater. 2023, 4, 356.
32. Yu, Z.; Lin, Y.; Zachman, M. J.; Zinkle, S. J.; Xu, H. The role of stacking fault tetrahedra on void swelling in irradiated copper. Commun. Mater. 2024, 5, 491.
33. Surh, M. P.; Wolfer, W. G. Accurate mean field void bias factors for radiation swelling calculations. J. Comput. Aided. Mater. Des. 2007, 14, 419-24.
34. Griffiths, M.; Ramos-Nervi, J.; Greenwood, L. A rate theory model of radiation-induced swelling in an austenitic stainless steel. J. Nucl. Mater. 2021, 2, 484-515.
35. Hayward, E.; Deo, C.; Uberuaga, B. P.; Tomé, C. N. The interaction of a screw dislocation with point defects in bcc iron. Philos. Mag. 2012, 92, 2759-78.
36. Brimhall, J.; Mastel, B. Stability of voids in neutron irradiated nickel. J. Nucl. Mater. 1969, 33, 186-94.
37. Horton, L.; Bentley, J.; Farrell, K. A TEM study of neutron-irradiated iron. J. Nucl. Mater. 1982, 108-9, 222-33.
38. Singh, B.; Zinkle, S. Defect accumulation in pure fcc metals in the transient regime: a review. J. Nucl. Mater. 1993, 206, 212-29.
39. Zinkle, S.; Snead, L. Microstructure of copper and nickel irradiated with fission neutrons near 230 °C. J. Nucl. Mater. 1995, 225, 123-31.
40. Bhattacharya, A.; Meslin, E.; Henry, J.; Barbu, A.; Poissonnet, S.; Décamps, B. Effect of chromium on void swelling in ion irradiated high purity Fe-Cr alloys. Acta. Mater. 2016, 108, 241-51.
41. Borodin, V.; Volkov, A.; Ryazanov, A. The effect of bias factor variations on void nucleation in irradiated alloys. J. Nucl. Mater. 2002, 307-11, 862-5.
42. Lee, T.; Hobbs, L.; Kohse, G.; Ames, M.; Harling, O.; Grant, N. Microstructural evolution and swelling of high strength, high conductivity RS-PM copper alloys irradiated to 13.5 dpa with neutrons. J. Nucl. Mater. 1986, 141-3, 179-83.
43. Muroga, T.; Yoshida, N. Microstructure of neutron-irradiated copper alloyed with nickel and zinc. J. Nucl. Mater. 1994, 212-215, 266-9.
44. Plimpton, S. Fast parallel algorithms for short-range molecular dynamics. J. Comput. Phys. 1995, 117, 1-19.
45. Ackland, G. J.; Mendelev, M. I.; Srolovitz, D. J.; Han, S.; Barashev, A. V. Development of an interatomic potential for phosphorus impurities in-iron. J. Phys. Condens. Matter. 2004, 16, S2629-42.
46. Mishin, Y.; Mehl, M. J.; Papaconstantopoulos, D. A.; Voter, A. F.; Kress, J. D. Structural stability and lattice defects in copper: Ab initio, tight-binding, and embedded-atom calculations. Phys. Rev. B. 2001, 63, 224106.
47. Mendelev, M.; Kramer, M.; Hao, S.; Ho, K.; Wang, C. Development of interatomic potentials appropriate for simulation of liquid and glass properties of NiZr2 alloy. Philos. Mag. 2012, 92, 4454-69.
48. Hao, J.; Casillas-trujillo, L.; Xu, H. Using lifetime of point defects for dislocation bias in bcc Fe. Curr. Opin. Solid. State. Mater. Sci. 2022, 26, 101021.
49. Xu, H.; Osetsky, Y. N.; Stoller, R. E. Self-evolving atomistic kinetic Monte Carlo: fundamentals and applications. J. Phys. Condens. Matter. 2012, 24, 375402.
50. Mahmoud, S.; Trochet, M.; Restrepo, O. A.; Mousseau, N. Study of point defects diffusion in nickel using kinetic activation-relaxation technique. Acta. Mater. 2018, 144, 679-90.
51. Mansur, L.; Brailsford, A.; Wolfer, W. On the meaning of sink capture efficiency and sink strength for point defects. J. Nucl. Mater. 1982, 105, 36-8.
52. Heinisch†, H. L.; Singh, B. N. Kinetic Monte Carlo simulations of void lattice formation during irradiation. Philos. Mag. 2003, 83, 3661-76.
53. Heinisch, H.; Singh, B.; Golubov, S. The effects of one-dimensional glide on the reaction kinetics of interstitial clusters. J. Nucl. Mater. 2000, 283-7, 737-40.
54. Malerba, L.; Becquart, C. S.; Domain, C. Object kinetic Monte Carlo study of sink strengths. J. Nucl. Mater. 2007, 360, 159-69.
55. Zinkle, S.; Farrell, K. Void swelling and defect cluster formation in reactor-irradiated copper. J. Nucl. Mater. 1989, 168, 262-7.
56. Porollo, S.; Dvoriashin, A.; Konobeev, Y.; Garner, F. Microstructure and swelling of neutron irradiated nickel and binary nickel alloys. J. Nucl. Mater. 2013, 442, S809-12.
57. Singh, B. N.; Leffers, T.; Horsewell, A. Dislocation and void segregation in copper during neutron irradiation. Philos. Mag. A. 1986, 53, 233-42.
58. Brager, H. Effects of neutron irradiation to 63 dpa on the properties of various commercial copper alloys. J. Nucl. Mater. 1986, 141-3, 79-86.
59. Leffers, T.; Singh, B.; Buckley, S.; Manthorpe, S. Void-swelling in cold-worked copper during HVEM irradiation. J. Nucl. Mater. 1983, 118, 60-7.
60. Livak, R.; Zocco, T.; Hobbs, L. Neutron damage microstructures of high-conductivity copper alloys. J. Nucl. Mater. 1987, 144, 121-7.
61. Mukouda, I.; Shimomura, Y. Damage evolution in neutron-irradiated Cu during neutron irradiation. J. Nucl. Mater. 1999, 271-2, 230-5.
62. Singh, B. N.; Eldrup, M.; Horsewell, A.; Ehrhart, P.; Dworschak, F. On recoil energy dependent void swelling in pure copper Part I. Experimental results. Philos. Mag. A. 2000, 80, 2629-50.
63. Singh, B. N.; Eldrup, M.; Zinkle, S. J.; Golubov, S. I. On grain-size-dependent void swelling in pure copper irradiated with fission neutrons. Philos. Mag. A. 2002, 82, 1137-58.
64. Singh, B.; Horsewell, A.; Gelles, D.; Garner, F. Void swelling in copper and copper alloys irradiated with fission neutrons. J. Nucl. Mater. 1992, 191-4, 1172-6.
65. Singh, B.; Evans, J. Significant differences in defect accumulation behaviour between fcc and bcc crystals under cascade damage conditions. J. Nucl. Mater. 1995, 226, 277-85.
66. Singh, B.; Horsewell, A.; Toft, P.; Edwards, D. Temperature and dose dependencies of microstructure and hardness of neutron irradiated OFHC copper. J. Nucl. Mater. 1995, 224, 131-40.
67. Zinkle, S.; Stoller, R. Quantifying defect production in solids at finite temperatures: Thermally-activated correlated defect recombination corrections to DPA (CRC-DPA). J. Nucl. Mater. 2023, 577, 154292.
68. Barashev, A.; Golubov, S.; Osetsky, Y.; Stoller, R. Dissociation of migrating particle from trap with long-range interaction field. Philos. Mag. 2010, 90, 907-21.
69. Wakai, E.; Ezawa, T.; Imamura, J.; Takenaka, T.; Tanabe, T.; Oshima, R. Effect of solute atoms on swelling in Ni alloys and pure Ni under He+ ion irradiation. J. Nucl. Mater. 2002, 307-11, 367-73.
70. Packan, N. H.; Farrell, K.; Stiegler, J. O. Correlation of neutron and heavy-ion damage: I. The influence of dose rate and injected helium on swelling in pure nickel. J. Nucl. Mater. 1978, 78, 143-55.
Cite This Article
How to Cite
Download Citation
Export Citation File:
Type of Import
Tips on Downloading Citation
Citation Manager File Format
Type of Import
Direct Import: When the Direct Import option is selected (the default state), a dialogue box will give you the option to Save or Open the downloaded citation data. Choosing Open will either launch your citation manager or give you a choice of applications with which to use the metadata. The Save option saves the file locally for later use.
Indirect Import: When the Indirect Import option is selected, the metadata is displayed and may be copied and pasted as needed.
About This Article
Copyright

Data & Comments
Data
0


Comments
Comments must be written in English. Spam, offensive content, impersonation, and private information will not be permitted. If any comment is reported and identified as inappropriate content by OAE staff, the comment will be removed without notice. If you have any queries or need any help, please contact us at [email protected].