fig3

Void bias in irradiated model metals

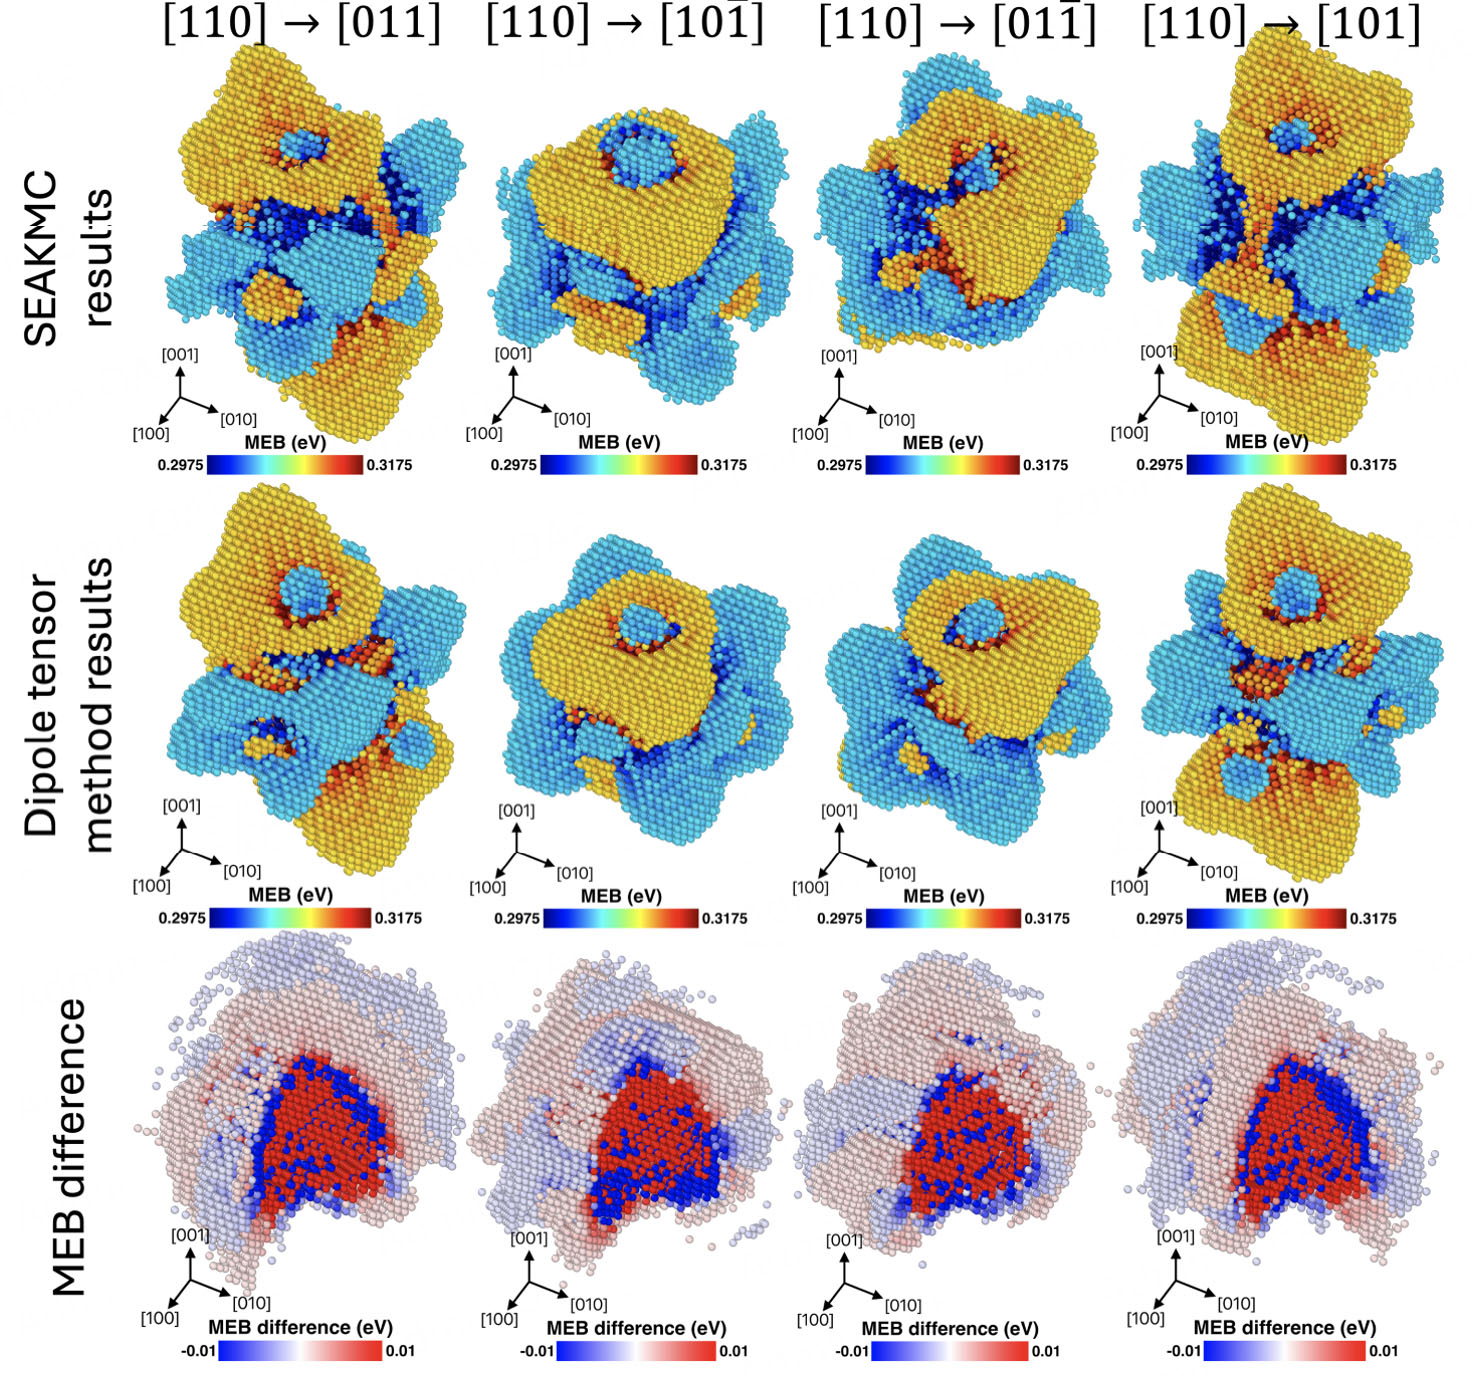
Figure 3. The 3-D MEB maps of a [110] dumbbell near a 4 nm void calculated using SEAKMC and dipole tensor method are compared, and the difference is displayed in red and blue. 1/4 of the MEB difference map is hidden for a clearer view in the core region.

Microstructures
ISSN 2770-2995 (Online)

Portico

All published articles are preserved here permanently:

https://www.portico.org/publishers/oae/

Portico

All published articles are preserved here permanently:

https://www.portico.org/publishers/oae/