


Wave-Reconstruction Generative Adversarial Networks (WRGAN): wave function predicted from a high-resolution electron microscopy images
 0
0 Abstract
High-resolution transmission electron microscopy (HRTEM) is indispensable for atomic-scale characterization yet fundamentally limited by the inherent phase loss in conventional detectors including CCD. To overcome this barrier, we propose Wave-Reconstruction Generative Adversarial Networks (WRGAN) that directly predict wave function amplitude and phase from single HRTEM images. Our physics-guided framework employs a Unet++ generator within a Generative Adversarial Networks (GAN) architecture via defining a physics-guided consistency loss. A key advantage is that WRGAN, trained solely on simulated data, demonstrates robust performance when directly applied to experimental images. Validation on experimental Nb8W9O47 image shows predicted amplitudes and phases closely match the groundtruth wave functions. Significantly, WRGAN successfully resolves upper and lower surface projections in noisy single-wall carbon nanotube (SWCNT) images, enabling near-atomic-resolution 3D reconstruction.
Keywords
INTRODUCTION
The high-resolution transmission electron microscope (HRTEM) is indispensable for atomic-scale characterization of nanomaterials, primarily due to its ability to rapidly acquire images corresponding to the projected structure across the entire field of view. This capability enables unique applications in imaging real-time dynamic evolution[1-3] and radiation-sensitive materials[4,5]. Despite the remarkable improvement in the resolution of HRTEM images enabled by spherical aberration correctors, a fundamental limitation persists: detectors capture only amplitude information, while the crucial phase information is entirely lost during acquisition. This loss is particularly consequential because the phase carries essential details about atomic-scale structural characteristics - such as localized strain, electric fields, and defect configurations - within the material. Consequently, recovering this missing phase has become one of the most important challenges in HRTEM.
The extraction of phase information remains an intriguing challenge for researchers, though it is only feasible algorithmically. Exit-wave function reconstruction using focal series of HRTEM images finds broad application[6], such as the maximum-likelihood framework algorithm[7], the iterative exit-wave function reconstruction (IWFR) method[8-10]. Strictly speaking in terms of the number of mathematical variables, at least two HRTEM images are required to reconstruct the complex wave function, and in practice, these reconstructions typically requires over ten images with small focus increments, fundamentally for precisely alignment[11]. Even though there are cases where phases or wave functions are obtained from single images, such methods either rely on the weak-phase object approximation[12,13], disregard amplitude information[14], or necessitate wave function reconstruction through serial imaging[15,16].
Conventional approaches require experienced researchers for reliable execution, presenting long-standing challenges. Recently, artificial intelligence (AI) algorithms have emerged to overcome these limitations, with several machine learning-based methods proposed to reconstruct exit-wave functions or resolve atomic structures from HRTEM images. An initial artificial neural network (ANN) recovered phase from single images, though lacking experimental validation[17]. Later, convolutional dual-decoder autoencoder (CDDAE) networks enabled simultaneous exit-wave reconstruction and denoising from single images[18]. Alternative approaches achieve robust phase retrieval from just two focal images, showing tolerance to noise and image shifts[19]. For 2D materials, machine learning can bypass phase retrieval entirely, directly resolving atomic structures - notably demonstrated for defects[20].
This study proposes Wave-Reconstruction Generative Adversarial Networks (WRGAN), a deep learning algorithm that directly predicts the exit-wave function from a single experimental HRTEM image acquired near the Scherzer focus. It should be noted that we only considered the effects of a rotationally symmetric point spread function, and therefore only altered the spherical aberration coefficient (Cs) and the Scherzer defocus condition. Introducing other aberrations would lead to excessive complexity in the point spread function. The method proposed in this paper is designed to simplify the problem, with the primary aim of addressing the most significant phase loss issue, particularly in cases where Cs and defocus are unknown. A defining feature of WRGAN is its physics-guided consistency loss. Specially, our algorithm demonstrates superior performance in both prediction accuracy and noise suppression, that is the outputs achieve a superior SNR compared to the input raw images. Critically, WRGAN has successfully reconstructed exit-wave functions from experimental HRTEM images of Nb8W9O47 crystals and single-wall carbon nanotubes (SWCNTs).
MATERIALS AND METHODS
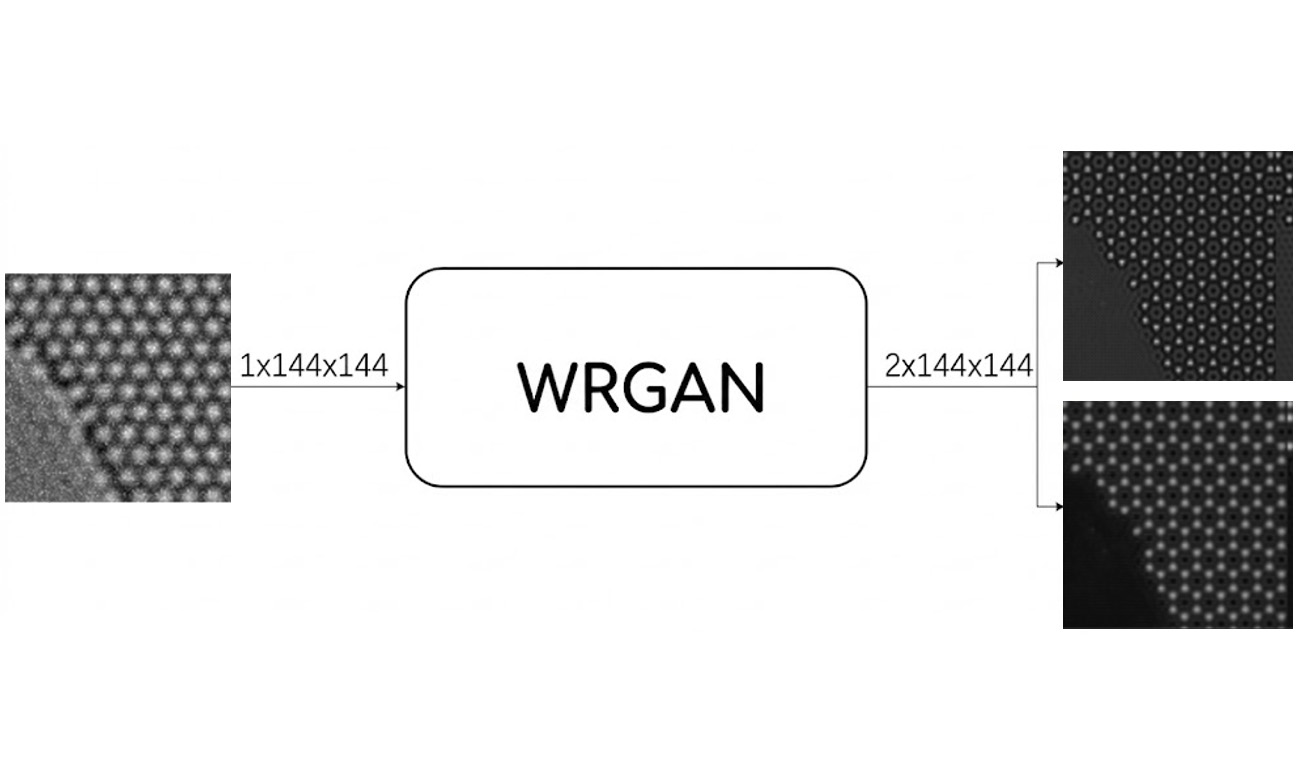
The Wave-Reconstruction Generative Adversarial Networks (WRGAN) is shown in Figure 1 and based on the Generative Adversarial Networks (GANs)[21], for directly predicting the amplitude/phase of the wave function from a single experimental HRTEM image.
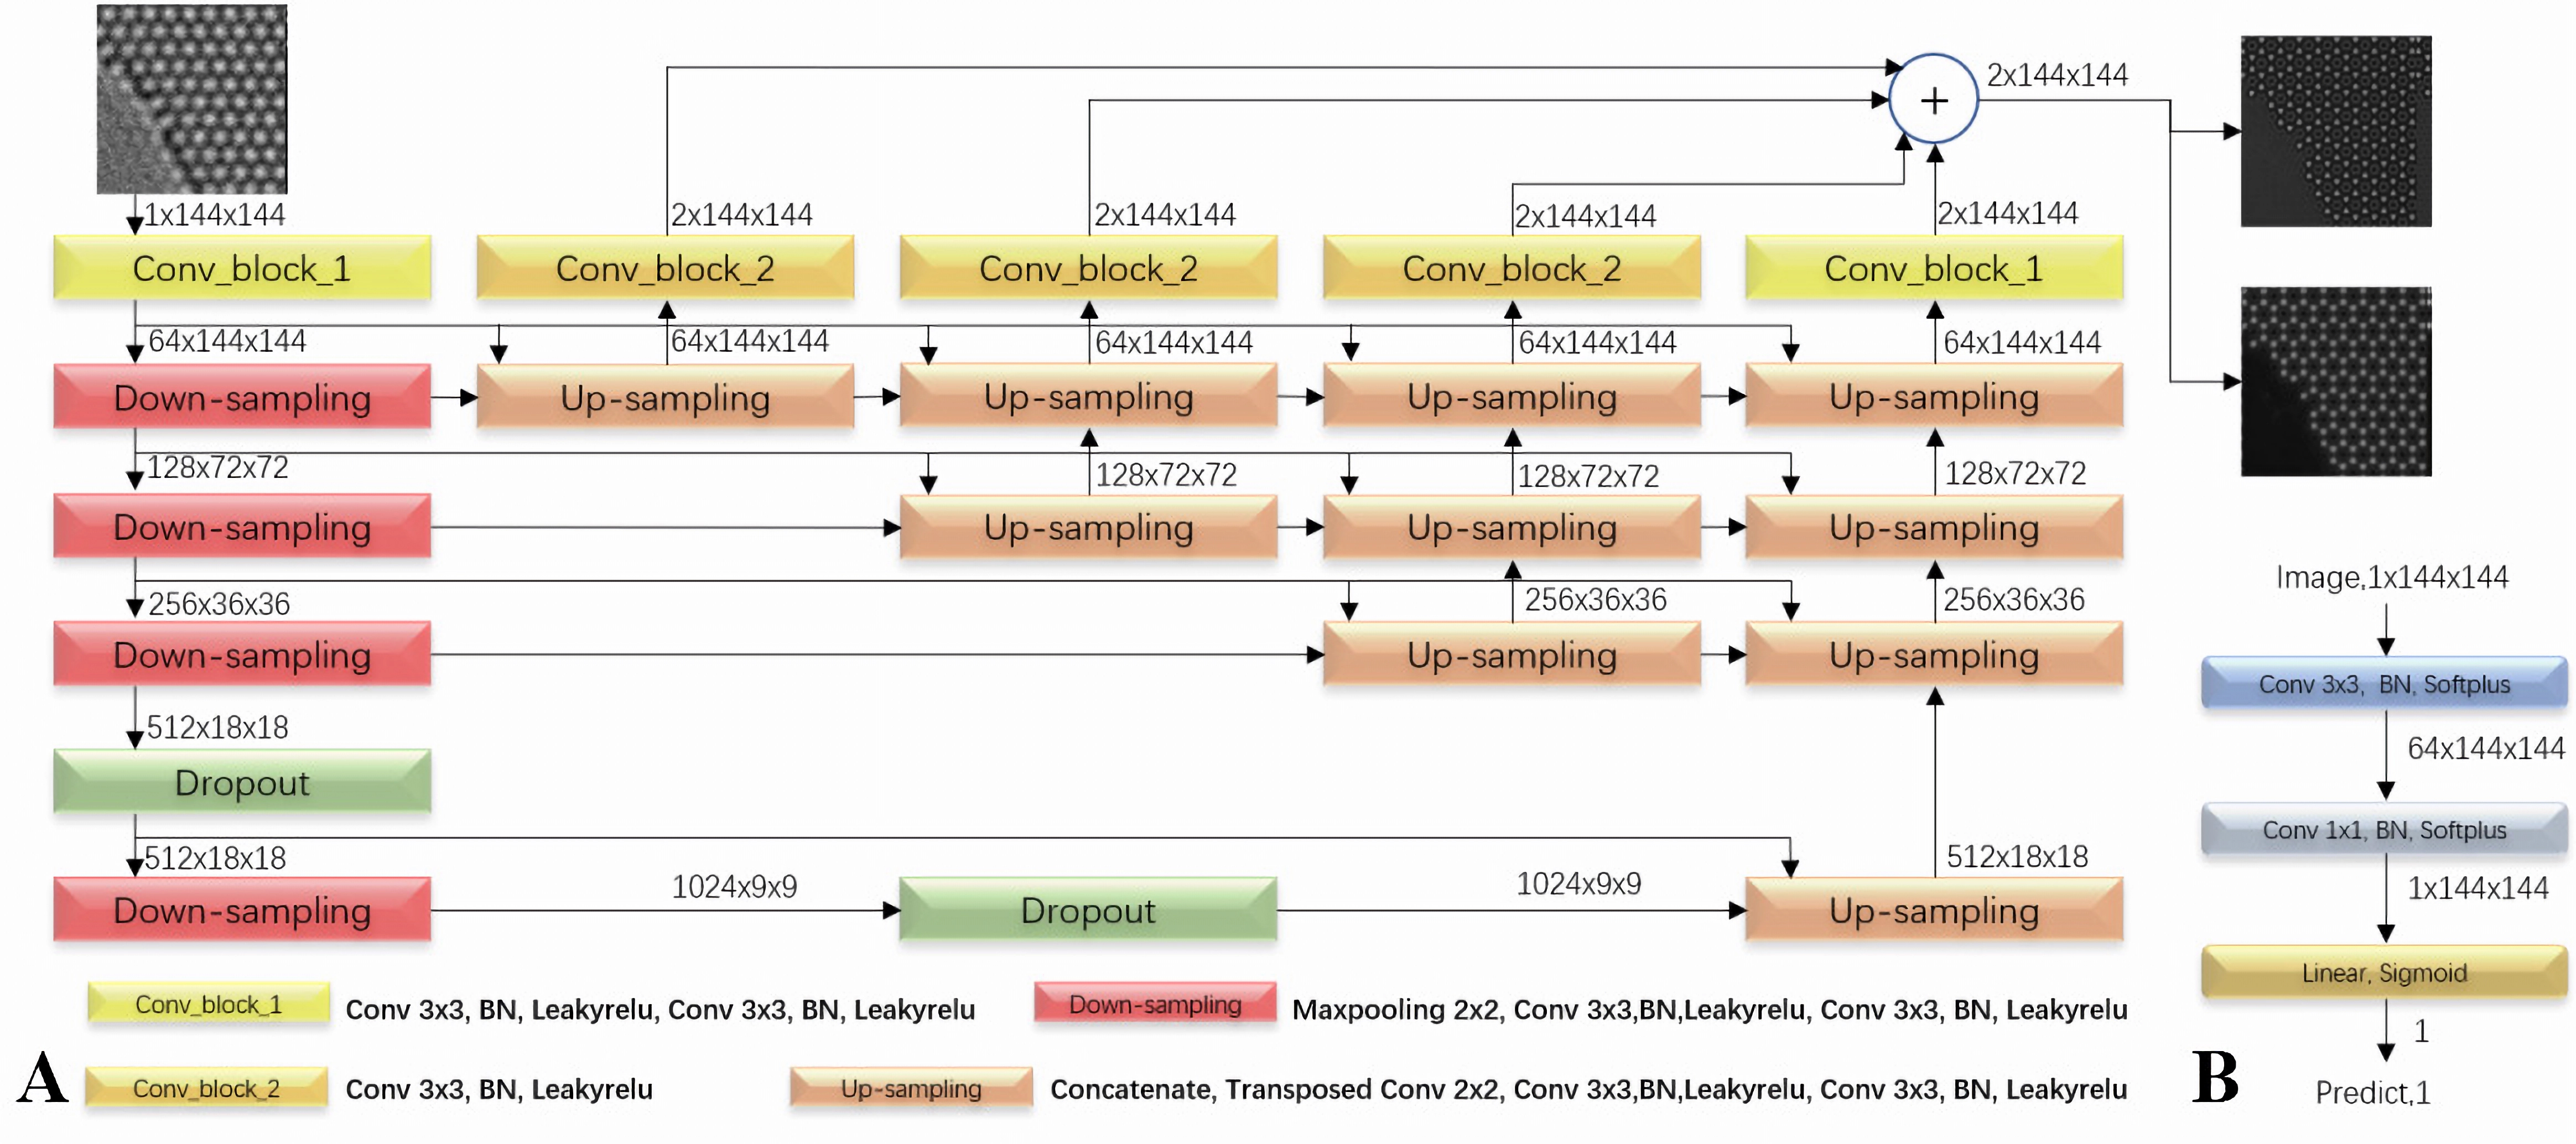
Figure 1. Network architecture of (A) the generator and (B) the discriminator in WRGAN. The numerical labels indicate the dimensions of input/output data, while arrows represent data flow directions. The color-coded blocks are described in the legend below. WRGAN: Wave-Reconstruction Generative Adversarial Networks.
The generator, shown in Figure 1A, employs an encoder-decoder architecture based on Unet++[22], comprising three core components: down-sampling blocks for feature extraction, up-sampling blocks for feature reconstruction, and dropout layers for regularization[23]. The fundamental building block, Conv_block_2, consists of a 3 × 3 convolutional layer, batch normalization (BN)[24], and leaky ReLU activation[25] with unconventional parameter settings distinct from common implementations. This block is repeated twice to form Conv_block_1. Down-sampling blocks reduce spatial dimensions and encode features using a 2 × 2 max-pooling layer (stride 2) followed by Conv_block_2. Up-sampling blocks recover image details through decoding, starting with a transposed convolutional layer[26] for up-sampling, followed by channel-wise concatenation and a Conv_block_1. Dropout layers mitigate overfitting by randomly deactivating neurons during training, enhancing model robustness, noise tolerance, and generalization. The discriminator in Figure 1B produces an output probability (0 to 1) of authenticity using three sequential blocks: a 3 × 3 convolutional layer with BN activated by Softplus[27], a 1 × 1 convolutional layer with BN and Softplus activation, and a fully connected layer activated by a Sigmoid function. Details of the activation function are in Supplementary 1, and parameters about training are listed in Supplementary Table 1.
A defining feature of WRGAN is its physics-guided consistency loss, respectively for the generator and the discriminator. The generator loss function Lg combines the Mean Absolute Error (LMAE), Mean Square Error (LMSE), and Structural Similarity Index (LSSIM). The discriminator loss function Ld is primarily based on the LMAE. These loss functions are defined as follows:
(1)
and,
(2)
The generator takes an HRTEM image as input (shown in the upper left corner of Figure 1A) and outputs the predicted amplitude/phase images of the wave function, denoted by G (illustrated in upper right corner of Figure 1A), while D(…) represents the output of the discriminator. G includes the amplitude and phase images, as well as W (the groundtruth wave function). Thus, each of the terms of LMSE(G,W) and LSSIM(G,W) has two components. The lens transfer functions are required for each set of images in the training set, and I(W) and I(G) represents the images simulated from W and G using traditional simulation theory, respectively. Notably, the W’s phase has been constrained to a special range [-π, π] so that the predicted phase is not a true physical phase. Such constraint ensures a complete numerical distribution of phase data in each image. Conversely, without range restriction, phase values would excessively concentrate in lower-value regions, leading to severe scarcity of critical information near π, which in turn compromises the network's phase estimation capability. Although the current method has the aforementioned limitations, if the wave function reconstructed from images of samples with varying thicknesses exhibits a broad and reasonably distributed phase range, it holds potential for applications in quantitative analysis, such as stress or magnetic field mapping. However, this paper primarily focuses on solving for the phase induced by a single thickness condition, which inherently restricts its applicability to more complex quantitative problems.
RESULTS AND DISCUSSION
Due to the impossibility of experimental exit-wave reconstruction, we use only simulated images to train on a mixed dataset of five crystalline materials in our application: graphene (thickness is 0.50 Å), Al2CuMg (4.01 Å), Nb8W9O47 (7.89 Å), SrNd2Ti4O12 (7.71 Å), and Au imaged along [100] (25.91 Å) and [111] (26.49 Å) directions. TEM conditions included: 80/200/300 kV acceleration voltages, Cs = 0 ~ 100 μm, and Scherzer focus. For each structure, 400 HRTEM images were generated, yielding a total dataset of 2,400 images with Poisson noise added to achieve signal-to-noise ratio of ~ 1.0.
During training, we performed 10-fold cross-validation, selecting the model with minimal average error. The model employs distinct learning rates for the generator and discriminator. The generator utilizes a dynamic learning rate schedule with three stages. The learning rate in the initial stage is set to 3e-4. After 20% of training, it reduces to 2e-4. After 50% of training stage, the learning rate further reduces to the final value of 5e-5. The discriminator maintains a constant learning rate of 2e-5 throughout training.
Trained network [Supplementary 2] is evaluated using six simulated noisy images, shown in the first column of Figure 2A, and their structures are Al2CuMg, Au along [0 0 1] direction, Au along [1 1 1] direction, Nb8W9O47, SrNd2Ti4O12 and graphene from the top to the bottom rows. The network successfully estimated both amplitude and phase images, which are then compared with their corresponding groundtruths, shown in the other columns in Figure 2A. Each prediction is completed in approximately 10 ms.
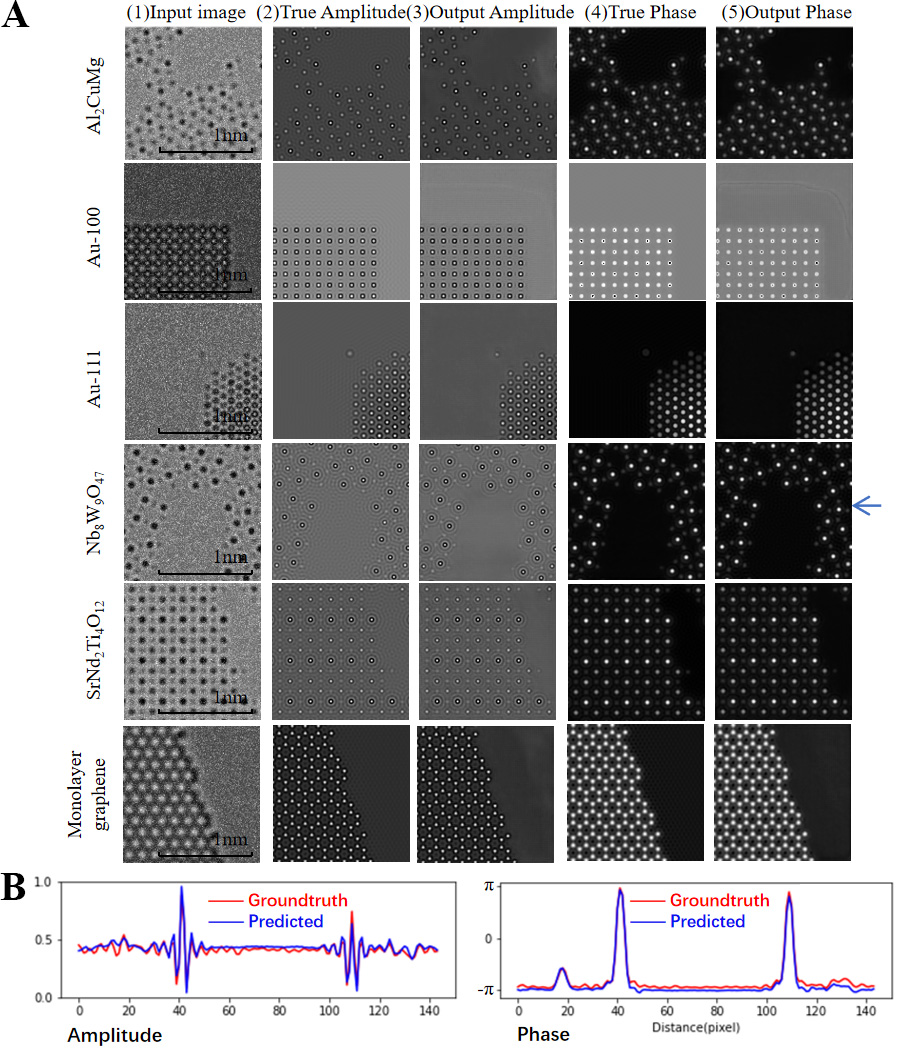
Figure 2. (A) HRTEM test images and their corresponding wave function reconstruction. Rows show the images of different structure; and columns show (left to right): (1) input HRTEM images, (2) groundtruth amplitude, (3) predicted amplitude, (4) groundtruth phase, and (5) predicted phase. (Quantitative comparison is illustrated in Supplementary 3); (B) The intensity profiles of the amplitude and phase components of the groundtruth wave function versus the WRGAN-predicted wave function from the simulated HRTEM image of Nb8W9O47, along the horizon lines indicated by the arrow in (A). HRTEM: High-resolution transmission electron microscopy; WRGAN: Wave-Reconstruction Generative Adversarial Networks.
The network excels at wave function prediction: (1) predicted amplitudes closely match ground truth in crystals, with minimal background variation; (2) phases replicate ground truth perfectly; and (3) vacuum edges remain artifact-free - no spurious atoms or lost real atoms. Figure 2B confirms this, showing excellent amplitude/phase profiles agreeing with the groundtruth’s. The phase prediction is particularly accurate, displaying smoother vacuum variations and better consistency with expectation.
The reconstruction performance of WRGAN is bench-marked against two comparable deep learning methods: ANNs[17] and CDDAE[18]. For fair comparison, all networks are trained using identical training datasets. Quantitative evaluation is performed on 120 test HRTEM images (20 per crystal structure) using two metrics: Peak signal-to-noise ratio (PSNR) for both amplitude and phase predictions, and structural similarity index measure (SSIM) between predicted and groundtruth amplitude/phase. As shown in Table 1, our WRGAN demonstrates superior performance, evidenced by higher PSNR value indicating better signal preservation, and greater SSIM scores reflecting improved structural fidelity to groundtruth. (The index values of the images in Figure 2 are listed in Supplementary Tables 2-7).
The PSNR and SSIM values averaged from the amplitude and phase images predicted via the networks of WRGAN, ANNs and CDDAE
Furthermore, the networks are evaluated based on the MSE between the images simulated from the predicted wave function and those from the groundtruth wave function. The test data comprises a total of 120 MSE values, with errors calculated for each image predicted by the three networks. Figure 3 plots these MSEs, arranged from left to right for each materials: Al2CuMg, Au-[1 0 0], Au-[1 1 1], Nb8W9O47, SrNd2Ti4O12, and monolayer graphene, confirming WRGAN’s superior performance.
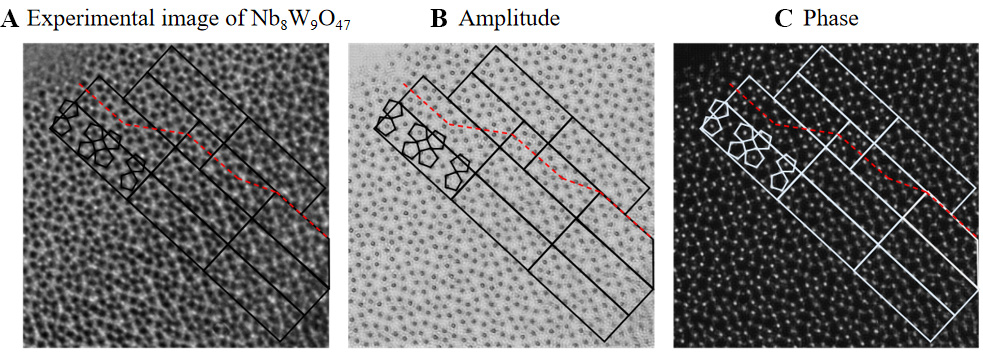
Figure 3. The MSEs values for the simulated HRTEM images, calculated as the difference between images simulated from the predicted wave functions and the groundtruth images. The x-axis represents the image structures including 20 per crystalline structure (with a total of 120 test images). The red, magenta, and yellow lines correspond to the MSEs of the WRGAN, CDDAE, and ANNs networks, respectively. MSE: Mean square error; HRTEM: high-resolution transmission electron microscopy; WRGAN: Wave-Reconstruction Generative Adversarial Networks ANN: artificial neural network.
An experimental HRTEM image of Nb8W9O47[28] is presented and a defect-containing subregion [Figure 4A] is analyzed, with the resulting wave function’s amplitude and phase shown in Figure 4B and C respectively. Both the lattice features and defect structures exhibit strong agreement with expected atomic configurations, demonstrating WRGAN’s reliability.
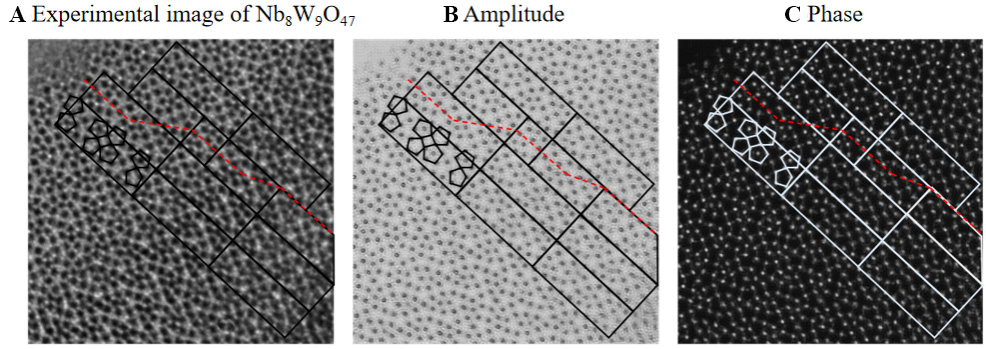
Figure 4. (A) Experimental image of Nb8W9O47; (B) Amplitude and (C) phase images of the predicted wave function, obtained from (A) using the proposed WRGAN method. WRGAN: Wave-Reconstruction Generative Adversarial Networks.
Another example is used for HRTEM images of single-walled carbon nanotubes (SWCNTs), and we constructed a dedicated dataset. A total of 4,800 HRTEM images were simulated under Scherzer focus conditions with Cs ranging from 0 to 100 μm at 80 kV accelerating voltage. The dataset was generated through the following steps: (i) Structure generation: SWCNT structures with chiral indices from (11, 0) to (11, 11) (12 chiral types) were generated using NanoTubo software, each measuring 100 nm in length; (ii) Defect engineering: Random atomic removal and bond rearrangement introduced predominant 5-7 and 5-8 topological defects; (iii) Structural relaxation: Defect-containing structures were energy-minimized using molecular dynamics simulations to achieve physically realistic configurations; (iv) Noisy HRTEM simulation: Images were simulated via ToTEM software[29], and polluted by Poisson noise (the power ratio of signal to noise is approximately 1.5); (v) Horizontal/vertical flipping applied for data diversity enhancement. Specially, the defects in each 140 × 140-pixel image is characterized as follows: the total number of defects is typically 5-7 topological defects, with a maximum of 2 observed; the 5-8 topological defects generally occur singly per image; and, the proportion of point defects corresponding to atom removal is notably low, estimated to be less than 1% across all defects.
Figure 5A and B present simulated and experimental HRTEM images of SWCNTs. Figure 5C-F display the WRGAN-predicted phase (upper atomic layer) and amplitude (lower layer), consistent with bilayer graphene theory. While these phase and amplitude images resolve atomic positions within each layer, sidewall atoms exhibit distortion and remain unresolved. Figure 5G maps atomic positions derived from the simulation in Figure 5A onto a 2D plane, revealing missing sidewall atoms (identified by phase-derived centers and amplitude-derived edges). To compensate, amplitude-derived positions were bisected using interatomic distance constraints. Figures 5H and I show the resulting filled atomic structures derived from simulation and experiment, demonstrating how combined phase/amplitude information resolves the previously missing atoms. Finally, Figure 5J presents the cylindrically reconstructed 3D atomic model. These calculations rely on two key assumptions: (1) SWCNT atoms reside on a cylindrical surface, and (2) the interatomic distance remains constant at 1.42 Å, which enables the determination of the carbon atoms' height. These mathematical postulates serve as the foundation for deriving the three-dimensional structure and its subsequent rolling into a nanotube.
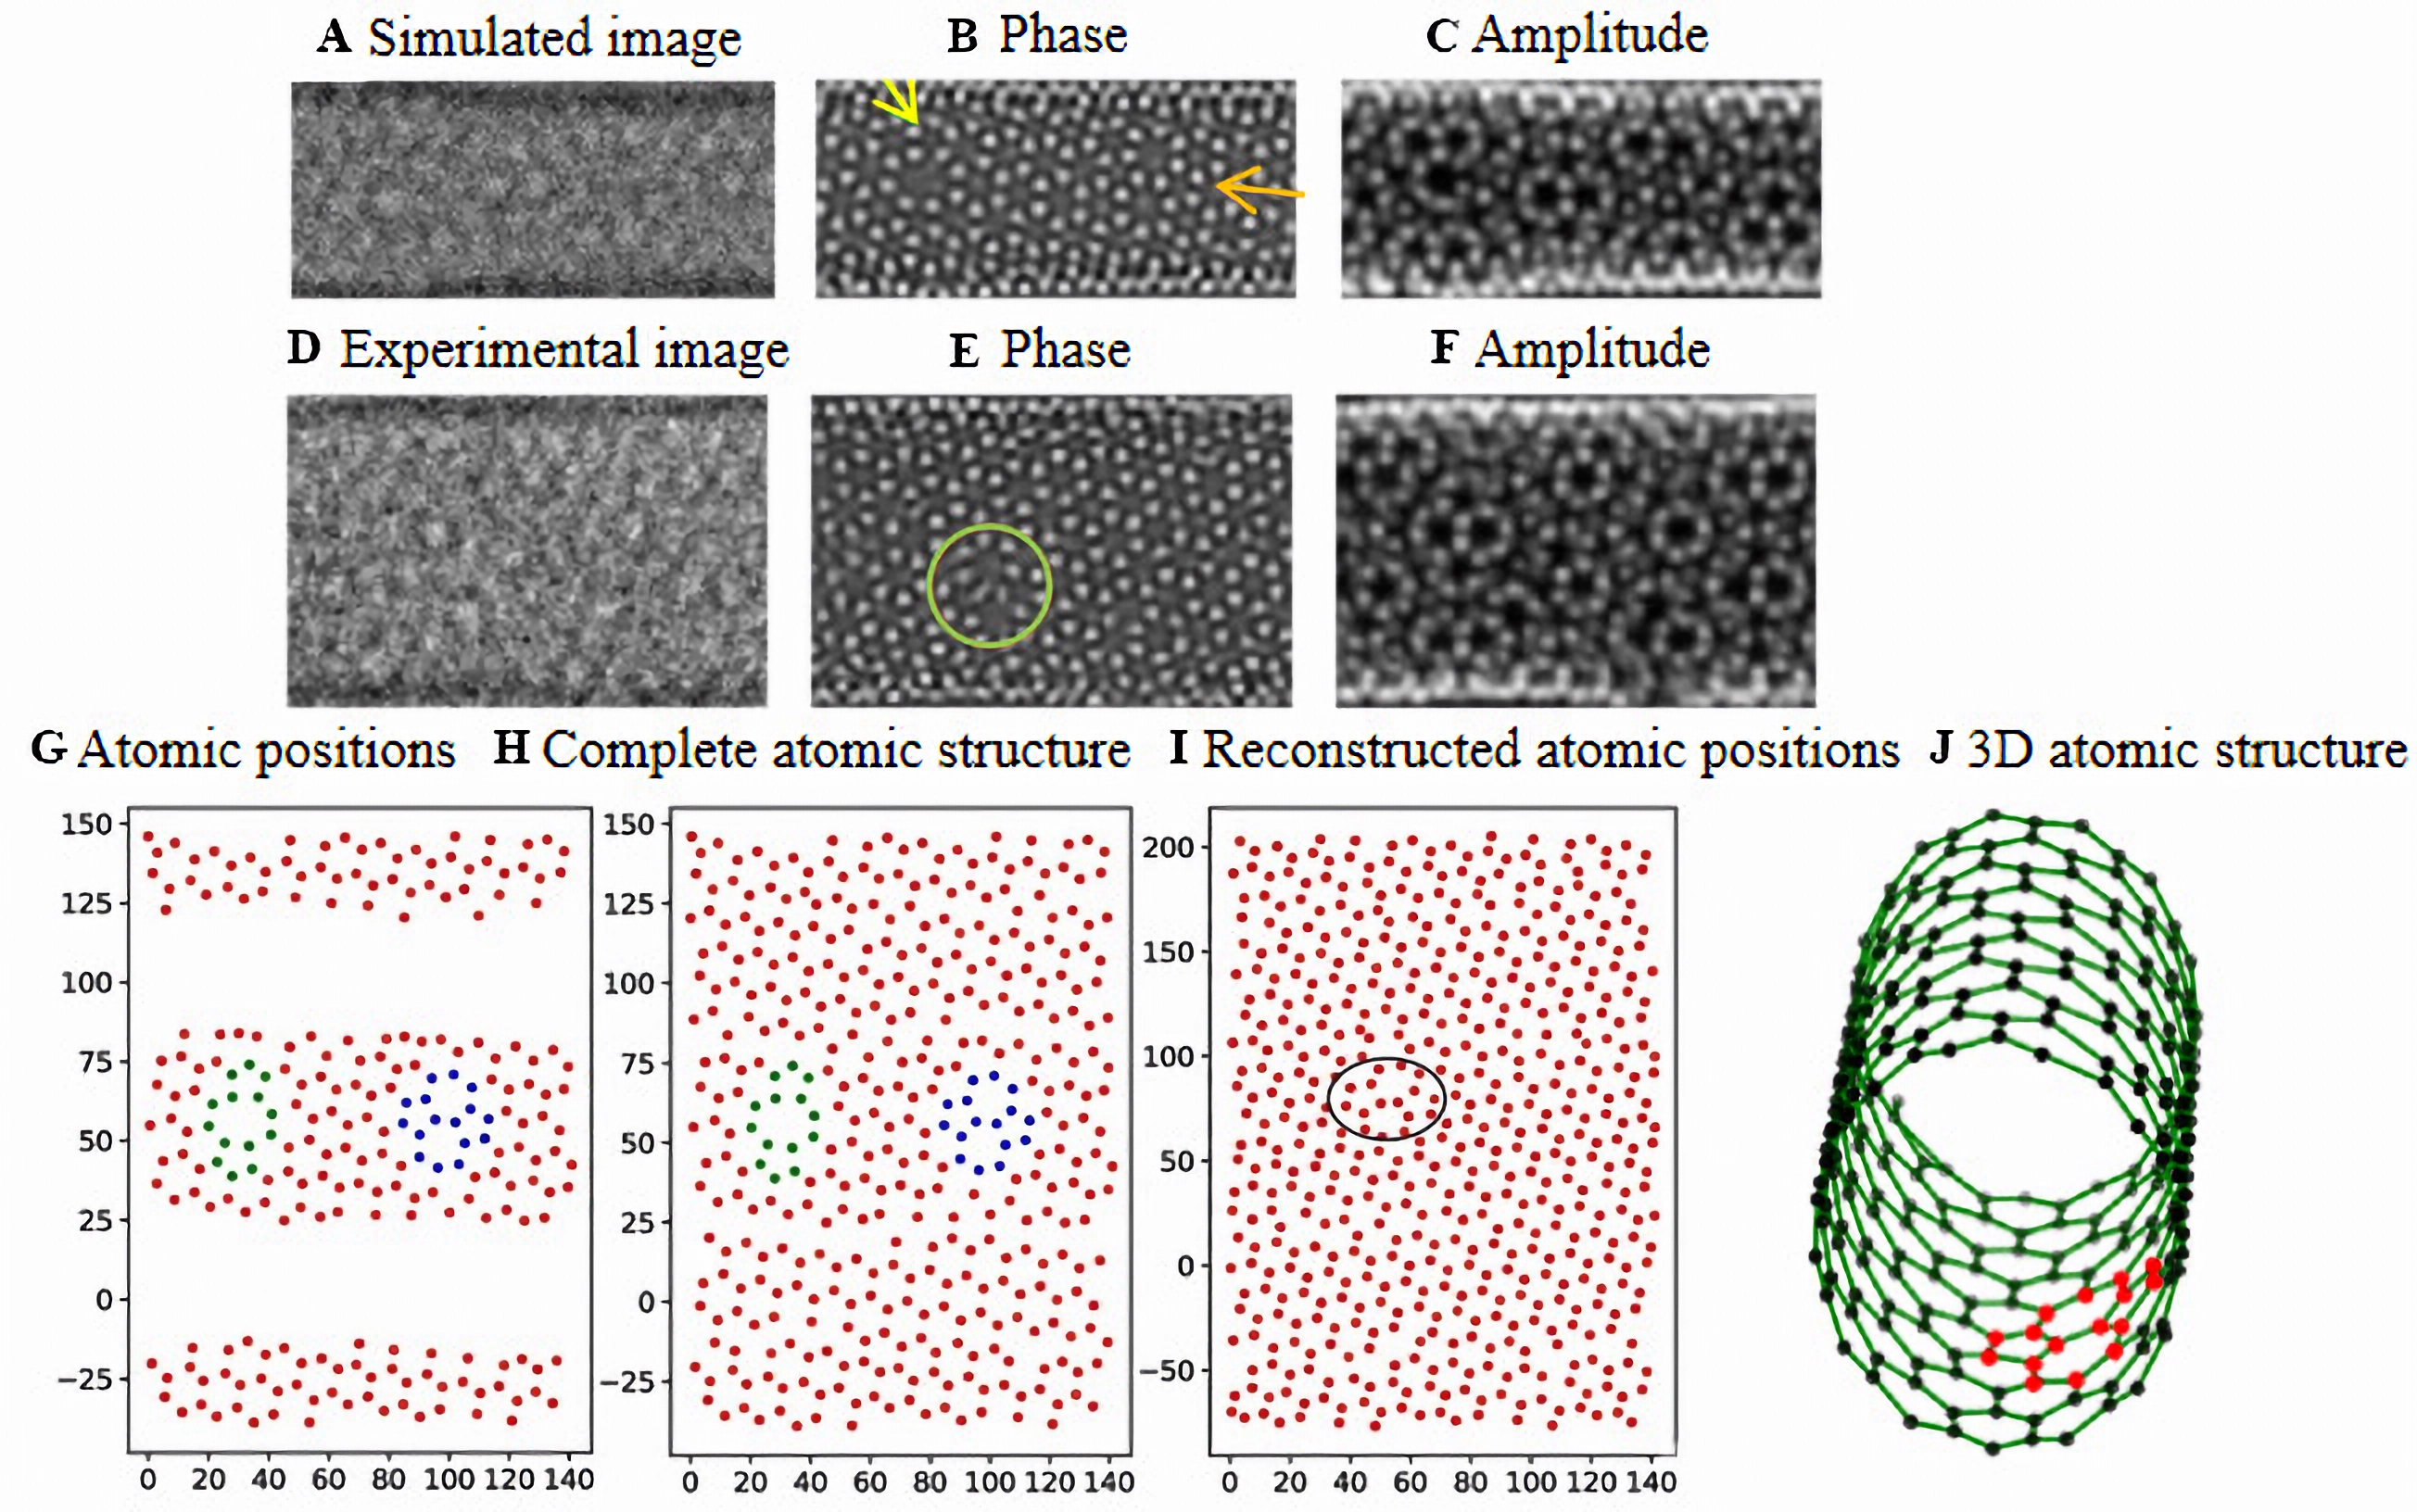
Figure 5. (A) Simulated and (B) experimental HRTEM images of an SWCNT. (C and D) Phase and (E and F) amplitude components of the wave function predicted from (C and E) simulated and (D and F) experimental images using WRGAN; (G) Atomic positions extracted from (C and E) and projected onto a 2D plane, corresponding to the simulated HRTEM image; (H) Complete atomic structure after estimating missing sidewall atoms in (G); (I) Final reconstructed atomic positions derived from (D and F) with all missing atoms interpolated. Defect sites are highlighted in (C and D) and (G-I); (J) The 3D atomic structure after cylindrical rolling from the sheet of (I). HRTEM: High-resolution transmission electron microscopy; SWCNT: single-walled carbon nanotube; WRGAN: Wave-Reconstruction Generative Adversarial Networks.
Specially, since the training set incorporates defect structures and their corresponding HRTEM images, the predicted phase and amplitude component successfully reconstruct atomic positions in defective regions. As demonstrated in Figures 5G and H, the predicted blue and green defect sites show excellent agreement with an ideal structures. Furthermore, the experimental results in Figures 5I and J clearly identify defect locations, which have been marked with circles for clarity. Furthermore, CNTs with entirely different chiralities can also be reconstructed from experimental images, as demonstrated in Figure 5I, where the chirality clearly lies outside the training set's range.
CONCLUSIONS
We propose WRGAN, a neural network architecture combing GAN and U-NETs structures, capable of predicting amplitude/phase of wave function from a single HRTEM image. The training dataset for this network comprises simulated images including wave functions, HRTEM images, and lens transfer functions. The network employs a HRTEM theoretic imaging theory where images simulated from the predicted wave functions are compared with those generated from the groundtruth wave functions, thereby enhancing the discriminator's capability. However, this method also has its limitations: (i) the networks are trained for the HRTEM images imaged at the Scherzer focuses with a certain range of Cs, and we have simplified the problem by excluding the influence from astigmatisms, which may be a necessary trade-off to maintain prediction performance under optimal imaging conditions; (ii) the predicted phase is not an actual physical phase because the phase of the wave function of the input groundtruth have been constrained to the range [-π π].
Nevertheless, WRGAN demonstrates robust quantitative accuracy in predicting wave functions for crystalline materials. Trained on defect-free Nb8W9O47 simulations, it successfully reconstructs experimental images with unseen linear defects. Applied to SWCNTs beyond training chirality ranges, it resolves upper/lower surface structures, enabling 3D defect analysis. The networks achieves minimal MSE in benchmark tests and outperforms existing methods; it generalizes to diverse crystal structures and effectively recovers missing phase information, algorithmically compensating for hardware limitations in phase recording.
DECLARATIONS
Acknowledgments
We thank Professor A.I. Kirkland for granting permission to use the experimental HRTEM images of Nb8W9O47.
Authors’ contributions
Conceived and designed the research, developed the neural network, generated the datasets, and performed the algorithm testing and application: Chen, S.; Lin, S.
Implemented the code and supported the algorithm development: Liu, J.; Huang, Y.; Sima, Y.
Conceived and designed the research, conducted software simulation, provided technique guidance, and verified the detail of experiment and networks: Lin, F.
All authors have read and agreed to the published version of the manuscript.
Availability of data and materials
Code is available upon request from the corresponding author.
AI and AI-assisted tools statement
Not applicable.
Financial support and sponsorship
This work was supported by the National Natural Science Foundation of China (Grant No. 61971201) and Key Research Project in Priority Areas of Guangdong Provincial Universities (Grant No. 2025ZDZX1002).
Conflicts of interest
All authors declared that there are no conflicts of interest.
Ethical approval and consent to participate
Not applicable.
Consent for publication
Not applicable.
Copyright
© The Author(s) 2026.
Supplementary Materials
REFERENCES
1. Xu, T.; Hou, L.; Zhou, Z.; et al. Lithiation dynamics in vertically aligned 1T-PtSe2 and its application in dendrite-free lithium metal batteries. Appl. Phys. Lett. 2025, 126, 203901.
2. Zhang, B.; Zhao, L.; Cheng, Y.; Golberg, D.; Wang, M. S. Reversible tuning of individual carbon nanotube mechanical properties via defect engineering. Nano. Lett. 2016, 16, 5221-7.
3. Vincent, J. L.; Crozier, P. A. Atomic level fluxional behavior and activity of CeO2-supported Pt catalysts for CO oxidation. Nat. Commun. 2021, 12, 5789.
4. Li, X.; Wang, J.; Liu, X.; et al. Direct imaging of tunable crystal surface structures of MOF MIL-101 using high-resolution electron microscopy. J. Am. Chem. Soc. 2019, 141, 12021-8.
5. Han, X.; Liu, P.; Lin, F.; et al. Structures and structural evolution of sublayer surfaces of metal-organic frameworks. Angew. Chem. Int. Ed. Engl. 2020, 59, 21419-24.
6. Guedj, C.; Hung, L.; Zobelli, A.; Blaise, P.; Sottile, F.; Olevano, V. Evidence for anisotropic dielectric properties of monoclinic hafnia using valence electron energy-loss spectroscopy in high-resolution transmission electron microscopy and ab initio time-dependent density-functional theory. Appl. Phys. Lett. 2014, 105, 222904.
7. Hsieh, W. K.; Chen, F. R.; Kai, J. J.; Kirkland, A. I. Resolution extension and exit wave reconstruction in complex HREM. Ultramicroscopy 2004, 98, 99-114.
8. Bhat, U.; Datta, R. Direct methods applied to phase retrieval in high resolution transmission electron microscopy. J. Phys. Commun. 2022, 6, 045007.
9. Coene, W.; Thust, A.; Op De Beeck, M.; Van Dyck, D. Maximum-likelihood method for focus-variation image reconstruction in high resolution transmission electron microscopy. Ultramicroscopy 1996, 64, 109-35.
10. Allen, L. J.; McBride, W.; O’Leary, N. L.; Oxley, M. P. Exit wave reconstruction at atomic resolution. Ultramicroscopy 2004, 100, 91-104.
11. Ming, W. Q.; Chen, J. H.; He, Y. T.; Shen, R. H.; Chen, Z. K. An improved iterative wave function reconstruction algorithm in high-resolution transmission electron microscopy. Ultramicroscopy 2018, 195, 111-20.
12. Tang, C. Y.; Chen, J. H.; Zandbergen, H. W.; Li, F. H. Image deconvolution in spherical aberration-corrected high-resolution transmission electron microscopy. Ultramicroscopy 2006, 106, 539-46.
13. Lehtinen, O.; Geiger, D.; Lee, Z.; et al. Numerical correction of anti-symmetric aberrations in single HRTEM images of weakly scattering 2D-objects. Ultramicroscopy 2015, 151, 130-5.
14. Lin, F.; Ren, X. B.; Zhou, W. P.; et al. Exit-wave phase retrieval from a single high-resolution transmission electron microscopy image of a weak-phase object. Micron 2018, 114, 23-31.
15. Zhang, X.; Chen, S.; Wang, S.; Huang, Y.; Jin, C.; Lin, F. Exit wave reconstruction of a focal series of images with structural changes in high-resolution transmission electron microscopy. J. Microsc. 2024, 296, 24-33.
16. Meng, Y.; Wang, S.; Ren, X.; et al. Combining machine learning algorithms with traditional methods for resolving the atomic-scale dynamic structure of monolayer MoS2 in high-resolution transmission electron microscopy. Chinese. Phys. B. 2025, 34, 016802.
17. Ede, J. M.; Peters, J. J. P.; Sloan, J.; Beanland, R. Exit wavefunction reconstruction from single transmission electron micrographs with deep learning.
18. Lee, J.; Lee, Y.; Kim, J.; Lee, Z. Contrast transfer function-based exit-wave reconstruction and denoising of atomic-resolution transmission electron microscopy images of graphene and Cu single atom substitutions by deep learning framework. Nanomaterials. (Basel). 2020, 10, 1977.
19. Leth Larsen, M. H.; Dahl, F.; Hansen, L. P.; et al. Reconstructing the exit wave of 2D materials in high-resolution transmission electron microscopy using machine learning. Ultramicroscopy 2023, 243, 113641.
20. Meng, Z.; Ming, W.; He, Y.; Shen, R.; Chen, J. Exit wave function reconstruction from two defocus images using neural network. Micron 2024, 177, 103564.
21. Goodfellow, I.; Pouget-abadie, J.; Mirza, M.; et al. Generative adversarial networks. Commun. ACM. 2020, 63, 139-44.
22. Zhou, Z.; Siddiquee, M. M. R.; Tajbakhsh, N.; Liang, J. UNet++: A Nested U-Net Architecture for Medical Image Segmentation.
23. Srivastava, N.; Hinton, G.; Krizhevsky, A.; Sutskever, I.; Salakhutdinov, R. Dropout: a simple way to prevent neural networks from overfitting. J. Mach. Learn. Res. 2014, 15, 1929-58.
24. Ioffe, S.; Szegedy, C. Batch normalization: accelerating deep network training by reducing internal covariate shift.
25. Maas, A. L.; Hannun, A. Y.; Ng, A. Y. Rectifier nonlinearities improve neural network acoustic models. Proc. ICML. 2013, 3. , 1-6. https://www.awnihannun.com/papers/relu_hybrid_icml2013_final.pdf (accessed 2026-4-3).
26. Dumoulin, V.; Visin, F. A guide to convolution arithmetic for deep learning.
27. Zhao, H.; Liu, F.; Li, L.; Luo, C. A novel softplus linear unit for deep convolutional neural networks. Appl. Intell. 2017, 48, 1707-20.
28. Meyer, R. R.; Kirkland, A. I.; Saxton, W. O. A new method for the determination of the wave aberration function for high resolution TEM 1. Measurement of the symmetric aberrations. Ultramicroscopy 2002, 92, 89-109.
Cite This Article
How to Cite
Download Citation
Export Citation File:
Type of Import
Tips on Downloading Citation
Citation Manager File Format
Type of Import
Direct Import: When the Direct Import option is selected (the default state), a dialogue box will give you the option to Save or Open the downloaded citation data. Choosing Open will either launch your citation manager or give you a choice of applications with which to use the metadata. The Save option saves the file locally for later use.
Indirect Import: When the Indirect Import option is selected, the metadata is displayed and may be copied and pasted as needed.
About This Article
Copyright

Data & Comments
Data
0


Comments
Comments must be written in English. Spam, offensive content, impersonation, and private information will not be permitted. If any comment is reported and identified as inappropriate content by OAE staff, the comment will be removed without notice. If you have any queries or need any help, please contact us at [email protected].