


fig2
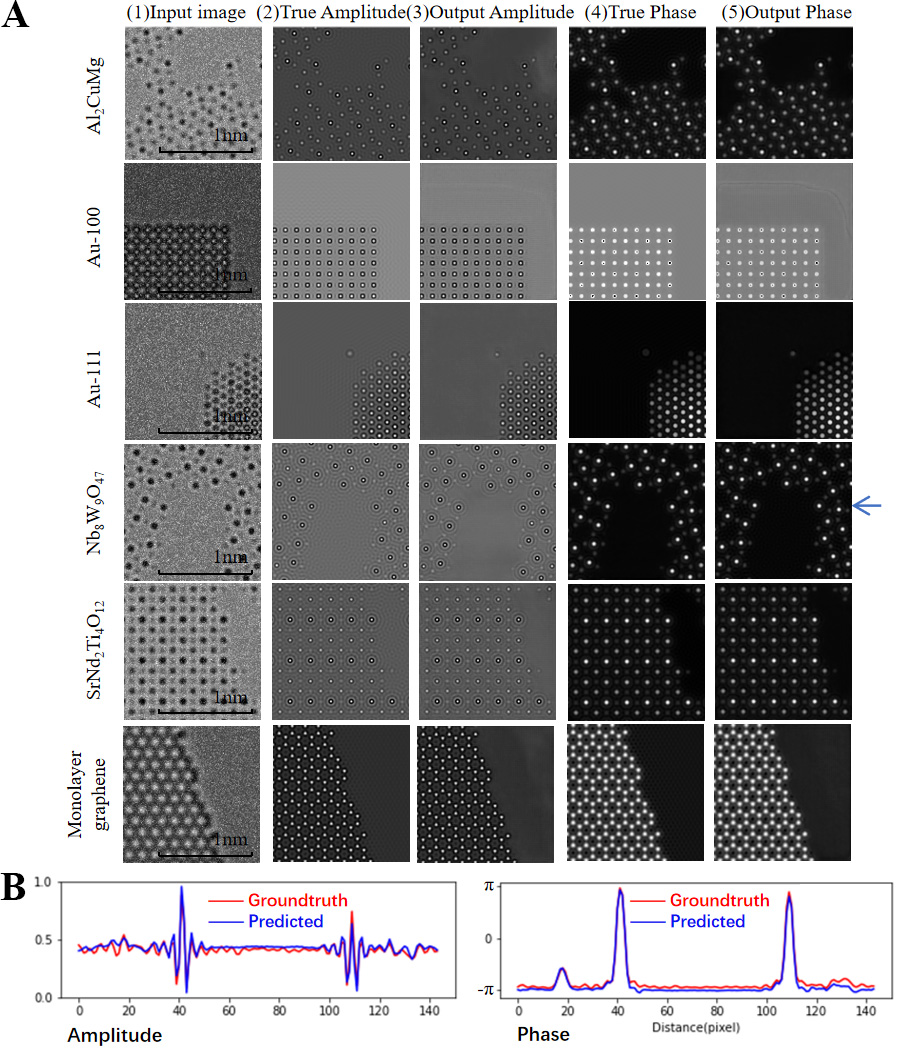
Figure 2. (A) HRTEM test images and their corresponding wave function reconstruction. Rows show the images of different structure; and columns show (left to right): (1) input HRTEM images, (2) groundtruth amplitude, (3) predicted amplitude, (4) groundtruth phase, and (5) predicted phase. (Quantitative comparison is illustrated in Supplementary 3); (B) The intensity profiles of the amplitude and phase components of the groundtruth wave function versus the WRGAN-predicted wave function from the simulated HRTEM image of Nb8W9O47, along the horizon lines indicated by the arrow in (A). HRTEM: High-resolution transmission electron microscopy; WRGAN: Wave-Reconstruction Generative Adversarial Networks.


