

Benchmark dose modeling to define permissible exposure levels for environmental cadmium
 0
0 Abstract
Kidney and bone destruction in patients with itai-itai disease is caused by consuming rice contaminated with the heavy metal cadmium (Cd). Based on a lifetime intake of 2 g of Cd, and an elevation of β2-microglobulin (β2M) excretion rate, a tolerable Cd intake level was 0.83 µg/kg body weight per day (58 µg/day for a 70 kg person), with a threshold of 5.24 µg/g creatinine. However, current evidence suggests that these guidelines are inadequate to protect public health. Using experimental dosing and human population data, this review highlights the imprecision in determining exposure, internal doses, and adverse effects, leading to erroneous conclusions that Cd exposure did not diminish the estimated glomerular filtration rate (eGFR) nor did it accelerate progressive eGFR decline toward kidney failure among Cd-exposed people. It discusses the principles and application of the benchmark dose (BMD) modeling to human exposure-effect relationships from which the critical Cd exposure levels can be identified reliably, with kidney effect indicators other than the β2M excretion. It offers insights into the utility of multiple mathematical dose-response models to define the benchmark dose limit (BMDL) value for Cd exposure, which carries discernible health risk. From BMD modeling studies, Cd excretion benchmarks for early kidney effects, reflected by excretion of total proteins, N-acetyl-β-D-glucosaminidase, and eGFR decline, were 0.95, 1.34, and 3.24% of the current threshold, respectively. These Cd excretion levels are ideal for the derivation of safe Cd exposure guidelines because they are equivalent to no-observed-adverse-effect levels (NOAELs).
Keywords
INTRODUCTION
Consumption of rice contaminated with the toxic metal cadmium (Cd) can cause itai-itai disease, characterized by marked loss of kidney mass, osteoporosis, osteomalacia, and multiple bone fractures[1-4]. Recently, there has been a significant decrease in the worldwide production and industrial uses of Cd; however, with the continued use of Cd-contaminated phosphate fertilizers in many parts of the world, it is still being added to the food chain[5-7]. Approximately 15% of the world’s cropland is found to be contaminated with toxic metals, especially Cd[8]. Our reliance on phosphate fertilizers for the production of foods and feeds[9-11] means that Cd is being mobilized from biological inaccessibility to accessible situations within food chains. Inevitably, normal diets have become a common route of exposure to the metal[12-14]. Airborne particle pollution is an additional Cd exposure route, especially among urban populations, and tobacco smoke is a further source of environmental Cd[15-18].
As a measure against excessive Cd exposures, food safety monitoring programs, known as Total Diet Studies, have been established, and permissible levels of Cd in human foodstuffs, exposure guidelines and thresholds have been determined[19]. By definition, a threshold level for any adverse effect is referred to as an exposure level of any health hazardous substance that may impact 5% of the population[20-23]. However, many Cd-related diseases are found in more than 5% of the environmentally exposed populations, thereby raising concern that the existing Cd exposure guidelines are not protective of population health. Furthermore, consumption of rice containing Cd at 0.27 mg/kg dry grain weight, lower than the Codex standard at 0.4 mg/kg[24], can induce toxic kidney and bone manifestations like those in the itai-itai disease patients[25]. An enhanced risk for death from kidney failure has been linked to a cumulative lifetime exposure to 1 g of Cd in Japanese women[26]. This lifetime Cd exposure is only half of the level that the Joint Food and Agriculture Organization and World Health Organization (FAO/WHO) Expert Committee on Food Additives and Contaminants (JECFA) assumed to carry an unappreciable health risk, where elevated urinary excretion of β2-microglobulin (β2M) was identified as a toxicological endpoint[27].
Chronic kidney disease (CKD) is a progressive ailment, signified by a fall of the estimated glomerular filtration rate (eGFR) to one-third of a normal range (60 mL/min/1.73 m2), and/or the presence of albuminuria for at least 3 months[28-30]. Notably, the global mortality from CKD rose steadily; it was ranked as the 13th, 10th, and 7th leading cause of death in 2000, 2019, and 2024, respectively, and is now projected to be the 5th leading cause of years of life lost by 2040[31,32]. Concerningly, an enhanced risk for CKD has been associated with low Cd exposure levels, evident from urinary Cd excretion rates of 0.27-0.37 µg/g creatinine[33-35]. These Cd excretion levels are attained after 50 years of dietary Cd intake levels between 10 and 15 µg/day, assuming the intestinal absorption rates of 3-7%[36]. A prospective cohort study from Switzerland attributed an increased risk for a rapid drop in eGFR (≥ 3 mL/min/1.73 m2 per year) to Cd exposure[37]. A Chinese population study observed an increased risk for CKD (eGFR criterion) at a Cd exposure higher than 16.7 µg/day[38].
As its first objective, this review highlights the terminology used in toxicological risk assessment and the BMD methodology to define a critical exposure level for any health hazardous substance. The second objective is to provide the Cd exposure limits and thresholds, determined from experimental dosing and human population data. The third objective is to identify the toxicological endpoint most sensitive to Cd through BMD modeling of the indicators of Cd exposure and kidney effects. These included Cd excretion, eGFR, β2M excretion, N-acetyl-β-D-glucosaminidase (NAG) excretion, total protein excretion, and albumin excretion. In theory, a permissible exposure, derived from the most sensitive endpoint, would be protective against all other adverse effects[23].
Permissible exposure levels for environmental cadmium
In this section, Cd exposure limits, determined from human population data and experimental dosing, using kidneys, bones, and lungs as targets, are highlighted. These exposure limits are based on the concept that there is a critical exposure level below which an adverse effect is insignificant[23]. This method is applicable to non-carcinogenic substances only. However, it should be noted that Cd is one of the cancer-causing agents in humans, and a standard two-year rodent/murine bioassay has clearly demonstrated Cd-induced primary tumors in many tissues[39-42]. Epidemiological evidence is sufficient to connect increased risks for tumorigenesis in many organs, notably lungs, kidneys, pancreas, breast, and liver, to environmental Cd exposure[43,44]. With respect to tumorigenic effects, maintaining the lowest achievable exposure level of Cd is an essential preventive measure because a safe exposure level does not exist.
Exposure guidelines based on a point of departure
In toxicological risk assessment, a point of departure (POD) represents the dose at which a specific adverse effect is first observed, or at which a response deviates from a baseline or control. It is a starting point to evaluate the potential health impact of exposure to a health hazardous substance. PODs are used to estimate permissible (safe) exposure levels for chemicals in both environmental and occupational exposure settings[23].
Typically, a POD is determined from a dose-response curve, constructed from experimental dosing, which often involves daily administration of 4-5 different doses for 90 days or longer[19-21]. From a dose-response curve, a POD may be established from the lower bound “no-observed-adverse-effect level” (NOAEL) and the upper bound “lowest-observed-adverse-effect level” (LOAEL)[19-21]. The NOAEL value is referred to as the highest dose tested that produces an insignificant effect, compared to controls. This NOAEL is translated to the BMD lower limit (BMDL) by applying an uncertainty factor, which accounts for species differences and human variability[19-21].
The POD-based exposure limits are reported as minimal risk level (MRL), a toxicological reference value (TRV), tolerable daily intake (TDI), tolerable weekly intake (TWI), tolerable monthly intake (TMI), and a reference dose (RfD)[19-21]. Herein, a permissible exposure level is used to describe the exposure limits that are derived from human exposure-effect datasets [Table 1].
Permissible Cd exposure levels and thresholds
| Target organ/reference | Permissible level | Threshold |
| Kidneys[27] β2M excretion rates ≥ 300 µg/g creatinine | TDI 0.83 μg/kg b.w./day | 5.24 μg/g creatinine |
| Kidneys[45,46] β2M excretion rates ≥ 300 µg/g creatinine | RfD 0.36 μg/kg b.w./day | 1 μg /g creatinine |
| Kidneys[47] β2M and NAG excretion rates | TDI 0.28 μg/kg b.w/day | 2.93 and 3.07 μg/g creatinine for NAG and β2M, respectively |
| Bones[48] Bone mineral density | TDI 0.64 μg/kg b.w./day | 1.71 μg/g creatinine. |
| Bones[49] Bone mineral density | TDI 0.35 μg/kg b.w./day. | N/A |
| Kidneys and bones[50,51] β2M and bone mineral density | TRV 0.21-0.36 μg/kg b.w./day | N/A |
For the β2M endpoint, a Cd dose of 0.83 μg/kg b.w./day was the highest TDI, and 5.24 µg Cd/g creatinine was the highest threshold[27]. The lowest TDI derived for the β2M endpoint was 0.28 μg/kg b.w./ day (16.8 µg/day for a 60 kg person)[47]. This TDI appeared to be close to the TDI figure of 0.2 μg/kg b.w./day, obtained from a dosing study in pigs[52]. The lowest threshold for the β2M endpoint was 1 μg/g creatinine[45,46]. For the bone endpoint, the TDI was 0.64 μg/kg b.w./day, with a threshold of 1.71 μg/g creatinine[48].
Permissible Cadmium Exposure for Workers
The abnormal β2M excretion rate has also been applied in an evaluation of the health risk from inhalational exposure to Cd in workplace settings[53,54]. Like the environmental exposure scenarios, workers’ exposure limits (blood Cd at 5 µg/L, and Cd excretion at a rate of 5 μg/g creatinine) were not sufficiently protective. Using data from 326 male and 114 female Japanese workers, Nogawa et al. estimated the BMDL value for a 40-year cumulative inhalational exposure to Cd to be 17.7 µg/m3 and the BMDL values for blood Cd to be 1.8-2.0 µg/L[55]. Hoshino et al. analyzed data from 238 workers of two nickel-cadmium battery plants in Japan; they observed that the risk for β2M-microglobulinuria increased 17% even though the geometric mean for blood Cd among workers was 1.97 μg/L[56]. The authors suggested that Cd exposure monitoring and exposure management remained necessary. Interestingly, this blood Cd level associated with tubular dysfunction in workers was close to the BMDL values 1.8-2.0 µg/L that Nogawa et al. estimated[55]. In a study from Korea, Choi et al. observed elevated urinary β2M and protein concentrations plus high Cd excretion rates [mean (range) of 22.15 (3.23-62.97) μg/g creatinine] in workers of a small-scale silver soldering company who were exposed to air Cd concentrations of 6-15 µg/m3[57]. Thus, workers’ Cd exposure standard should be lowered.
The limits for Cd exposure via oral and inhalational exposure routes have also been determined from experimental data [Table 2].
Exposure limits based on dosing experiments
| Target organ/reference | Species/dose/duration | Permissible level |
| Kidneys[52] RBP, NAG, CdMT, and β2M | Inbred pigs Dose: 0, 0.5, 2, 8, and 32 mg Cd/kg of feed. Cd in tab water was below 0.001 μg/L Duration: 100 days | TDI: 0.2 μg/kg b.w./day, with inclusion of an uncertainty factor of 100 Effect of Cd on RBP, NAG, CdMT, and β2M occurred at Cd doses of 0.67, 0.88, 1.00, and 3.08 mg/kg feed, respectively |
| Bones[58-61] Bone mineral density | Wistar rats CdCl2 in drinking water at 0, 1, 5, or 50 mg/L Duration: 6, 9, or 12 months. | MRL: 0.5 µg/kg b.w./day for an intermediate exposure duration (15−365 days) |
| Lungs[61,62] Alveolar histiocytic infiltration and focal inflammation in alveolar septa | Fisher F344 rats Dose: CdO at 0, 0.1, 0.3, 1, 3, or 10 mg CdO/m3 Duration: 6.2 hours/day, 5 days/week, for 2 weeks | MRL: 0.03 μg CdO/m3 for an acute exposure duration between 1 and 14 days |
The BMDL values estimated from dosing pigs were 0.67, 0.88, 1.00, and 3.08 mg/kg feed for the RBP, NAG, CdMT, and β2M endpoints, respectively[52]. Abnormal β2M excretion was found at the highest feeding dose of Cd, while abnormal RBP excretion was observed at the lowest Cd dose. A TDI figure for humans was 0.2 μg/kg b.w./day, when an uncertainty factor of 100 was applied. For oral Cd exposure in an intermediate exposure duration (15-365 days), an MRI was 0.5 µg/kg b.w./day[58-61]. An MRL value of Cd, as CdO, was 0.03 μg/m3 for acute inhalational exposure duration between 1 and 14 days[62].
Critical exposure level for the kidney target by the BMD approach
This section highlights critical Cd exposure levels, indicated by Cd excretion rates, that have been linked to adverse effects through BMD modeling of human exposure-effect data. In this way, a compensation for animal-to-human extrapolation is not required. The BMD definition and terminology are summarized as follows. The BMD is an exposure level associated with a specified change in response, termed benchmark response (BMR) at 1%, 5%, or 10%[23,63-65].
The BMD modeling can be applied to both continuous and quantal (prevalence, incidence) data. For continuous data, a lower 95% confidence bound of BMD is referred to as the BMDL value, and the BMDL value derived when BMR is set at 5% can represent the NOAEL equivalent[66-67]. An upper 95% confidence bound of BMD is referred to as BMDU. The BMDU/BMDL ratio informs a degree of uncertainty in BMD estimates[65,66]. For quantal datasets, respective BMDL5 and BMDL10 values are referred to the lower 95% confidence bound of BMD values derived when the prevalence of any outcome is set at 5% and 10%[68-70]. Similarly, respective BMDU5 and BMDU10 are referred to the upper 95% confidence bound of BMD values derived when the prevalence of any outcome is set at 5% and 10%. The BMDL5 could be considered as a population exposure threshold level.
Cd excretion rates that were found to be associated with kidney effect markers varied both among different study populations and within the same population. Such variations were caused by different mathematical dose-response models, endpoints, and cut-off values. For example, Woo et al., analyzing data from 13 publications, reported that the threshold at 5% BMR for the β2M endpoint was 4.88, 3.13, and 1.9 μg/g creatinine[71]. The lowest threshold of 1.9 μg Cd/g creatinine was obtained when β2M excretion rates of 400 µg/g creatinine were used as the cut-off value[71]. The need for cut-off values can be obviated when the BMD software, such as PROAST, is used instead of manual or conventional BMD computations (https://proastweb.rivm.nl). Results obtained using the PROAST software are provided in Table 3, under the topic, Critical Cadmium Exposure Associated with eGFR.
BMDL, NOAEL and threshold values of cadmium excretion rates based on the kidney target
| Study site/reference | Kidney biomarker | BMDL/NOAEL/threshold |
| China[72], Jiangshan City, Zhejiang, 469 men and 465 women, aged 10 to 71 years or older | NAG, β2M, RBP | In men, thresholds at 5% (10%) BMR for NAG, β2M, and RBP were 0.49 (1.04), 0.62 (1.30), and 0.89 (1.59) μg/g creatinine, respectively Corresponding thresholds in women were 0.64 (1.34), 0.65 (1.37), 0.76 (1.53) μg/g creatinine |
| Sweden[73], 790 women, aged 53-64 years | NAG, eGFR | BMDL (BMD) values for Cd excretion were 0.5 (0.6) and 0.7 (1.1) μg/g creatinine for NAG and eGFR endpoints, respectively |
| Japan[74], 74 residents in a Cd-polluted zone, and 38 residents in a non-pollution region | β2M, eGFR, Ccr, TRβ2M, | For men, thresholds were 1.8, 2.9, 1.8, and 3.6 μg/g creatinine for β2M, eGFR, and TRβ2M decrease by 5% and 10%, respectively Corresponding thresholds in women were 2.5, 3.5, 2.6, and 3.9 μg/g creatinine |
| Thailand[75], 200 residents of Bangkok, 534 residents of a Cd-contaminated region in the Mae Sot District, aged 16 to 87 years | eGFR, urine NAG, β2M | For men, NOAEL for NAG, BMDL10 for β2M-nuria and low eGFR prevalences were 0.060, 0.469, and 3.26 µg/g creatinine, respectively Corresponding NOAEL and BLDL10 values in women were 0.069, 0.733, and 4.98 µg/g creatinine |
| Thailand[76], 405 residents of Bangkok, 215 residents of a Cd-contaminated region in the Mae Sot District, aged 19 to 87 years | Total protein, eGFR | For men, NOAEL for total protein and threshold for proteinuria were 0.021 and 2.07 µg/g creatinine, respectively Corresponding NOAEL and threshold in women were 0.023 and 1.80 µg/g creatinine. For a whole group, NOAEL for total protein, and thresholds for low eGFR and proteinuria were 0.054, 1.19, and 1.86 µg/g creatinine, respectively |
Liu et al. applied the BMD modeling to Cd and NAG excretion data recorded in 30 publications, and they identified the 5% BMR threshold to be 1.67 μg/g creatinine, when the cut-off value of abnormal NAG excretion rate was 8 units/g creatinine[77]. However, 2.6-fold and 3.6-fold increases in risk for Cd-induced kidney injury were observed in another study, where NAG excretion rates ≥ 2 units/g creatinine were used as a cut-off value[78]. Using data from the representative of the Jiangshan City residents, the respective threshold for abnormal NAG excretion in men and women was 0.49 and 0.65 µg/g creatinine[72]. These Cd excretion thresholds were lower than the thresholds for abnormal β2M and RBP excretion rates[72].
In a Thai population study[75], respective Cd excretion rates of 0.060 and 0.069 µg/g creatinine in men and women have emerged as the NOAEL equivalents for abnormal NAG excretion[75]. These NOAEL equivalents were obtained by averaging the results from four mathematical dose–response models (inverse exponential, natural logarithmic, exponential, and Hill models), using a 5% elevation in the NAG excretion rate as an endpoint. When total protein excretion was used as an endpoint, the NOAEL equivalent for Cd excretion rate was 0.054 µg/g creatinine[76].
In a Swedish women study, Cd excretion rates linked with the NAG and eGFR endpoints were 0.5 and 0.7
Another notable result of quantal BMD modeling studies is that the prevalence of low eGFR (CKD) could be a more sensitive indicator of kidney effects in the population than proteinuria[76]. In the quantal BMD analysis of Thai population data[76], the prevalence of proteinuria rose from 5% to 10% as Cd excretion rates rose from 1.86 to 4.47 µg/g creatinine. This means that a 2.4-fold increase in population exposure to Cd produced 5% more people with proteinuria. In comparison, the prevalence of low eGFR rose from 5% to 10% as Cd excretion rates increased from 1.19 to 1.35 µg/g creatinine; a 1.13-fold increase in Cd exposure resulted in 5% more people with the low eGFR (CKD). In effect, the prevalence of CKD (low eGFR) was a more sensitive marker for Cd nephrotoxicity than proteinuria.
In theory, Cd excretion rate derived from the most sensitive endpoint or the one with the lowest BMDL value should be protective against all other adverse effects[23]. However, the BMD modeling needs to be standardized before its utility in toxicological risk assessment of Cd can be fully realized. Experimental dose-response data in pigs identified an oral Cd exposure limit at 0.2 µg/ kg body weight per day [Table 2], while the Cd exposure limits, estimated from human data, ranged between 0.21 and 0.83 µg/ kg body weight per day [Table 1]. However, most countries rely on the exposure limit (0.83 µg/ kg body weight per day) and exposure threshold (5.24 µg/g creatinine) derived by JECFA from the β2M endpoint[27].
Cd exposure between 0.21 and 0.64 μg/ kg body weight/day was obtained, when bone mineral density was an endpoint[48-50]. Like the β2M endpoint, the estimated exposure limits for bone effects still carry a significant health risk. This was evident from meta-analysis of data from postmenopausal women, where a nearly two-fold increase in risk of having osteoporosis was found in low- and high-Cd exposure groups[70]. Respective risk of osteoporosis rose 1.95-fold and 1.99-fold when comparing Cd excretion ≥ 0.5 μg/g creatinine versus < 0.5 μg/g, and ≥ 5 μg/g creatinine versus < 5 μg/g, respectively[79].
Is the β2M excretion a sensitive endpoint for the nephrotoxicity of Cd?
The excretion of low-molecular-weight proteins, β2M, α1-microglobulin (α1M), and RBP has long been employed in the assessment of Cd-induced kidney dysfunction[80]. Such utility relies on the premise that they are totally filtered by glomeruli, retrieved, and degraded by kidney tubules. Accordingly, the excretion of these proteins is a function of their production, glomerular filtration, reuptake, and degradation by the kidneys. However, a recent examination of the β2M homeostasis has shown that excretion of the protein could not be a reliable measure of kidney malfunction[81]. Interindividual variation in the flux of β2M from cells into plasma is so pronounced that β2M excretion is minimally related to its reabsorption and degradation by kidney tubules.
As shown in Table 2, an abnormal excretion of β2M occurred in the pigs fed with the highest dose of Cd, while an abnormal RBP excretion was observed in the group fed with the lowest Cd dose level[52]. This means that the β2M excretion was not the most sensitive target of Cd toxicity. In low-dose exposure situations, an elevation of β2M excretion does not reliably reflect kidney tubular dysfunction. There is little basis to use β2M excretion to estimate permissible exposure levels of Cd. Furthermore, in the BMD modeling of data from 799 participants of the Thai cohort of non-diabetics, mean age (range) 49.2 (18-87) years, the BMDL value of Cd excretion rate could not be determined when the β2M was used as an endpoint. In comparison, when a decrease in eGFR was employed as a toxicological endpoint, the BMDL value of Cd excretion was 0.17 µg/g creatinine[82]. Therefore, dietary Cd exposure guidelines that were based on β2M-nuria were unreliable, and new permissible exposure guidelines should be developed.
As shown in Table 3, the excretion of NAG and total proteins appeared to be sensitive to Cd, as abnormal excretion of total protein and NAG occurred at urine Cd-to-creatinine ratios as low as 0.05 and 0.07 µg/g creatinine, respectively[75,76]. Thus, eGFR reductions and the elevation in excretion of total protein and NAG should form the basis for establishing permissible dietary Cd exposure levels. Proteinuria is a hallmark of CKD and predicts continued progressive functional decline of the kidneys[83-85]. Given the fact that CKD has now reached epidemic proportions in many parts of the world, developing strategies to prevent CKD and to reduce its progression to kidney failure is of great public health significance. The evidence that Cd exposure increased risk for CKD and promoted disease progression is discussed below.
Kidney as the principal site of cadmium accumulation and toxicity
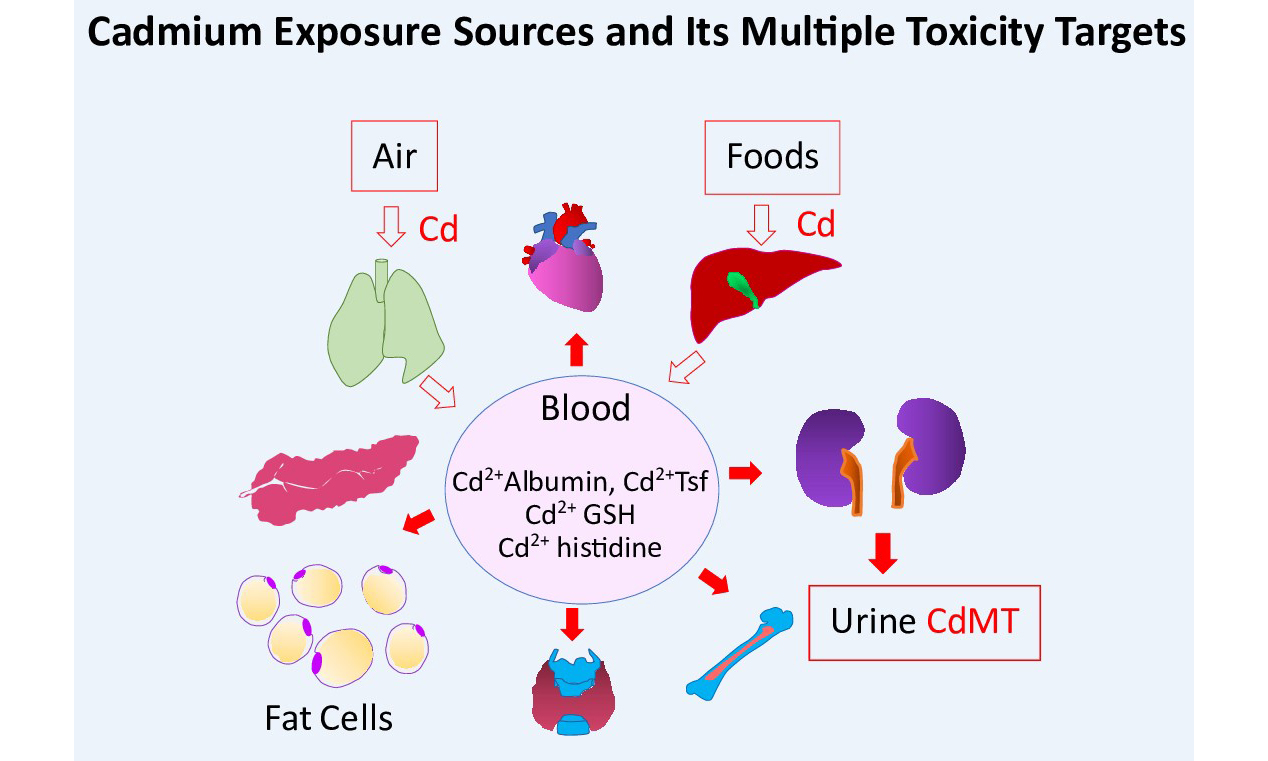
As shown in Figures 1 and 2, Cd reaches the systemic circulation from the gut via enterocytes, portal blood, and the liver. Specialized metal transport proteins for iron (Fe), zinc (Zn), and calcium (Ca) also mediate Cd assimilation[86-89]. Additionally, Cd complexed with metallothionine (MT) and phytochelatin (PC), denoted as CdMT and CdPC, can be absorbed via transcytosis and endocytosis mediated by the neutrophil gelatinase-associated lipocalin (NGAL)/lipocalin 2 receptor[90-92]. Consequently, the rate of Cd absorption is higher than that of Fe, Zn, and Ca. In young Japanese women with low body iron stores, Cd uptake from foods was as high as 24%-45%[93,94]. However, calculation of a “tolerable” Cd intake level typically assumes an absorption rate of only 3-7%, leading to an underestimation of the internal Cd dose and its associated adverse effects[95].
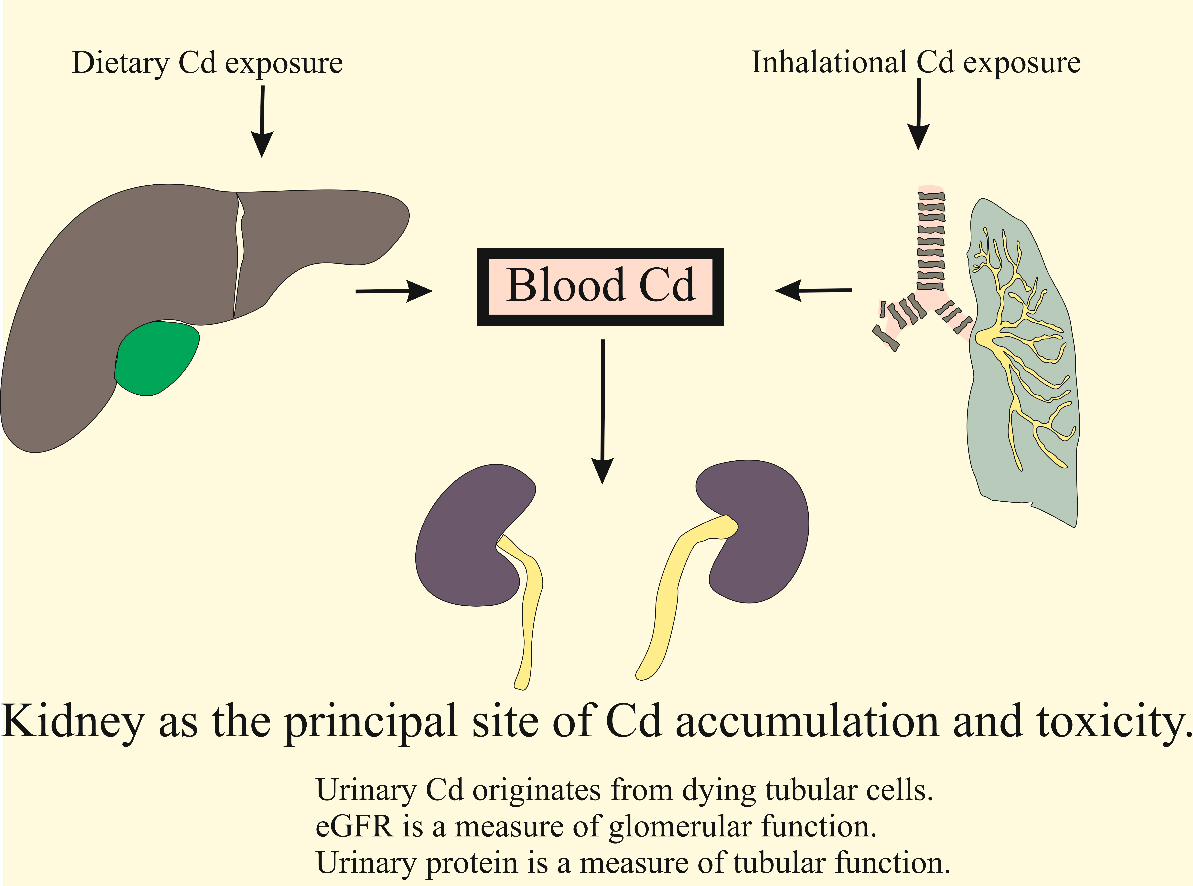
Figure 1. Oral and inhalational routes of exposure to environmental cadmium. Cd from foods enters the portal blood system before reaching the liver, while inhaled metallic and oxide forms of Cd reach the lungs. Eventually, nearly all exogenous Cd accumulates within the proximal tubules. Due to a minuscule excretion rate, the accumulated Cd is released after tubular cells are injured or die. Cd-induced tubulointerstitial inflammation and fibrosis can lead to a decrease in the glomerular filtration rate. Cd: Cadmium.
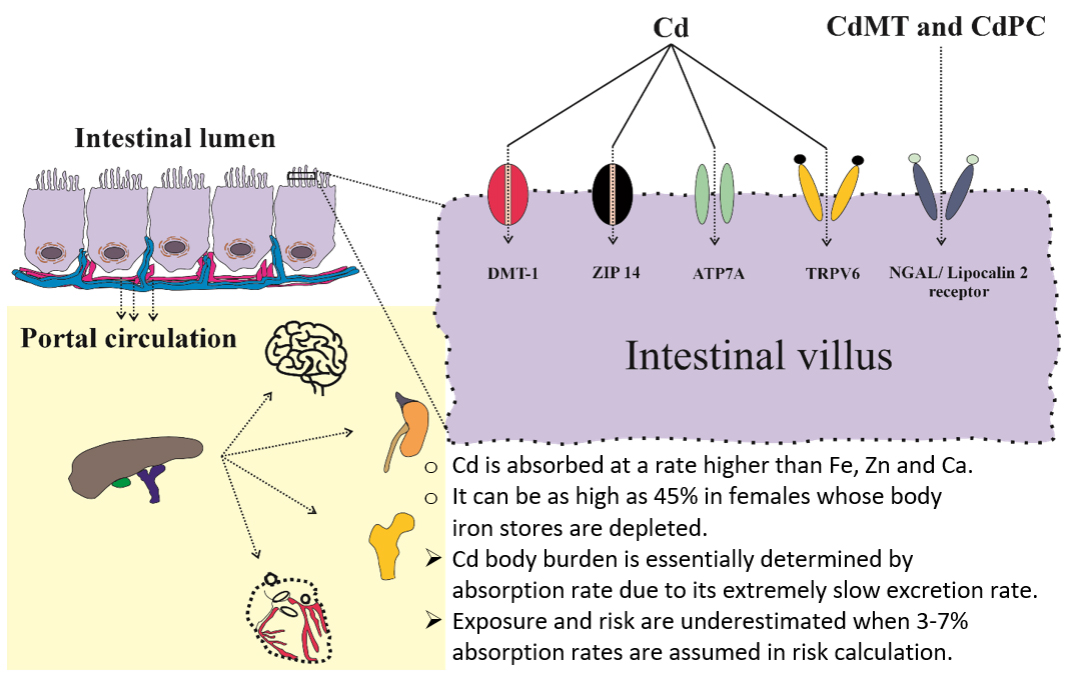
Figure 2. Specialized transport proteins and receptors involved in the absorption of cadmium. Cd from foods is absorbed via transport proteins for iron (DMT1), zinc (ZIP14), copper (ATP7A), and calcium (TRPV6)[43]. In addition, CdMT and Cd/PC can be absorbed through the neutrophil gelatinase-associated lipocalin 2 (NGAL2). Cd: Cadmium.
Generally, a contaminant’s body burden is determined by the rates of absorption and elimination. Given Cd’s extremely slow excretion rate (0.001%-0.005% of body burden)[96,97], intestinal absorption largely dictates Cd accumulation in the body.
Total diet study from Portugal reported a TDI of 0.19 µg/ kg b.w./day, with bread identified as the main source of Cd[11]. Cd exposure levels exceeding the JECFA’s guideline were observed in 5.4% of the Portuguese population aged 18-74 years[11]. In China, 15.4% of the population had Cd exposure above JECFA’s recommended limits, with average dietary Cd intake of 34.3 µg/day (range: 22.6-54 μg/day)[98]. The highest Cd content was found in fungi and algae, followed by aquatic foods, nuts, cereals, beans, vegetables, meats, eggs, milk, and fruits.
In Australia, dietary Cd exposure ranged from 9 to 15 µg/day, with 46%, 16%, 12%, and 7% of total exposure contributed by potatoes, wheat, cocoa, and meat, respectively; an additional 11% was from crustaceans, liver, peanuts, and vegetables[99]. Data on kidney Cd load and urinary Cd concentrations recorded in an Australian autopsy study are provided in Figure 3[100].Kidney weights, kidney Cd and Pb contents [Figure 3A] are provided together with scatterplots showing kidney weight vs. age [Figure 3B], urinary Cd concentration vs. kidney Cd content [Figure 3C] and age [Figure 3D]. Scatterplots relating urinary Cd concentrations to kidney Pb burden and age are provided in Figure 3E and F, respectively.
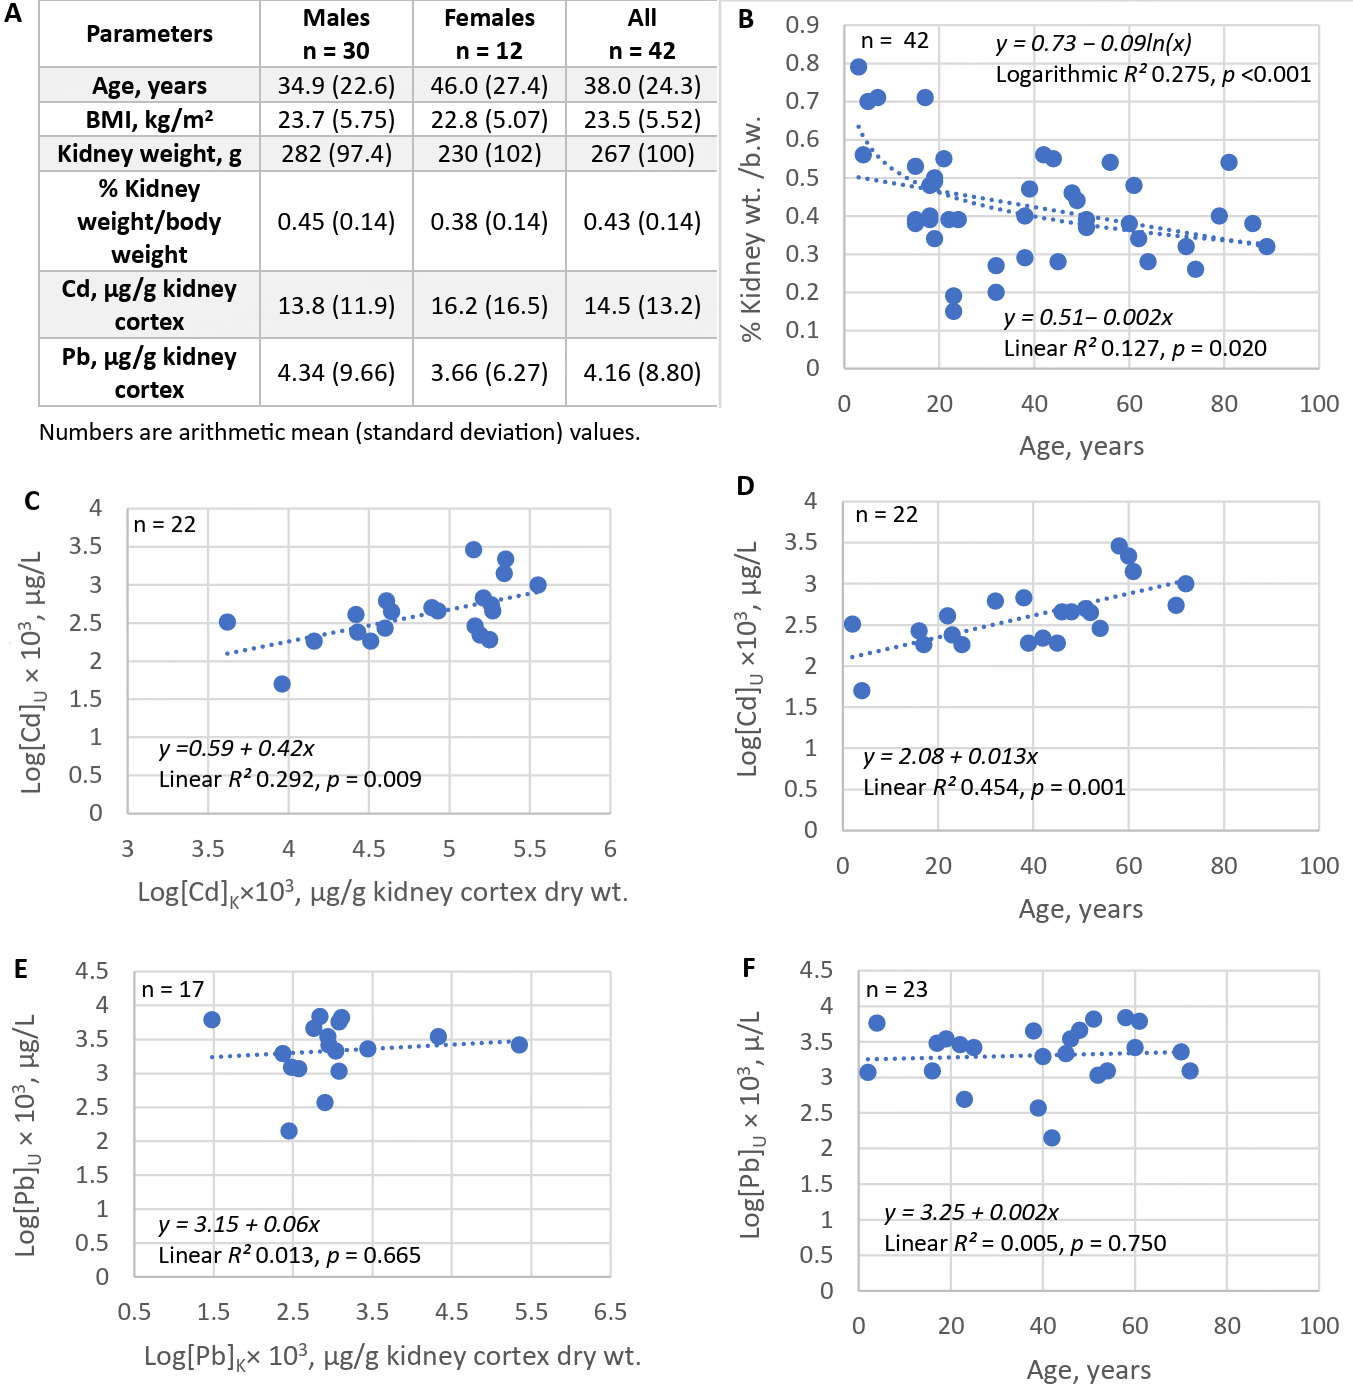
Figure 3. Kidney burden of cadmium as a determinant of urinary cadmium concentration. Kidney weight and Cd and Pb content were measured in 42 Australians (A). A scatterplot shows a decrease in kidney weight with increasing age (B); Urinary Cd concentrations increase with kidney Cd burden (C) and with age (D). Scatterplots indicate only minimal correlations between urinary Cd concentrations and kidney Pb burden (E) or age (F). Data are from Satarug et al.[100]. Cd: Cadmium.
Accumulation of cadmium in kidneys and its excretion in urine
The close correlation between kidney and urinary Cd lays the foundation for the utility of Cd excretion as an indicator of long-term exposure or kidney burden[100-102]. The mean Australian kidney Cd content of 14.5 μg/g wet weight was close to the mean kidney content of 12.9 μg/g wet weight found in kidney biopsied samples from Swedish kidney transplant donors (n = 109, 24-70 years, median age 51)[102]. However, the mean Australian kidney Pb content of 4.16 μg/g wet weight was much higher than the median Swedish kidney Pb content of 0.08 μg/g wet weight.
The rate of Australian kidney Cd accumulation was 3-5 µg/g wet tissue weight for each 10-year increase in age, and kidney cortical Cd content peaked at 25.9 µg/g wet tissue by 50 years of age[100]. In comparison, the rate of kidney Cd accumulation among Swedish kidney transplant donors who did not smoke was 3.9 μg/g kidney wet weight for every 10-year increase in age; this rate of kidney Cd accumulation rose to 4.5 μg/g kidney wet weight per 10 years in non-smoking women with low body iron stores[102]. In line with Cd exposure levels of 9-15 µg/day in Australia, respective Cd exposures among average and high consumers in Sweden were 10.6 and 23 μg/day, with 40%-50% from potatoes and wheat, and seafood and spinach contributing additional amounts among high consumers[103].
Kidney cortical Cd contents in environmentally exposed Australian and Swedish subjects were well below 180-200 μg/g wet kidney weight, presumed to be the critical kidney concentration range in workplace exposure scenarios[64,65]. However, even at these low kidney burdens, histopathological lesions, notably tubular atrophy, interstitial fibrosis, and arteriolohyalinosis, have been observed, and tubular atrophy showed a significant association with kidney Cd content after adjustment for age, gender, and smoking[104]. These findings are as expected because proximal tubular epithelial cells (PTCs) are enriched with mitochondria and depend heavily on autophagy for homeostasis and survival[105]. PTCs are highly susceptible to the apoptosis induced by Cd[106,107]. In rats, Cd-induced acute kidney injury results from Cd-mediated disruption of autophagy and lysosomal function[108]. There are many other mechanisms and aberrant signaling pathways that explain how Cd causes injury to PTCs and cell death[109-112], leading to interstitial inflammation and fibrosis.
Above all, it is important to note that ischemic acute tubular necrosis, acute and chronic tubulointerstitial fibrosis can cause a decrease in GFR because they create impediments to filtration, such as destruction of post-glomerular peritubular capillaries, amputation of glomeruli from tubules, and obstruction of nephrons with cellular debris[113].
Environmental cadmium exposure and chronic kidney disease
CKD afflicts 8%-13% of the world’s population[34-36]. Its diagnosis is based on a fall of the eGFR to below 60 mL/min/1.73 m2 and/or the presence of albuminuria for at least 3 months. Albuminuria is indicated by urinary albumin-to-creatinine ratio (ACR) ≥ 20 and ≥ 30 mg/g creatinine in men and women, respectively. The higher cut-off value for ACR in women is to compensate for lower female creatinine excretion (Ecr), due to universally lower muscle mass in women than similarly aged men.
Cd exposure has been found to be associated with an increased risk for CKD in a Chinese population study[33]. Comparing with Cd exposure level of 16.7 μg/day, CKD risk rose 1.73-fold, 2.93-fold, and 4.05-fold at Cd intake levels of 23.2, 29.6, and 36.9 μg/day, respectively[33]. A dietary Cd exposure level of 23.2 μg/day, which was associated with a 73 % increase in risk for CKD, was only 40% of the JECFA’s exposure guidelines. These Chinese population data are consistent with Ginsberg’s proposal[22] that the kidney effects represent a useful case study of the unified approach to Cd toxicity assessment that can provide additional perspective to the traditional risk/no risk and POD approaches[61]. Ginsberg suggested that the implications of current regulatory limits for Cd exposure can be understood in terms of risk for adverse effects on the kidneys because the adverse effects of Cd and CKD are both defined by the same continuous parameter (GFR loss).
Conventional toxicological risk assessment requires that a significant relationship between exposure and an outcome be established first. However, due to non-differential errors in quantifying either exposure or outcome or both, a dose-response relationship was not demonstrable[114]. These errors are evident from previous meta-analyses of the toxicological risk of Cd exposure[115,116], which led to the conclusion that exposure to Cd did not reduce eGFR nor did it prompt the progressive eGFR loss[115,116]. However, the data from the Swiss cohort study are consistent with the premise that exposure to Cd accelerates the progression of CKD toward kidney failure[41]. In the latest meta-analysis published in 2024, an effect of Cd on the risk of eGFR loss has been noted, but the connection between the risk of albuminuria and Cd exposure remained inconclusive[117,118]. Causes for these erroneous conclusions on the effects of Cd on the prevalence of CKD risk are discussed below.
Failure to demonstrate dose-response relationship
Because urinary Cd correlated closely with kidney Cd [Figure 3], urinary Cd concentration has been used as an indicator of body burden or long-term exposure[100,101]. Most studies employed voided urine samples, requiring adjustment of Cd and all other biomarkers to Ecr. The purpose of this adjustment is to correct for differences in urine volume (dilution) among people. This Ecr-normalization appears to add variance to datasets, leading to an underestimation of the effect size of Cd and even a miss, as shown in Table 4 for the risk of low eGFR.
Cadmium exposure dose levels associated with increased risk of low eGFR
| Independent Variables | eGFR ≤ 60 mL/min/1.73 m2 | ||||
| β Coefficients (SE) | POR | 95% CI | P-value | ||
| Lower | Upper | ||||
| Model A, ECd/Ecr, µg/g creatinine | |||||
| Quartile 1: 0.03-2.41 | Referent | ||||
| Quartile 2: 2.42-4.64 | 0.651 (0.377) | 1.917 | 0.915 | 4.015 | 0.085 |
| Quartile 3: 4.65-8.36 | 1.470 (0.482) | 4.349 | 1.692 | 11.183 | 0.002 |
| Quartile 4: ≥ 8.37 | 1.446 (0.440) | 4.245 | 1.792 | 10.055 | 0.001 |
| Model B, (ECd/Ccr) ×100, µg/L filtrate | β Coefficients (SE) | POR | Lower | Upper | P-value |
| Quartile 1: 0.03-1.95 | Referent | ||||
| Quartile 2: 1.96-3.88 | 1.683 (0.432) | 5.382 | 2.310 | 12.543 | < 0.001 |
| Quartile 3: 3.89-7.68 | 1.573 (0.426) | 4.820 | 2.090 | 11.115 | < 0.001 |
| Quartile 4: ≥ 7.69 | 3.154 (0.603) | 23.429 | 7.179 | 76.464 | < 0.001 |
Normalization of Cd and other substances in urine to creatinine clearance (Ccr) has been applied instead of Ecr adjustment. Ccr-normalization corrects for both interindividual differences in urine dilution and the number of surviving nephrons[119]. This Ccr-normalization does not require timed urine collection, but simultaneous blood and urine sampling is necessary to obtain data on plasma/serum and urinary creatinine concentrations. Excretion of x (Ex) normalized to Ccr is denoted as Ex/Ccr, which can be computed with the equation below.
Ex/Ccr = [Cd]u[cr]p/[cr]u, where x = Cd, albumin, or any excreted biomarker; [x]u = urinary concentration of x (mass/volume); [cr]p = plasma creatinine concentration (mg/dL); and [cr]u = urinary creatinine concentration (mg/dL). Ex/Ccr is expressed as an amount of x excreted per volume of the glomerular filtrate[119].
Effects of cadmium exposure on eGFR and albumin excretion
In toxicological risk assessment, β2M excretion is the most frequently used to reflect the effect of Cd. In comparison, changes in eGFR and albumin excretion have rarely been used for such purposes. As illustrated in Figure 4, the proteins β2M and albumin are both retrieved from the filtrate in the S1 segment of the proximal tubules. Cd disrupts such protein retrieval mechanisms, leading to increases in the excretion of β2M and albumin.
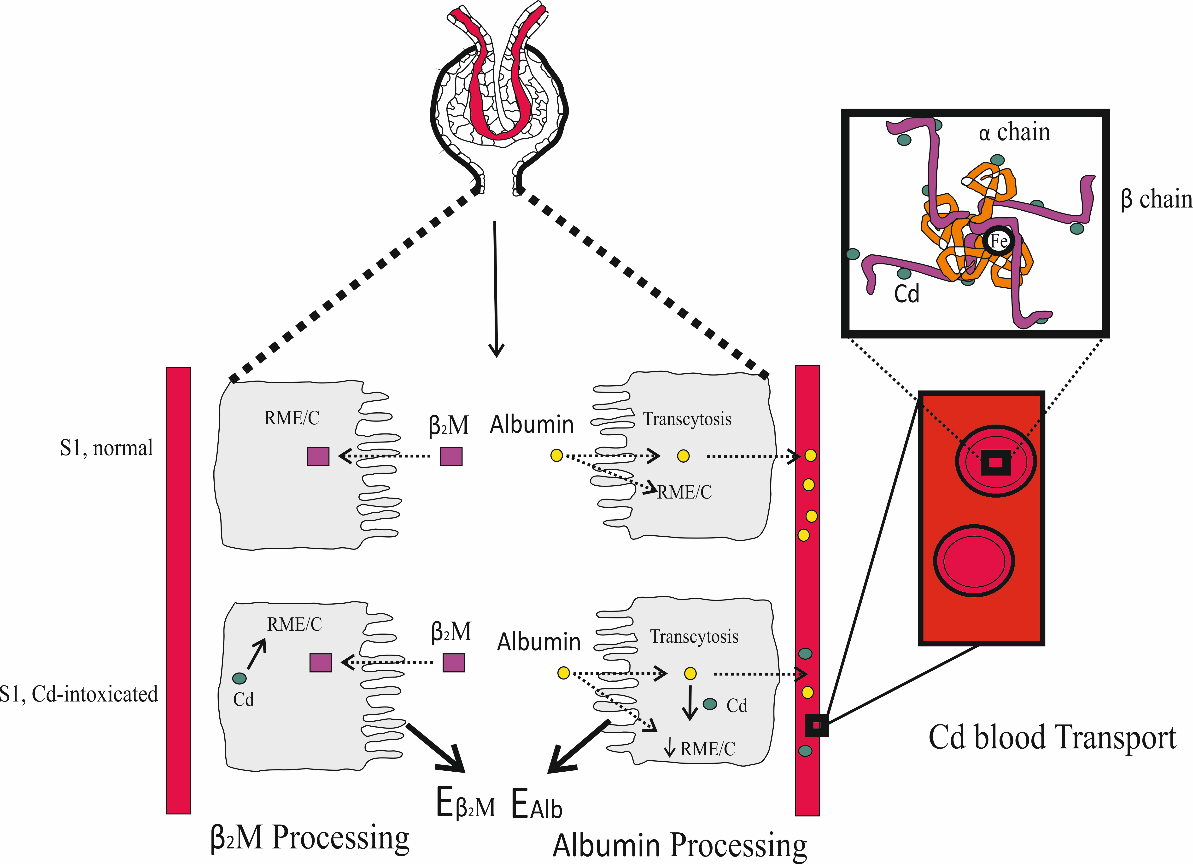
Figure 4. Reabsorption of β2M and albumin by the PTCs. In normal kidney health, nearly all β2M is internalized into PTCs via endocytosis, mediated by the megalin/cubilin receptor system, followed by degradation[120,121]. Albumin is also reabsorbed through the same endocytosis mechanism, fluid-phase endocytosis, and is returned to the bloodstream via transcytosis[122-124]. Cd intoxication disrupted the endocytosis mechanism, thereby increasing the excretion of both β2M and albumin[125]. PTC: Proximal tubular epithelial cell; β2M: β2-microglobulin; Cd: cadmium.
With a molecular weight of 12,000 Daltons, β2M passes through the glomerular membrane to the lumen, where it is internalized and degraded by proximal tubular cells[120,121]. By virtue of its large molecular weight and its negative charge, albumin is not filtered by the glomeruli[122-124]. However, through endothelial cells and podocyte foot processes, albumin can reach the tubular lumen[124], most of which is reabsorbed by fluid-phase endocytosis and RME. Through transcytosis, nearly all albumin is returned to the circulation[122-124].
Applying Ccr-normalization to data from Thai subjects (n = 519) confirmed an effect of Cd on albumin reabsorption; the fractional reabsorption of albumin was reduced 20% by Cd, assuming a glomerular sieving coefficient for albumin (GSCalb) of 10-4[125].
Similarly, a dose-dependent effect of Cd exposure on CKD prevalence, based on the low eGFR criterion, was observed when urinary Cd concentrations were normalized to Ccr as ECd/Ccr [Table 4].
In model A [Table 4], no clear dose-response relationship between Cd exposure and the risk of low eGFR was observed when urinary Cd concentrations were adjusted for Ecr. Compared with the bottom quartile of Cd excretion, the risk of low eGFR increased 4.4-fold in quartile 3 (P = 0.002), while no further increase was observed in quartile 4 (POR 4.2, P = 0.001). The association between Cd excretion in quartile 2 and the risk of low eGFR was not statistically significant (P = 0.085).
In model B [Table 4], a Cd dose-dependent increase in the risk of low eGFR was evident across Cd excretion quartiles. Compared with the bottom quartile, the risk of low eGFR rose 5.4-, 4.8-, and 23.4-fold in quartile 2 (P < 0.002), quartile 3 (P < 0.001), and the top quartile (P < 0.001), respectively.
Cadmium excretion levels associated with eGFR reduction
To better understand the impact of Cd exposure on eGFR and albuminuria, advanced BMD modeling was applied to data from 603 Thai subjects (400 females, 203 males; mean age 52.4 years)[126]. Several dose-response models available in the PROAST software (https://proastweb.rivm.nl) were used to estimate critical Cd excretion rates associated with a 5% reduction in eGFR. The mathematical models included inverse exponential, natural logarithmic, exponential, and Hill dose-response models.
Model performance was evaluated using the Akaike information criterion (AIC), which balances goodness of fit against model complexity to reduce the risk of overfitting and underfitting. Model weights, reflecting the relative information retained by each model, were higher for models with less information loss, indicating better quality.
For the Ecr-normalized dataset [Figure 5A], a 5% eGFR loss in females corresponded to Cd excretion rates 3.3-fold higher than in males [Figure 5B]. The exponential model provided the best fit for the eGFR vs. ECd/Ecr relationship [Figure 5C]. In contrast, for the Ccr-normalized dataset [Figure 5D], a 5% eGFR reduction was associated with similar Cd excretion rates in both women and men [Figure 5E], with the inverse exponential model being the best fit for eGFR vs. ECd/Ccr [Figure 5F].
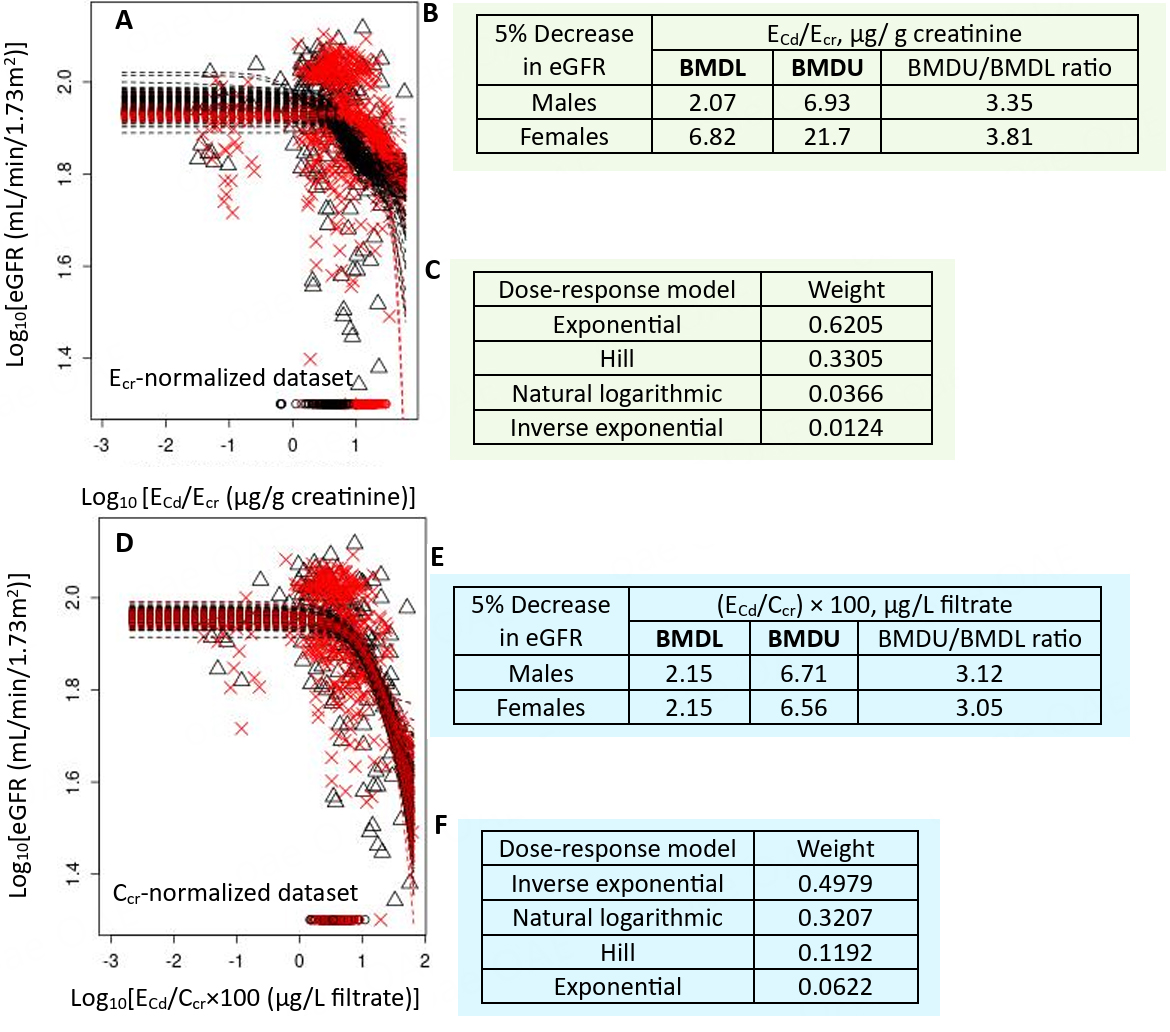
Figure 5. Cadmium excretion rates associated with a 5% eGFR reduction. Bootstrap dose-response model averaging with 200 repeats for eGFR-Cd excretion as ECd/Ecr (A) and ECd/Ccr (C); BMDL/BMDU values for Cd excretion as ECd/Ecr (B) and ECd/Ccr (E). Model weights for Cd excretion as ECd/Ecr (C) and ECd/Ccr (F). × and △ represent male and female participants, respectively[126]. eGFR: Estimated glomerular filtration rate; Cd: cadmium; Ecr: creatinine excretion; BMDL: benchmark dose limit; ECd: urinary Cd; BMDU: upper 95% confidence bound of BMD.
Cadmium excretion levels associated with increased prevalence of CKD
To assess the overall impact of Cd exposure on the population prevalence of CKD, quantal BMD modeling was performed. Cd excretion rates corresponding to5% and 10% prevalence of low eGFR were determined, as well as those corresponding to 5% and 10% prevalence of albuminuria.
Model averaging for % low eGFR vs. ECd/Ecr included data from all subjects [Figure 6A], revealing an association between low eGFR prevalence and ECd/Ecr in both genders [Figure 6B]. Similarly, model averaging for % low eGFR vs. ECd/Ccr used data from all subjects [Figure 6C], showing a consistent association between low eGFR prevalence and ECd/Ccr in both genders [Figure 6D].
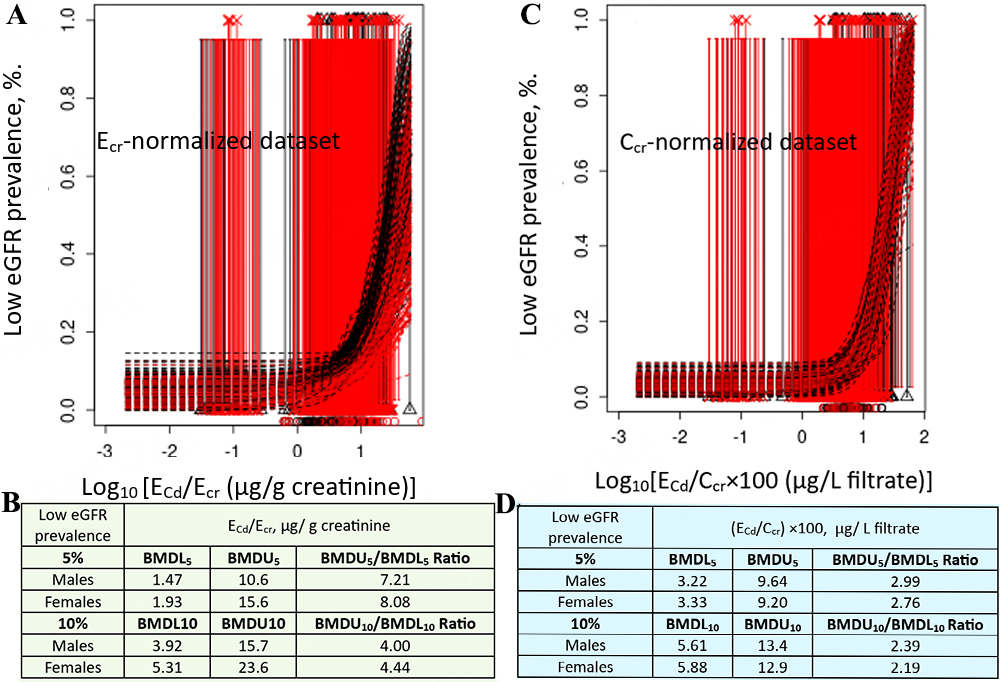
Figure 6. Cadmium excretion rates associated with 5 and 10% prevalences of low eGFR. Bootstrap dose-response model averaging with 200 repeats for %low eGFR-ECd/Ecr (A) and % low eGFR-ECd/Ccr using data from all participants (C). BMDL5/BMDU5 and BMDL10/BMDU10 values of ECd/Ecr and ECd/Ccr (B and D)[126]. eGFR: Estimated glomerular filtration rate; Ecr: creatinine excretion; BMDL: benchmark dose limit; ECd: urinary Cd; BMDU: upper 95% confidence bound of BMD
For the Ecr-normalized dataset [Figure 7A], Cd excretion rates corresponding to 5% and 10% prevalence of albuminuria could not be reliably determined for either gender [Figure 7B]. In contrast, for the Ccr-normalized dataset [Figure 7C], a clear association between albuminuria prevalence and Cd excretion was observed in both genders [Figure 7D].
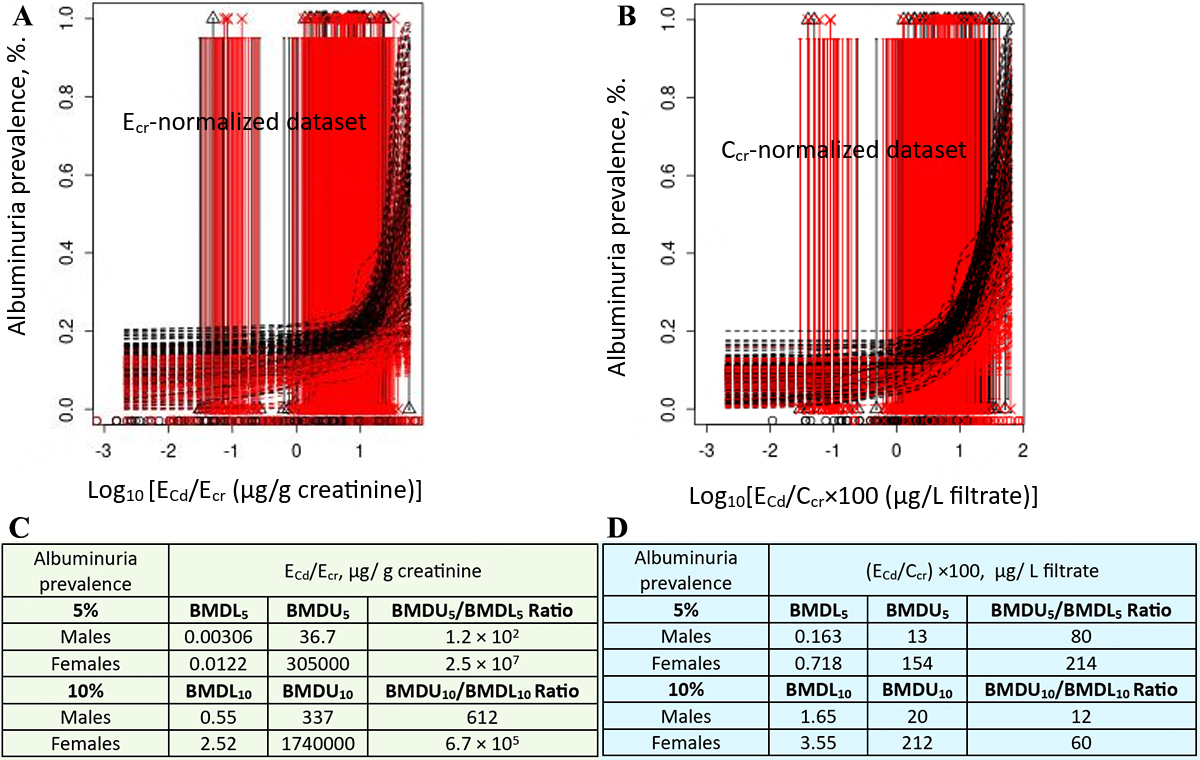
Figure 7. Cadmium excretion rates associated with 5% and 10% prevalences of albuminuria. Bootstrap dose-response model averaging with 200 repeats for % albuminuria vs. ECd/Ecr (A) and ECd/Ccr (C). BMDL5/BMDU5 and BMDL10/BMDU10 values of ECd/Ecr and ECd/Ccr (B and D)[126]. Ecr: Creatinine excretion; BMDL: benchmark dose limit; ECd: urinary Cd; BMDU: upper 95% confidence bound of BMD.
Summary of BMD Modeling of Cd exposure and CKD prevalence
For Ecr-normalized data, a 5%loss of eGFR in females was associated with a Cd excretion 3.3-fold higher than in males [Figure 5B]. This higher Cd excretion in females was a result of their generally small muscle mass and consequently lower creatinine excretion compared with males. In both females and males, the prevalence of low eGFR increased from 5% to 10% as Cd excretion rates rose 2.8-fold, and 2.7-fold, respectively [Figure 6B]. In comparison, Cd excretion rates corresponding to 5% and 10% prevalences of albuminuria could not be reliably determined, as indicated by BMDU5/BMDL5 and BMDU10/BMDL10 ratios exceeding 200 [Figure 7B].
For Ccr-normalized data, a 5% loss of eGFR was associated with a Cd excretion rate of 2.15 µg/L of filtrate in both women and men [Figure 5E]. Because the fundamental cytotoxic mechanisms of Cd are the same, similar toxicity is expected in both sexes at equivalent Cd exposure. The prevalence of low eGFR rose from 5% to 10% as Cd excretion increased 1.7-fold in both men and women [Figure 6D]. In comparison, the prevalence of albuminuria increased from 5% to 10% as Cd excretion rate rose 4.9-fold and 10-fold in women and men, respectively [Figure 7D].
Notably, the Cd excretion rates associated with 5% and 10% increases in albuminuria prevalence were much lower than those associated with similar increases in low eGFR prevalence (Figure 7D vs. 6D), indicating that albuminuria occurs before eGFR declines to 60 mL/min/1.73 m2 or below. Albumin excretion is particularly sensitive to Cd, consistent with a study from Spain showing a 58% increased risk of albuminuria at a Cd excretion rate as low as 0.27 µg/g creatinine[39].
Similar to albuminuria, type 2 diabetes could be another sensitive toxicological endpoint for Cd. Shi et al. applied BMDL modeling to Cd excretion and type 2 diabetes prevalence in a representative U.S. population[127]. They reported a BMD5 (BMDL5) for Cd excretion of 0.190 (0.178) μg/g creatinine at a 5% diabetes prevalence. This BMDL5 corresponds to only 3.4% of the JECFA Cd exposure threshold, which was estimated based on the β2M-nuria endpoint[24].
Low environmental Cd exposure has been implicated in both the onset and progression of diabetic kidney disease, as demonstrated in U.S.[128-130] and Dutch[131,132] population studies after adjusting for covariates, including adiposity and smoking[128,129]. Even a relatively low Cd exposure level (urinary Cd-to-creatinine ratio of 0.7 µg/g) may increase the risk of prediabetes among U.S. adults[130]. Globally, diabetic kidney disease remains the leading cause of kidney failure, a situation likely to worsen with continued dietary Cd exposure.
CONCLUSIONS
This review discusses toxicological risk assessment and the benchmark dose (BMD) methodology for defining a critical exposure level for Cd, a common soil and food contaminant. It addresses dietary and occupational exposure limits that have used elevated β2M excretion as a biomarker of Cd-induced kidney effects. Evidence indicates that these exposure guidelines are insufficiently protective of both the general population and workers.
Permissible Cd exposure levels are based on POD and rely on the assumption of a threshold exposure level below which adverse effects are unlikely to occur. This approach presumes that the exposure limit derived from the most sensitive toxicological endpoint for Cd will also protect against all other adverse effects. To address this, results from advanced BMD modeling using endpoints other than β2M are presented. Urinary Cd excretion rates corresponding to 0.95%, 1.34%, and 3.24% of the current threshold have emerged as early-warning benchmarks for kidney effects, identified through urinary total protein excretion[75], NAG excretion[76], and eGFR reduction[126], respectively.
BMD modeling also suggests that albumin excretion is more sensitive to Cd exposure than β2M excretion. Therefore, albumin excretion, together with urinary total protein, NAG excretion, and eGFR reduction, should be considered when establishing health-protective Cd exposure guidelines. Although proteinuria, albuminuria, and low eGFR are clinically relevant, they have not historically been used in Cd toxicological risk assessments. This omission is partly due to the common practice of normalizing urinary concentrations of Cd and kidney biomarkers to Ecr to account for variations in urine volume. However, creatinine excretion is influenced by muscle mass and is generally higher in men than in women. Adjusting urinary Cd and kidney biomarkers to Ecr introduces non-differential errors that bias dose-response relationships toward the null - a phenomenon also described as reverse causality[114]. Normalization to Ccr rather than Ecr provides a more accurate assessment. Ccr normalization corrects for both urine dilution and nephron mass and is unaffected by muscle mass, without requiring timed urine collection[119]. It is therefore recommended that urinary Cd and kidney biomarkers be normalized to Ccr whenever possible.
Both Cd-induced kidney effects and CKD are defined by the same continuous parameters (eGFR reduction and albumin excretion). Consequently, Cd exposure levels and limits can be interpreted in terms of CKD risk and population prevalence[22]. In quantal BMD modeling using seven mathematical dose-response models, albuminuria was observed to precede eGFR decline into the CKD-defined range. Specifically, BMDL5 and BMD10 values corresponding to 5% and 10% prevalences of albuminuria were substantially lower than those for low eGFR. This indicates that albumin excretion is a valuable early marker for CKD, enabling timely interventions to prevent progressive eGFR loss, as early-stage CKD is often asymptomatic. Supporting evidence includes a Japanese prospective cohort study showing that a 10-year incidence of CKD could be predicted by an albumin excretion rate of 7 mg/g creatinine[133], and a Chinese multicenter retrospective study demonstrating that an albumin excretion rate of 10 mg/g creatinine was independently associated with all-cause death and cardiovascular mortality[134].
DECLARATIONS
Acknowledgments
The author thanks Prof. Aleksandra Buha Đorđević for her professional BMD modeling and interpretations. The author also thanks Prof. Aleksandar Cirovic for his assistance with designing the Graphical Abstract, Figures 1, 2, and 4. This work was supported with resources from Centre for Kidney Disease Research, Translational Research Institute, and Department of Kidney and Transplant Services, Princess Alexandra Hospital, QLD, Australia.
Authors’ contributions
The author contributed solely to the article.
Availability of data and materials
The data that support the findings of this study are available from the corresponding author upon reasonable request.
Financial support and sponsorship
None.
Conflicts of interest
Soisungwan Satarug is the Guest Editor of Journal of Environmental Exposure Assessment. Soisungwan Satarug was not involved in any steps of editorial processing, notably including reviewer selection, manuscript handling, or decision making.
Ethical approval and consent to participate
Not applicable.
Consent for publication
Not applicable.
Copyright
© The Author(s) 2025.
REFERENCES
1. Aoshima, K. Epidemiology of renal tubular dysfunction in the inhabitants of a cadmium-polluted area in the Jinzu River basin in Toyama prefecture. Tohoku. J. Exp. Med. 1987, 152, 151-72.
2. Cai, Y.; Aoshima, K.; Katoh, T.; Teranishi, H.; Kasuya, M. Renal tubular dysfunction in male inhabitants of a cadmium-polluted area in Toyama, Japan - an eleven-year follow-up study. J. Epidemiol. 2001, 11, 180-9.
3. Sasaki, T.; Horiguchi, H.; Matsukawa, T.; et al. A suspected case of “itai-itai disease” in a cadmium-polluted area in Akita prefecture, Japan. Environ. Health. Prev. Med. 2024, 29, 40.
4. Horiguchi, H.; Oguma, E.; Sasaki, S.; et al. Exposure assessment of cadmium in female farmers in cadmium-polluted areas in northern Japan. Toxics 2020, 8, 44.
5. Verbeeck, M.; Salaets, P.; Smolders, E. Trace element concentrations in mineral phosphate fertilizers used in Europe: a balanced survey. Sci. Total. Environ. 2020, 712, 136419.
6. Zou, M.; Zhou, S.; Zhou, Y.; Jia, Z.; Guo, T.; Wang, J. Cadmium pollution of soil-rice ecosystems in rice cultivation dominated regions in China: a review. Environ. Pollut. 2021, 280, 116965.
7. McDowell, R. W.; Gray, C. W. Do soil cadmium concentrations decline after phosphate fertiliser application is stopped: a comparison of long-term pasture trials in New Zealand? Sci. Total. Environ. 2022, 804, 150047.
8. Hou, D.; Jia, X.; Wang, L.; et al. Global soil pollution by toxic metals threatens agriculture and human health. Science 2025, 388, 316-21.
9. Eklund, G.; Tallkvist, J.; Oskarsson, A. A piglet model for studies of gastrointestinal uptake of cadmium in neonates. Toxicol. Lett. 2004, 146, 237-47.
10. Olsson, I. M.; Bensryd, I.; Lundh, T.; Ottosson, H.; Skerfving, S.; Oskarsson, A. Cadmium in blood and urine - impact of sex, age, dietary intake, iron status, and former smoking - association of renal effects. Environ. Health. Perspect. 2002, 110, 1185-90.
11. Vasco, E.; Dias, M. G.; Oliveira, L. The first harmonised total diet study in Portugal: Arsenic, cadmium and lead exposure assessment. Chemosphere 2025, 372, 144003.
12. Cantoral, A.; Collado-López, S.; Betanzos-Robledo, L.; et al. Dietary risk assessment of cadmium exposure through commonly consumed foodstuffs in Mexico. Foods 2024, 13, 3649.
13. Zhu, H.; Tang, X.; Gu, C.; Chen, R.; Liu, Y.; Chu, H.; Zhang, Z. Assessment of human exposure to cadmium and its nephrotoxicity in the Chinese population. Sci. Total. Environ. 2024, 918, 170488.
14. Kolbaum, A. E.; Jung, C.; Jaeger, A.; Libuda, L.; Lindtner, O. Assessment of long-term dietary cadmium exposure in children in Germany: does consideration of data from total diet studies reduce uncertainties from food monitoring programmes? Food. Chem. Toxicol. 2024, 184, 114404.
15. Hill, D. T.; Jandev, V.; Petroni, M.; et al. Airborne levels of cadmium are correlated with urinary cadmium concentrations among young children living in the New York state city of Syracuse, USA. Environ. Res. 2023, 223, 115450.
16. Almerud, P.; Zamaratskaia, G.; Lindroos, A. K.; et al. Cadmium, total mercury, and lead in blood and associations with diet, sociodemographic factors, and smoking in Swedish adolescents. Environ. Res. 2021, 197, 110991.
17. Fagerberg, B.; Barregard, L. Review of cadmium exposure and smoking-independent effects on atherosclerotic cardiovascular disease in the general population. J. Intern. Med. 2021, 290, 1153-79.
18. Kim, J.; Song, H.; Lee, J.; et al. Smoking and passive smoking increases mortality through mediation effect of cadmium exposure in the United States. Sci. Rep. 2023, 13, 3878.
19. Wong, C.; Roberts, S. M.; Saab, I. N. Review of regulatory reference values and background levels for heavy metals in the human diet. Regul. Toxicol. Pharmacol. 2022, 130, 105122.
20. Crump, K. S. A new method for determining allowable daily intakes. Fundam. Appl. Toxicol. 1984, 4, 854-71.
21. Gaylor, D.; Ryan, L.; Krewski, D.; Zhu, Y. Procedures for calculating benchmark doses for health risk assessment. Regul. Toxicol. Pharmacol. 1998, 28, 150-64.
22. Ginsberg, G. L. Cadmium risk assessment in relation to background risk of chronic kidney disease. J. Toxicol. Environ. Health. A. 2012, 75, 374-90.
23. Moffett, D. B., Mumtaz M.M., Sullivan D.W., Jr., Whittaker M.H. Chapter 13, General Considerations of Dose-Effect and Dose-Response Relationships. In: Nordberg G., Costa M., editors. Handbook on the Toxicology of Metals. 5th ed. Cambridge, MA, USA: Academic Press; 2022. pp. 299-317.
24. Codex Alimentarius. Codex general standard for contaminants and toxins in food and feed. 2010. Available from: chrome-extension://efaidnbmnnnibpcajpcglclefindmkaj/https://www.fao.org/fileadmin/user_upload/agns/pdf/CXS_193e.pdf (accessed on 2025-8-15).
25. Nogawa, K.; Sakurai, M.; Ishizaki, M.; Kido, T.; Nakagawa, H.; Suwazono, Y. Threshold limit values of the cadmium concentration in rice in the development of itai-itai disease using benchmark dose analysis. J. Appl. Toxicol. 2017, 37, 962-6.
26. Nishijo, M.; Nogawa, K.; Suwazono, Y.; Kido, T.; Sakurai, M.; Nakagawa, H. Lifetime cadmium exposure and mortality for renal diseases in residents of the cadmium-polluted Kakehashi river basin in Japan. Toxics 2020, 8, 81.
27. Joint FAO/WHO Expert Committee on Food Additives. Safety evaluation of certain food additives and contaminants. In: Joint FAO/WHO Expert Committee on Food Additives and Contaminants, Seventy-Third Meeting: Proceedings of the Joint FAO/WHO Expert Committee on Food Additives and Contaminants, Seventy-Third Meeting; 2010 Jun 8-17; Geneva, Switzerland; Geneva: 2011. Available from: https://apps.who.int/iris/handle/10665/44521 (accessed on 2025-8-15).
28. Murton, M.; Goff-Leggett, D.; Bobrowska, A.; et al. Burden of chronic kidney disease by KDIGO categories of glomerular filtration rate and albuminuria: a systematic review. Adv. Ther. 2021, 38, 180-200.
29. Kalantar-Zadeh, K.; Jafar, T. H.; Nitsch, D.; Neuen, B. L.; Perkovic, V. Chronic kidney disease. Lancet 2021, 398, 786-802.
30. Farrell, D. R.; Vassalotti, J. A. Screening, identifying, and treating chronic kidney disease: why, who, when, how, and what? BMC. Nephrol. 2024, 25, 34.
31. Foreman, K. J.; Marquez, N.; Dolgert, A.; et al. Forecasting life expectancy, years of life lost, and all-cause and cause-specific mortality for 250 causes of death: reference and alternative scenarios for 2016-40 for 195 countries and territories. Lancet 2018, 392, 2052-90.
32. 2021 Forecasting Collaborators. Burden of disease scenarios for 204 countries and territories, 2022-2050: a forecasting analysis for the Global Burden of Disease Study 2021. Lancet 2024, 403, 2204-56.
33. Satarug, S.; Đorđević, A. B.; Yimthiang, S.; Vesey, D. A.; Gobe, G. C. The NOAEL equivalent of environmental cadmium exposure associated with GFR reduction and chronic kidney disease. Toxics 2022, 10, 614.
34. Feng, X.; Zhou, R.; Jiang, Q.; Wang, Y.; Yu, C. Analysis of cadmium accumulation in community adults and its correlation with low-grade albuminuria. Sci. Total. Environ. 2022, 834, 155210.
35. Grau-Perez, M.; Pichler, G.; Galan-Chilet, I.; et al. Urine cadmium levels and albuminuria in a general population from Spain: a gene-environment interaction analysis. Environ. Int. 2017, 106, 27-36.
36. Satarug, S.; Swaddiwudhipong, W.; Ruangyuttikarn, W.; Nishijo, M.; Ruiz, P. Modeling cadmium exposures in low- and high-exposure areas in Thailand. Environ. Health. Perspect. 2013, 121, 531-6.
37. Xie, S.; Perrais, M.; Golshayan, D.; et al. Association between urinary heavy metal/trace element concentrations and kidney function: a prospective study. Clin. Kidney. J. 2025, 18, sfae378.
38. Shi, Z.; Taylor, A. W.; Riley, M.; Byles, J.; Liu, J.; Noakes, M. Association between dietary patterns, cadmium intake and chronic kidney disease among adults. Clin. Nutr. 2018, 37, 276-84.
40. Huff, J.; Lunn, R. M.; Waalkes, M. P.; Tomatis, L.; Infante, P. F. Cadmium-induced cancers in animals and in humans. Int. J. Occup. Environ. Health. 2007, 13, 202-12.
41. Tokar, E. J.; Benbrahim-Tallaa, L.; Waalkes, M. P. Metal ions in human cancer development. Met. Ions. Life. Sci. 2011, 8, 375-401.
42. Waalkes, M. P.; Rehm, S. Chronic toxic and carcinogenic effects of cadmium chloride in male DBA/2NCr and NFS/NCr mice: strain-dependent association with tumors of the hematopoietic system, injection site, liver, and lung. Fundam. Appl. Toxicol. 1994, 23, 21-31.
43. Cirovic, A.; Satarug, S. Toxicity tolerance in the carcinogenesis of environmental cadmium. Int. J. Mol. Sci. 2024, 25, 1851.
44. Kim, Y. J.; Lee, J. Y.; Seomun, G. Whole-blood lead, mercury, and cadmium concentrations and their associations with cancer in Korean elders (2007-2018). Arch. Environ. Occup. Health. 2025, 80, 39-48.
45. Food Safety Authority (EFSA). Cadmium in food - scientific opinion of the panel on contaminants in the food chain. EFSA. J. 2009, 980, 1-139.
46. Food Safety Authority (EFSA). Statement on tolerable weekly intake for cadmium. EFSA. J. 2011, 9, 1975.
47. Qing, Y.; Yang, J.; Zhu, Y.; et al. Dose-response evaluation of urinary cadmium and kidney injury biomarkers in Chinese residents and dietary limit standards. Environ. Health. 2021, 20, 75.
48. Qing, Y.; Yang, J.; Chen, Y.; et al. Urinary cadmium in relation to bone damage: cadmium exposure threshold dose and health-based guidance value estimation. Ecotoxicol. Environ. Saf. 2021, 226, 112824.
49. Leconte, S.; Rousselle, C.; Bodin, L.; Clinard, F.; Carne, G. Refinement of health-based guidance values for cadmium in the French population based on modelling. Toxicol. Lett. 2021, 340, 43-51.
50. Schaefer, H. R.; Flannery, B. M.; Crosby, L. M.; et al. Reassessment of the cadmium toxicological reference value for use in human health assessments of foods. Regul. Toxicol. Pharmacol. 2023, 144, 105487.
51. Pouillot, R.; Farakos, S. S.; Spungen, J.; Schaefer, H. R.; Flannery, B. M.; Van, Doren. J. M. Cadmium physiologically based pharmacokinetic (PBPK) models for forward and reverse dosimetry: Review, evaluation, and adaptation to the U.S. population. Toxicol. Lett. 2022, 367, 67-75.
52. Wu, X.; Wei, S.; Wei, Y.; et al. The reference dose for subchronic exposure of pigs to cadmium leading to early renal damage by benchmark dose method. Toxicol. Sci. 2012, 128, 524-31.
53. Chaumont, A.; De, Winter. F.; Dumont, X.; Haufroid, V.; Bernard, A. The threshold level of urinary cadmium associated with increased urinary excretion of retinol-binding protein and beta 2-microglobulin: a re-assessment in a large cohort of nickel-cadmium battery workers. Occup. Environ. Med. 2011, 68, 257-64.
54. ; Committee for Recommendation of Occupational Exposure Limits, Japan Society for Occupational Health. Occupational exposure limits for acetaldehyde, 2-bromopropane, glyphosate, manganese and inorganic manganese compounds, and zinc oxide nanoparticle, and the biological exposure indices for cadmium and cadmium compounds and ethylbenzene, and carcinogenicity, occupational sensitizer, and reproductive toxicant classifications. J. Occup. Health. 2021, 63, e12294.
55. Nogawa, K.; Suwazono, Y.; Watanabe, Y.; Elinder, C. G. Estimation of benchmark dose of cumulative cadmium exposure for renal tubular effect. Int. J. Environ. Res. Public. Health. 2021, 18, 5177.
56. Hoshino, K.; Iwasawa, S.; Yoshioka, N.; et al. Increased risk of proximal tubular dysfunction due to occupational cadmium exposure: a survival analysis study. J. Occup. Health. 2025, 67.
57. Choi, W. J.; Kang, S. K.; Ham, S.; Chung, W.; Kim, A. J.; Kang, M. Chronic cadmium intoxication and renal injury among workers of a small-scale silver soldering company. Saf. Health. Work. 2020, 11, 235-40.
58. Brzóska, M. M.; Moniuszko-Jakoniuk, J. Disorders in bone metabolism of female rats chronically exposed to cadmium. Toxicol. Appl. Pharmacol. 2005, 202, 68-83.
59. Brzóska, M. M.; Moniuszko-Jakoniuk, J. Bone metabolism of male rats chronically exposed to cadmium. Toxicol. Appl. Pharmacol. 2005, 207, 195-211.
60. Brzóska, M. M.; Moniuszko-Jakoniuk, J. Effect of low-level lifetime exposure to cadmium on calciotropic hormones in aged female rats. Arch. Toxicol. 2005, 79, 636-46.
61. Faroon, O.; Keith, S.; Mumtaz, M.; Ruiz, P. Minimal risk level derivation for cadmium: acute and intermediate duration exposures. J. Exp. Clin. Toxicol. 2017, 1, 1-12.
62. National Toxicology Program. NTP technical report on toxicity studies of cadmium oxide (CAS No. 1306–19-0) Administered by Inhalation to F344/N Rats and B6C3F1 Mice. 1995 Feb. Report No. NIH/PUB--95-3388. U.S. Department of Health and Human Services. National Institutes of Health. National Toxicology Program, Research Triangle Park, NC, USA. Available from: https://www.osti.gov/biblio/121897#:~:text=This%20report%20describes%20toxicity%20studies%20of%20cadmium%20oxide,aerosol%20in%20Sprague-Dawley%20rats%20and%20Swiss%20%28CD-1%29%20mice. (accessed on 2025-8-15).
63. Hardy, A.; Benford, D.; Halldorsson, T.; et al.; EFSA Scientific Committee. Update: use of the benchmark dose approach in risk assessment. EFSA. J. 2017, 15, e04658.
64. Filipsson, A. F.; Sand, S.; Nilsson, J.; Victorin, K. The benchmark dose method - review of available models, and recommendations for application in health risk assessment. Crit. Rev. Toxicol. 2003, 33, 505-42.
65. Slob, W. A general theory of effect size, and its consequences for defining the benchmark response (BMR) for continuous endpoints. Crit. Rev. Toxicol. 2017, 47, 342-51.
66. Sand, S. J.; von, Rosen. D.; Filipsson, A. F. Benchmark calculations in risk assessment using continuous dose-response information: the influence of variance and the determination of a cut-off value. Risk. Anal. 2003, 23, 1059-68.
67. Slob, W.; Moerbeek, M.; Rauniomaa, E.; Piersma, A. H. A statistical evaluation of toxicity study designs for the estimation of the benchmark dose in continuous endpoints. Toxicol. Sci. 2005, 84, 167-85.
68. Sand, S.; Filipsson, A. F.; Victorin, K. Evaluation of the benchmark dose method for dichotomous data: model dependence and model selection. Regul. Toxicol. Pharmacol. 2002, 36, 184-97.
69. Slob, W.; Setzer, R. W. Shape and steepness of toxicological dose-response relationships of continuous endpoints. Crit. Rev. Toxicol. 2014, 44, 270-97.
70. Zhu, Y.; Wang, T.; Jelsovsky, J. Z. Bootstrap estimation of benchmark doses and confidence limits with clustered quantal data. Risk. Anal. 2007, 27, 447-65.
71. Woo, H. D.; Chiu, W. A.; Jo, S.; Kim, J. Benchmark dose for urinary cadmium based on a marker of renal dysfunction: a meta-analysis. PLoS. One. 2015, 10, e0126680.
72. Wang, X.; Wang, Y.; Feng, L.; et al. Application of the benchmark dose (BMD) method to identify thresholds of cadmium-induced renal effects in non-polluted areas in China. PLoS. One. 2016, 11, e0161240.
73. Suwazono, Y.; Sand, S.; Vahter, M.; et al. Benchmark dose for cadmium-induced renal effects in humans. Environ. Health. Perspect. 2006, 114, 1072-6.
74. Hayashi, T.; Nogawa, K.; Watanabe, Y.; et al. Benchmark dose of urinary cadmium for assessing renal tubular and glomerular function in a cadmium-polluted area of Japan. Toxics 2024, 12, 836.
75. Satarug, S.; Vesey, D. A.; Gobe, G. C.; Đorđević, A. B. The Validity of Benchmark dose limit analysis for estimating permissible accumulation of cadmium. Int. J. Environ. Res. Public. Health. 2022, 19, 15697.
76. Satarug, S.; Vesey, D. A.; Đorđević, A. B. The NOAEL equivalent for the cumulative body burden of cadmium: focus on proteinuria as an endpoint. J. Environ. Expo. Assess. 2024, 3, 26.
77. Liu, C.; Li, Y.; Zhu, C.; et al. Benchmark dose for cadmium exposure and elevated N-acetyl-β-D-glucosaminidase: a meta-analysis. Environ. Sci. Pollut. Res. Int. 2016, 23, 20528-38.
78. Thomas, L. D.; Hodgson, S.; Nieuwenhuijsen, M.; Jarup, L. Early kidney damage in a population exposed to cadmium and other heavy metals. Environ. Health. Perspect. 2009, 117, 181-4.
79. Kunioka, C. T.; Manso, M. C.; Carvalho, M. Association between environmental cadmium exposure and osteoporosis risk in postmenopausal women: a systematic review and meta-analysis. Int. J. Environ. Res. Public. Health. 2022, 20, 485.
80. Wallin, M.; Sallsten, G.; Lundh, T.; Barregard, L. Low-level cadmium exposure and effects on kidney function. Occup. Environ. Med. 2014, 71, 848-54.
81. Phelps, K. R.; Yimthiang, S.; Pouyfung, P.; Khamphaya, T.; Vesey, D. A.; Satarug, S. Homeostasis of β2-Microglobulin in diabetics and non-diabetics with modest cadmium intoxication. Version: 1 ScieRxiv [Preprints] 2025 [Received: 20 Feb 2025; Approved: 20 Feb 2025; Cited 15 Aug 2025] [35 p.].
82. Đorđević, A. B.; Vesey, D. A.; Satarug, S. Cadmium-induced nephrotoxicity assessed by benchmark dose calculations in two exposure-effect datasets. 10.21203/rs.3.rs-6799604/v1.
83. Makhammajanov, Z.; Gaipov, A.; Myngbay, A.; Bukasov, R.; Aljofan, M.; Kanbay, M. Tubular toxicity of proteinuria and the progression of chronic kidney disease. Nephrol. Dial. Transplant. 2024, 39, 589-99.
84. Faivre, A.; Verissimo, T.; de, Seigneux. S. Proteinuria and tubular cells: plasticity and toxicity. Acta. Physiol. (Oxf). 2025, 241, e14263.
85. Liu, D.; Lv, L. New Understanding on the role of proteinuria in progression of chronic kidney disease. In: Liu B, Lan H, Lv L, editors. Renal Fibrosis: Mechanisms and Therapies. Singapore: Springer; 2019. pp. 487-500.
86. Schneider, S. N.; Liu, Z.; Wang, B.; et al. Oral cadmium in mice carrying 5 versus 2 copies of the Slc39a8 gene: comparison of uptake, distribution, metal content, and toxicity. Int. J. Toxicol. 2014, 33, 14-20.
87. Fujishiro, H.; Himeno, S. New insights into the roles of ZIP8, a cadmium and manganese transporter, and its relation to human diseases. Biol. Pharm. Bull. 2019, 42, 1076-82.
88. Thévenod, F.; Fels, J.; Lee, W. K.; Zarbock, R. Channels, transporters and receptors for cadmium and cadmium complexes in eukaryotic cells: myths and facts. Biometals 2019, 32, 469-89.
89. Ohta, H.; Ohba, K. Involvement of metal transporters in the intestinal uptake of cadmium. J. Toxicol. Sci. 2020, 45, 539-48.
90. Fujita, Y.; el, Belbasi. H. I.; Min, K. S.; Onosaka, S.; Okada, Y.; Matsumoto, Y.; Mutoh, N.; Tanaka, K. Fate of cadmium bound to phytochelatin in rats. Res. Commun. Chem. Pathol. Pharmacol. 1993, 82, 357-65.
91. Langelueddecke, C.; Roussa, E.; Fenton, R. A.; Thévenod, F. Expression and function of the lipocalin-2 (24p3/NGAL) receptor in rodent and human intestinal epithelia. PLoS. One. 2013, 8, e71586.
92. Langelueddecke, C.; Lee, W. K.; Thévenod, F. Differential transcytosis and toxicity of the hNGAL receptor ligands cadmium-metallothionein and cadmium-phytochelatin in colon-like Caco-2 cells: implications for in vivo cadmium toxicity. Toxicol. Lett. 2014, 226, 228-35.
93. Kikuchi, Y.; Nomiyama, T.; Kumagai, N.; et al. Uptake of cadmium in meals from the digestive tract of young non-smoking Japanese female volunteers. J. Occup. Health. 2003, 45, 43-52.
94. Horiguchi, H.; Oguma, E.; Sasaki, S.; et al. Comprehensive study of the effects of age, iron deficiency, diabetes mellitus, and cadmium burden on dietary cadmium absorption in cadmium-exposed female Japanese farmers. Toxicol. Appl. Pharmacol. 2004, 196, 114-23.
95. Julin, B.; Vahter, M.; Amzal, B.; Wolk, A.; Berglund, M.; Åkesson, A. Relation between dietary cadmium intake and biomarkers of cadmium exposure in premenopausal women accounting for body iron stores. Environ. Health. 2011, 10, 105.
96. Elinder, C. G.; Lind, B.; Kjellström, T.; Linnman, L.; Friberg, L. Cadmium in kidney cortex, liver, and pancreas from Swedish autopsies. Estimation of biological half time in kidney cortex, considering calorie intake and smoking habits. Arch. Environ. Health. 1976, 31, 292-302.
97. Elinder, C. G.; Kjellstöm, T.; Lind, B.; Molander, M. L.; Silander, T. Cadmium concentrations in human liver, blood, and bile: comparison with a metabolic model. Environ. Res. 1978, 17, 236-41.
98. Qing, Y.; Li, Y.; Cai, X.; He, W.; Liu, S.; Ji, Y.; Jiang, M.; Yang, L.; Wang, J.; Ping, S.; Chen, Y.; Luo, Y.; Li, Y. Assessment of cadmium concentrations in foodstuffs and dietary exposure risk across China: a metadata analysis. Expo. Health. 2023, 15, 951-61.
99. Callan, A.; Hinwood, A.; Devine, A. Metals in commonly eaten groceries in Western Australia: a market basket survey and dietary assessment. Food. Addit. Contam. Part. A. Chem. Anal. Control. Expo. Risk. Assess. 2014, 31, 1968-81.
100. Satarug, S.; Baker, J. R.; Reilly, P. E.; Moore, M. R.; Williams, D. J. Cadmium levels in the lung, liver, kidney cortex, and urine samples from Australians without occupational exposure to metals. Arch. Environ. Health. 2002, 57, 69-77.
101. Akerstrom, M.; Barregard, L.; Lundh, T.; Sallsten, G. The relationship between cadmium in kidney and cadmium in urine and blood in an environmentally exposed population. Toxicol. Appl. Pharmacol. 2013, 268, 286-93.
102. Barregard, L.; Fabricius-Lagging, E.; Lundh, T.; et al. Cadmium, mercury, and lead in kidney cortex of living kidney donors: Impact of different exposure sources. Environ. Res. 2010, 110, 47-54.
103. Sand, S.; Becker, W. Assessment of dietary cadmium exposure in Sweden and population health concern including scenario analysis. Food. Chem. Toxicol. 2012, 50, 536-44.
104. Barregard, L.; Sallsten, G.; Lundh, T.; Mölne, J. Low-level exposure to lead, cadmium and mercury, and histopathological findings in kidney biopsies. Environ. Res. 2022, 211, 113119.
105. Lenoir, O.; Tharaux, P. L.; Huber, T. B. Autophagy in kidney disease and aging: lessons from rodent models. Kidney. Int. 2016, 90, 950-64.
106. Fujiwara, Y.; Lee, J. Y.; Tokumoto, M.; Satoh, M. Cadmium renal toxicity via apoptotic pathways. Biol. Pharm. Bull. 2012, 35, 1892-7.
107. Thévenod, F.; Lee, W. K.; Garrick, M. D. Iron and cadmium entry into renal mitochondria: physiological and toxicological implications. Front. Cell. Dev. Biol. 2020, 8, 848.
108. Dong, P. F.; Liu, T. B.; Chen, K.; et al. Cadmium targeting transcription factor EB to inhibit autophagy-lysosome function contributes to acute kidney injury. J. Adv. Res. 2025, 72, 653-69.
109. Lv, Y. T.; Liu, T. B.; Li, Y.; Wang, Z. Y.; Lian, C. Y.; Wang, L. HO-1 activation contributes to cadmium-induced ferroptosis in renal tubular epithelial cells via increasing the labile iron pool and promoting mitochondrial ROS generation. Chem. Biol. Interact. 2024, 399, 111152.
110. Ning, B.; Guo, C.; Kong, A.; et al. Calcium signaling mediates cell death and crosstalk with autophagy in kidney disease. Cells 2021, 10, 3204.
111. Li, K.; Guo, C.; Ruan, J.; et al. Cadmium disrupted ER Ca2+ homeostasis by inhibiting SERCA2 expression and activity to induce apoptosis in renal proximal tubular cells. Int. J. Mol. Sci. 2023, 24, 5979.
112. Liu, F.; Li, Z. F.; Wang, Z. Y.; Wang, L. Role of subcellular calcium redistribution in regulating apoptosis and autophagy in cadmium-exposed primary rat proximal tubular cells. J. Inorg. Biochem. 2016, 164, 99-109.
113. Lang, S. M.; Schiffl, H. Smoking status, cadmium, and chronic kidney disease. Ren. Replace. Ther. 2024, 10, 17.
114. Grandjean, P.; Budtz-Jørgensen, E. Total imprecision of exposure biomarkers: implications for calculating exposure limits. Am. J. Ind. Med. 2007, 50, 712-9.
115. Byber, K.; Lison, D.; Verougstraete, V.; Dressel, H.; Hotz, P. Cadmium or cadmium compounds and chronic kidney disease in workers and the general population: a systematic review. Crit. Rev. Toxicol. 2016, 46, 191-240.
116. Jalili, C.; Kazemi, M.; Cheng, H.; et al. Associations between exposure to heavy metals and the risk of chronic kidney disease: a systematic review and meta-analysis. Crit. Rev. Toxicol. 2021, 51, 165-82.
117. Doccioli, C.; Sera, F.; Francavilla, A.; Cupisti, A.; Biggeri, A. Association of cadmium environmental exposure with chronic kidney disease: a systematic review and meta-analysis. Sci. Total. Environ. 2024, 906, 167165.
118. Johri, N.; Jacquillet, G.; Unwin, R. Heavy metal poisoning: the effects of cadmium on the kidney. Biometals 2010, 23, 783-92.
119. Phelps, K. R.; Gosmanova, E. O. A generic method for analysis of plasma concentrations . Clin. Nephrol. 2020, 94, 43-49.
120. Argyropoulos, C. P.; Chen, S. S.; Ng, Y. H.; et al. Rediscovering beta-2 microglobulin as a biomarker across the spectrum of kidney diseases. Front. Med. (Lausanne). 2017, 4, 73.
121. Sivanathan, P. C.; Ooi, K. S.; Mohammad, Haniff. M. A. S.; et al. Lifting the veil: characteristics, clinical significance, and application of β-2-microglobulin as biomarkers and its detection with biosensors. ACS. Biomater. Sci. Eng. 2022, 8, 3142-61.
122. Molitoris, B. A.; Sandoval, R. M.; Yadav, S. P. S.; Wagner, M. C. Albumin uptake and processing by the proximal tubule: physiological, pathological, and therapeutic implications. Physiol. Rev. 2022, 102, 1625-67.
123. Comper, W. D.; Vuchkova, J.; McCarthy, K. J. New insights into proteinuria/albuminuria. Front. Physiol. 2022, 13, 991756.
124. Benzing, T.; Salant, D. Insights into glomerular filtration and albuminuria. N. Engl. J. Med. 2021, 384, 1437-46.
125. Satarug, S.; Vesey, D. A.; Gobe, G. C.; Phelps, K. R. The pathogenesis of albuminuria in cadmium nephropathy. Curr. Res. Toxicol. 2024, 6, 100140.
126. Satarug, S.; Vesey, D. A.; Gobe, G. C.; Yimthiang, S.; Buha, Đorđević. A. Health risk in a geographic area of Thailand with endemic cadmium contamination: focus on albuminuria. Toxics 2023, 11, 68.
127. Shi, P.; Yan, H.; Fan, X.; Xi, S. A benchmark dose analysis for urinary cadmium and type 2 diabetes mellitus. Environ. Pollut. 2021, 273, 116519.
128. Schwartz, G. G.; Il'yasova, D.; Ivanova, A. Urinary cadmium, impaired fasting glucose, and diabetes in the NHANES III. Diabetes. Care. 2003, 26, 468-70.
129. Jiang, F.; Zhi, X.; Xu, M.; Li, B.; Zhang, Z. Gender-specific differences of interaction between cadmium exposure and obesity on prediabetes in the NHANES 2007-2012 population. Endocrine 2018, 61, 258-66.
130. Wallia, A.; Allen, N. B.; Badon, S.; El, Muayed. M. Association between urinary cadmium levels and prediabetes in the NHANES 2005-2010 population. Int. J. Hyg. Environ. Health. 2014, 217, 854-60.
131. Hagedoorn, I. J. M.; Gant, C. M.; Huizen, S. V.; et al. Lifestyle-related exposure to cadmium and lead is associated with diabetic kidney disease. J. Clin. Med. 2020, 9, 2432.
132. Oosterwijk, M. M.; Hagedoorn, I. J. M.; Maatman, R. G. H. J.; Bakker, S. J. L.; Navis, G.; Laverman, G. D. Cadmium, active smoking and renal function deterioration in patients with type 2 diabetes. Nephrol. Dial. Transplant. 2023, 38, 876-83.
133. Okubo, A.; Nakashima, A.; Doi, S.; et al. High-normal albuminuria is strongly associated with incident chronic kidney disease in a nondiabetic population with normal range of albuminuria and normal kidney function. Clin. Exp. Nephrol. 2020, 24, 435-43.
Cite This Article
How to Cite
Download Citation
Export Citation File:
Type of Import
Tips on Downloading Citation
Citation Manager File Format
Type of Import
Direct Import: When the Direct Import option is selected (the default state), a dialogue box will give you the option to Save or Open the downloaded citation data. Choosing Open will either launch your citation manager or give you a choice of applications with which to use the metadata. The Save option saves the file locally for later use.
Indirect Import: When the Indirect Import option is selected, the metadata is displayed and may be copied and pasted as needed.
About This Article
Special Issue
Copyright

Data & Comments
Data
0


Comments
Comments must be written in English. Spam, offensive content, impersonation, and private information will not be permitted. If any comment is reported and identified as inappropriate content by OAE staff, the comment will be removed without notice. If you have any queries or need any help, please contact us at [email protected].