fig3
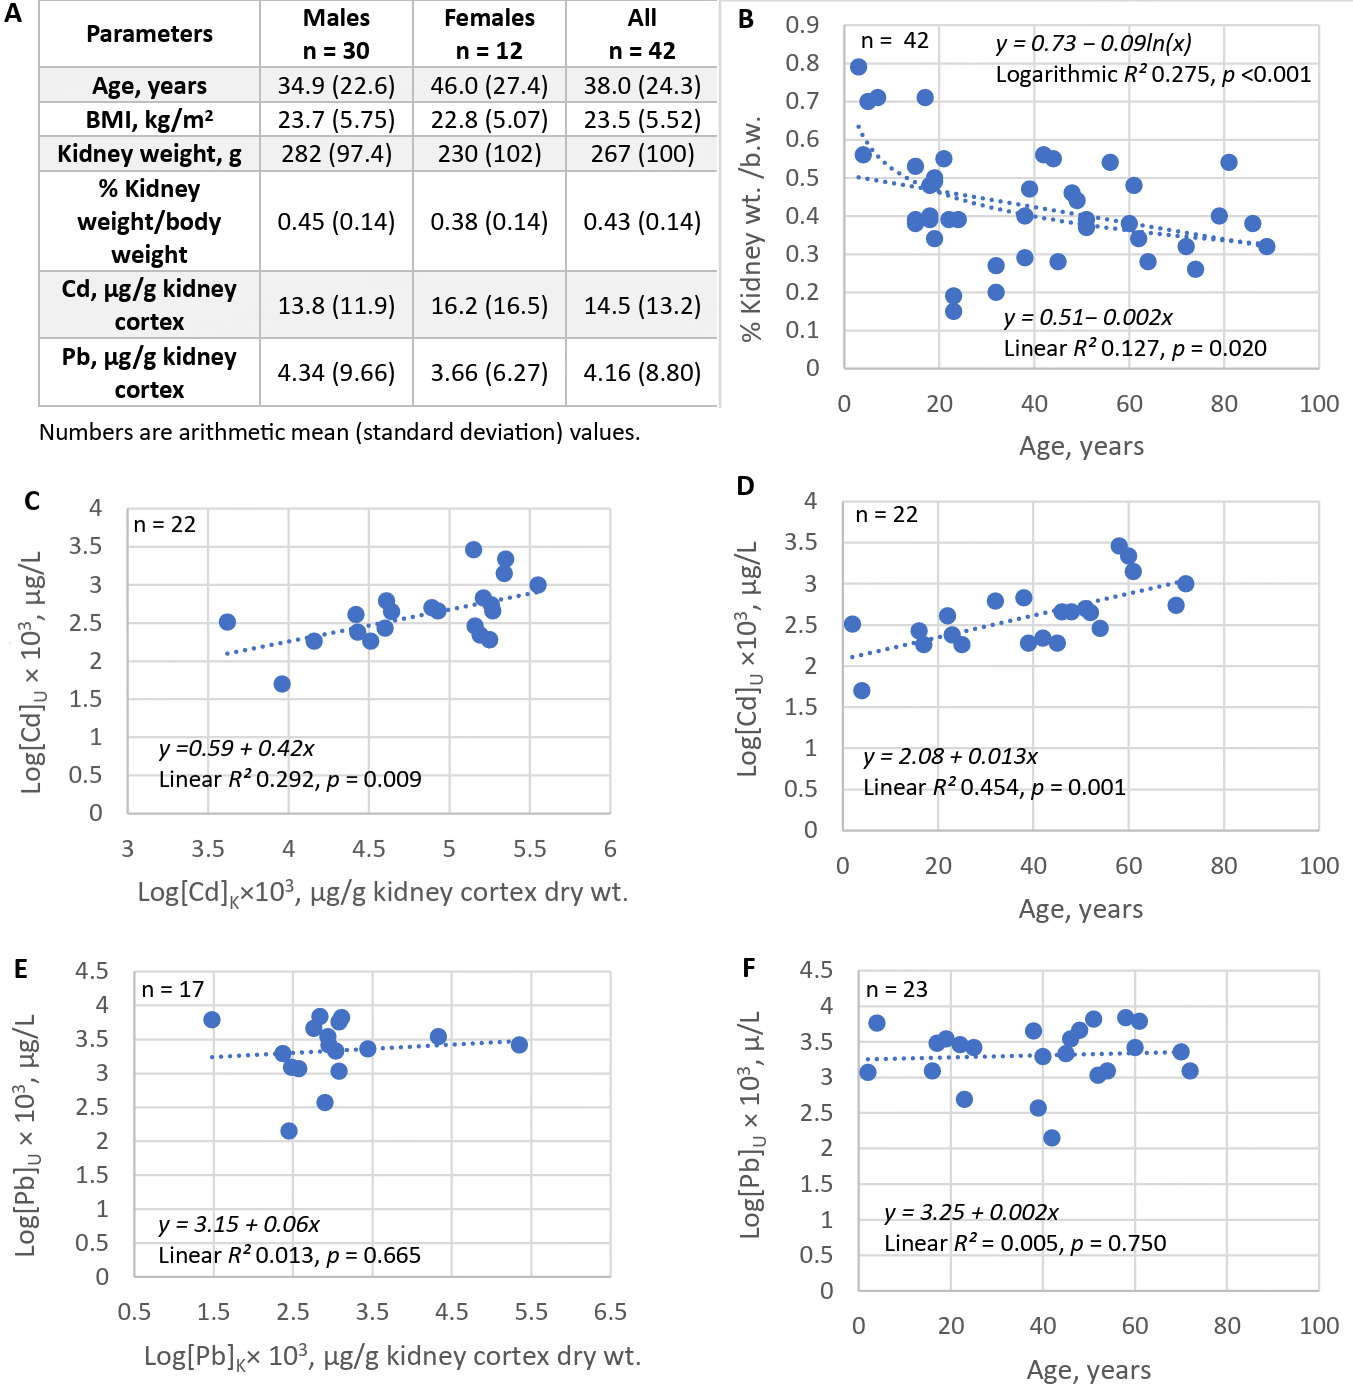
Figure 3. Kidney burden of cadmium as a determinant of urinary cadmium concentration. Kidney weight and Cd and Pb content were measured in 42 Australians (A). A scatterplot shows a decrease in kidney weight with increasing age (B); Urinary Cd concentrations increase with kidney Cd burden (C) and with age (D). Scatterplots indicate only minimal correlations between urinary Cd concentrations and kidney Pb burden (E) or age (F). Data are from Satarug et al.[100]. Cd: Cadmium.


