

Clinical electrocardiogram digitization based on U2Net
 0
0 Graphical Abstract
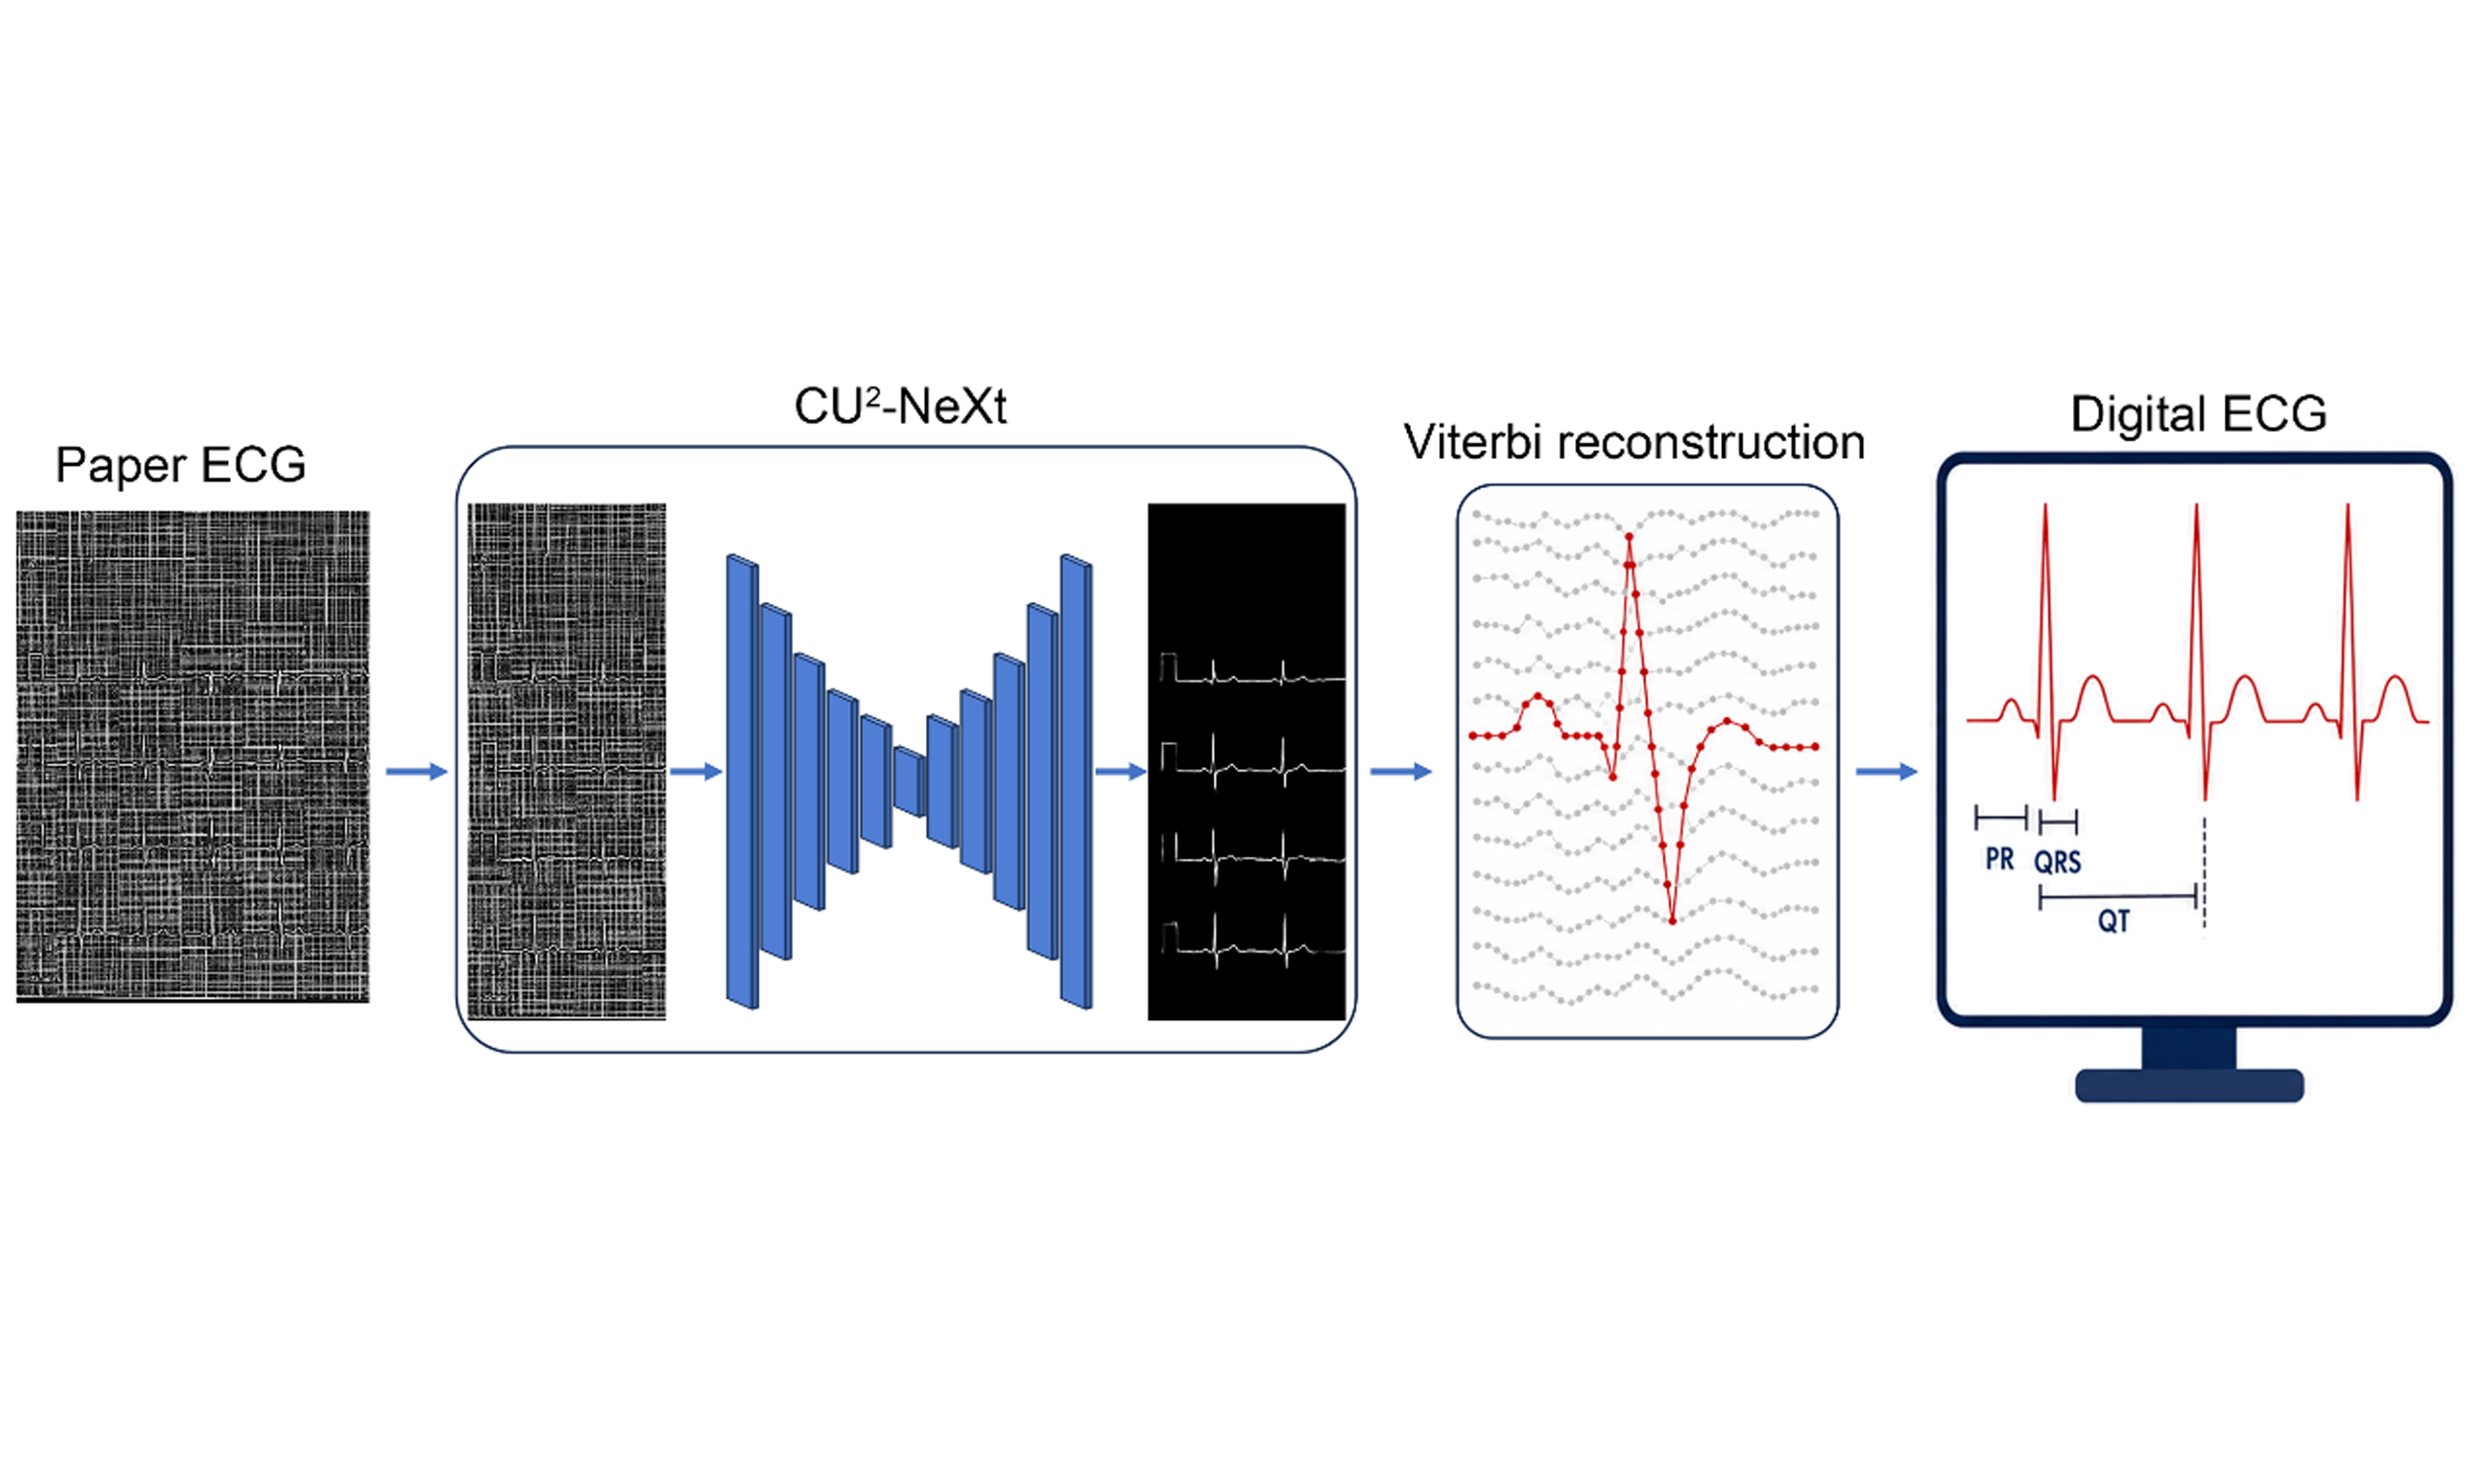
Abstract
Aim: Deep learning has advanced medical artificial intelligence, but many electrocardiogram (ECG) records remain available only as paper-based documents. Scanned paper ECG images often contain grid lines, background artifacts, and unstructured waveform information, which limits their direct use for quantitative ECG analysis. This study aimed to develop an improved ECG image segmentation method for extracting clean ECG traces from scanned paper-based ECG records and supporting subsequent ECG signal digitization.
Methods: We proposed CU2-NeXt, an ECG image segmentation framework that extends U2-Net with ConvNeXt modules and incorporates convolutional block attention module (CBAM) to emphasize waveform-related features while suppressing background artifacts. Viterbi dynamic programming was subsequently applied to reconstruct continuous signal trajectories from the segmented waveform pixels.
Results: On the evaluated dataset, CU2-NeXt achieved a macro-F1 score of 88.9% and a Dice coefficient of 78.7%, with higher overlap-based performance than the evaluated baseline segmentation models.
Conclusion: These findings demonstrate the feasibility of using CU2-NeXt for ECG trace extraction and digitization from scanned paper ECG images. The proposed framework may provide a useful preprocessing approach for converting paper ECG records into analyzable digital signals and supporting downstream quantitative ECG analysis.
Keywords


 Download PDF
INTRODUCTION
Cardiovascular disease (CVD) remains one of the most serious global health threats, with persistently high mortality and disability rates resulting from its acute attacks[1]. According to a report by the World Health Organization (WHO), approximately 17.9 million people worldwide died of cardiovascular diseases in 2019, highlighting not only the severity of the problem but also the urgent need for improved strategies in prevention, early diagnosis, and treatment. Among the available clinical tools, electrocardiogram (ECG) has become a core tool for screening, diagnosing and evaluating the prognosis of CVD in clinical practice due to its non-invasive nature, simple operation and high diagnostic value[2]. It forms a time-voltage curve containing rich pathological information by recording the potential changes generated on the body surface by cardiac electrical activity. Medical institutions around the world and the increasingly popular wearable devices generate a vast amount of ECG examinations every day, accumulating billions of ECG data in different formats[3,4]. These huge datasets contain valuable information about the epidemiological characteristics of cardiovascular diseases, the spectrum of rare diseases and their dynamic evolution, which urgently need to be deeply explored and analyzed[5-7]. However, a significant bottleneck remains in the reuse of paper-based and image-based ECG records. Although modern ECG systems can store raw waveform data in digital formats, many ECG analyses and retrospective ECG datasets are still based on paper printouts or scanned ECG images[8]. These records preserve the visual appearance of ECG waveforms but do not directly provide structured digital time-series signals. Moreover, paper-based or scanned ECG records are difficult to preserve over long periods, costly to share, and poorly compatible with advanced time-series analysis algorithms and artificial intelligence-based ECG models[9-14]. Consequently, the efficient and accurate digitization of paper ECGs into computable time-series data has become an important prerequisite for improving the reuse of historical ECG records and supporting downstream quantitative ECG analysis.
Over the past decade, extensive efforts have been devoted to the digitization of paper-based ECGs[15]. Early works mainly relied on image processing techniques, such as global threshold segmentation, anchor point detection and dynamic morphology algorithms to extract ECG signals[16], or utilized color space transformation [e.g., Hue, Saturation, Value (HSV)] combined with multi-channel threshold processing to remove the background mesh[17]. However, these methods usually require manual positioning of lead positions and perform poorly in signal overlap areas. Subsequent studies attempt to enhance the degree of automation. For instance, the automatic positioning of 12 leads is achieved through row pixel summation and region of interest (ROI) centroid analysis, and the peaks and troughs of overlapping regions are accurately located using the composite similarity method[18]. Despite progress achieved on controlled databases, such methods often fail to generalize to complex actual medical institutions, where scanned images may exhibit low resolution, character overlap, or signal distortion. To mitigate interference from text annotations, optical character recognition (OCR) has been introduced[19], yet its adaptability to low-quality scans remains limited.
More recently, deep learning has provided new opportunities for ECG digitization. Some studies model this problem as an image segmentation task, for example, applying the U-Net network to remove the grid lines of low-resolution ECGs[20]. Other methods combine object detection with generative adversarial networks (GANs), such as using YOLOv3 to detect lead regions and then using conditional GANs (CGANs) to separate lead signals from background grids[21]. To alleviate the problem of the scarcity of real labeled data, some researchers have developed the ECG-Image-Kit tool. By synthesizing ECG time series into labeled images to train neural networks, it is then used for the digitization of paper ECGs[22,23]. While such approaches expand data availability, the diversity of synthetic formats remains limited, and the generation of low-resolution and low-quality ECG images continues to pose challenges.
To address these limitations, we developed a framework that combines deep learning-based ECG trace segmentation with waveform reconstruction. Its principal methodological contribution is CU2-NeXt [Figure 1], which integrates ConvNeXt blocks and convolutional block attention module (CBAM) into a U2-Net-based architecture to improve feature extraction and fusion under noisy grid backgrounds. After segmentation, Viterbi dynamic programming, adapted from a previously reported ECG digitization method[24], was used to reconstruct continuous waveform trajectories and is not presented as a novel component of CU2-NeXt. The interval from the onset of the P wave to the onset of the QRS complex (PR interval), the ventricular depolarization complex composed of the Q, R, and S waves (QRS duration), and the interval from the onset of the QRS complex to the end of the T wave (QT interval) were measured from the reconstructed signals and compared with reference measurements from the original ECG images as a technical assessment of interval-information preservation rather than diagnostic performance.
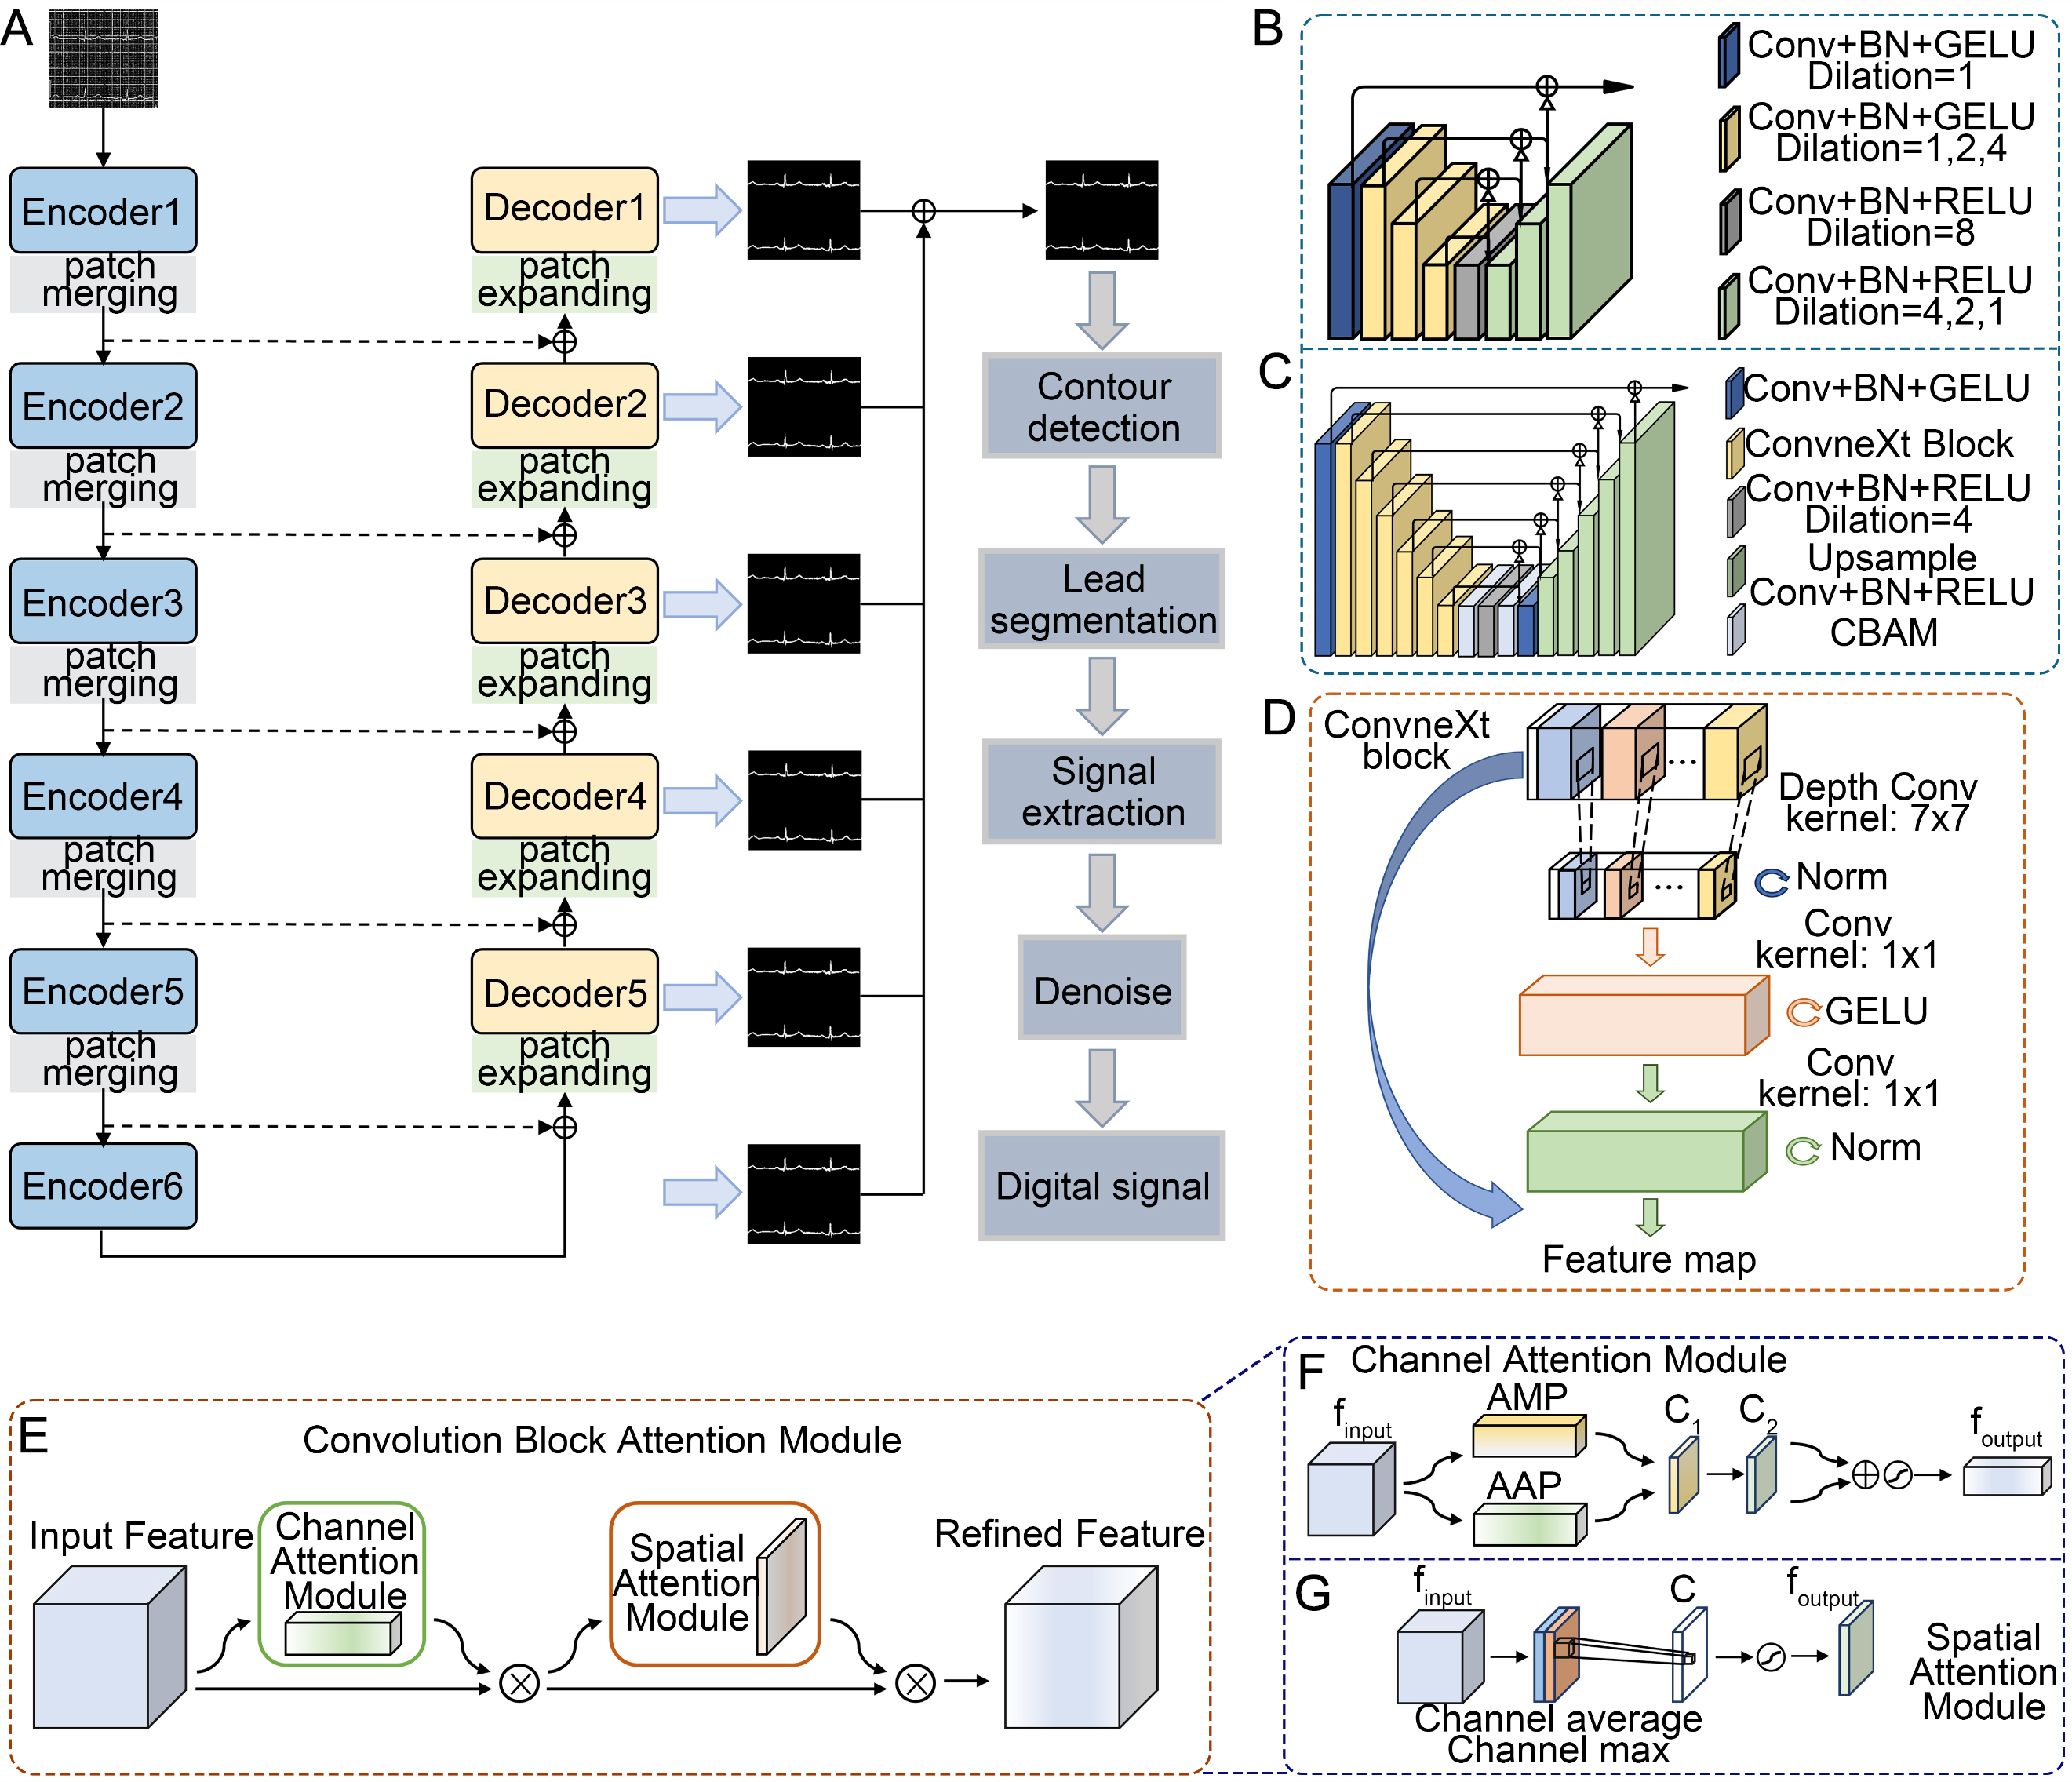
Figure 1. A Review of the Digital Network Architecture of ECG. (A) Overall encoder-decoder architecture and the downstream steps from waveform segmentation to digital-signal reconstruction; (B) Schematic illustration of Encoder5, Encoder6 and Decoder5 in CU2-NeXt; (C) Schematic of the low-level encoder and decoder components in CU2-NeXt, which employ ConvNeXt blocks for feature extraction; (D) Structure of the convolutional module, which utilizes depthwise convolution for feature extraction while capturing spatial and channel information from the feature maps; (E) Detailed architecture of the CBAM attention module; (F) Schematic of the channel attention structure; (G) Schematic of the spatial attention mechanism. ECG: Electrocardiogram; CBAM: convolutional block attention module; AMP: adaptive max pooling; AAP: adaptive average pooling; GELU: Gaussian error linear unit; BN: batch normalization.
MATERIAL AND METHODS
Datasets
The ECG scan image dataset used in this study was collected from the Chinese People’s Liberation Army (PLA) General Hospital. All ECG records were printed in a standard format, with a recording paper speed of 25 mm/s and a voltage calibration of 10 mm/mV. The dataset included three different lead layout formats: standard 12-lead, modified 15-lead, and partitioned 13-lead. All ECG images contained the 12 standard clinical leads. The 13-lead and 15-lead layouts contained the 12 standard short-duration lead traces together with one or three additional long-duration rhythm strips, respectively. These additional panels represented extended recordings of standard leads. A total of 239 scanned paper-based ECG images from 239 unique patients were included in this study. Each patient contributed only one ECG image; therefore, the image-level split was equivalent to a patient-level split. To ensure the objectivity of model evaluation and to avoid data leakage, all ECG records were randomly shuffled at the patient level using a fixed random seed of 42 and then divided into independent training, validation, and test sets. The training set contained 151 ECG images, the validation set contained 38 ECG images, and the test set contained 50 ECG images. No patient appeared in more than one subset. The patient identifiers in the training, test, and validation sets were checked to confirm that there was no overlap among the three subsets. No data augmentation was applied during model training. The validation set was used for model selection and hyperparameter tuning, whereas the held-out test set was used only for final performance evaluation. The same data split was used for all baseline models and the proposed CU2-NeXt model. The complete data flow is summarized in Supplementary Figure 1.
The reference masks were generated using a semi-automatic procedure. An image-processing pipeline first produced preliminary ECG waveform masks, which were not treated as a verified reference standard. Manual verification was performed by two physicians with experience in ECG interpretation. All 239 preliminary masks (100%) were reviewed against the original scanned ECG images and corrected for missing waveform segments, discontinuous traces, residual grid lines, and incorrectly detected background regions. For the inter-observer analysis, both physicians independently reviewed and corrected the preliminary masks for the same subset of 54 ECG images (22.6% of the complete dataset). Agreement between the two resulting binary masks was evaluated at the image level using the Dice coefficient and intersection over union (IoU). Across the 54 images, the mean ± standard deviation was 0.8306 ± 0.0148 for Dice and 0.7105 ± 0.0216 for IoU. Disagreements were resolved by consensus. Only the final manually verified and corrected masks were used as reference labels for model development and evaluation.
Overall architecture
We proposed and adopted a deep learning-based solution - the CU2-NeXt model (the structural schematic diagram is shown in Figure 1A), which is used to solve the mesh segmentation problem of ECG images efficiently and automatically. CU2-NeXt is an enhanced U2-Net model incorporating CBAM and ConvNeXt blocks[25-27]. It consists of an encoder and a decoder in a symmetric architecture, where intermediate features are connected via either CBAM modules or direct skip connections.
The input of the model is the ECG scan image I ∈ R^(1 × W × H) (where H, W, and C represent the height, width, and number of channels of the image, respectively). Each level of the six-level encoder network consists of a stage block and a Max pool layer, while the last level has only one stage block. The stage block is used to extract features and increase the number of channels to 64. The Max pool layer will be used to reduce the height and width of the feature map. Then, feature maps are transmitted to the decoder via skip connections. The five-stage decoder follows a similar architecture, with each stage consisting of a staged block and a patch expanding layer. The patch expanding layer is used to increase the height and width of the feature map, and the staged block is used to decode the feature map information. Finally, the model generates six saliency maps from the six stage blocks and the five staged blocks of the decoder through a 3 × 3 convolutional layer, and upsamples them to be consistent with the size of the input image. After cascading operations and 1 × 1 convolution, the final mapping map is generated.
Encoder block
We conceptualize and implement each Encoder block as a nested U-shaped sub-network embedded within the primary U-Net flow. This recursive design enables explicit multi-scale context aggregation within a single processing block. The Encoder block operates on a principle of progressive intra-block abstraction and refinement. As depicted in Figure 1B and C, it features an internal contracting path, a bottleneck, and an expansive path. The contracting path performs a series of feature transformations and downsampling operations, constructing a localized, low-resolution feature pyramid. This process captures a rich spectrum of contextual information, from fine-grained local textures to more extensive regional patterns, all within the block's receptive field. The bottleneck, situated at the deepest point of this internal hierarchy, is often augmented with an attention mechanism (e.g., CBAM). This allows the model to perform content-aware feature recalibration, dynamically suppressing irrelevant background information and amplifying salient diagnostic features before the reconstruction phase.
The subsequent expansive path employs upsampling and concatenative skip connections with features from the internal contracting path. This design ensures that high-level semantic information from the bottleneck is seamlessly fused with the high-resolution spatial details preserved from earlier stages of the Encoder's own processing. Consequently, each Encoder block outputs a feature map that is not merely a transformed version of its input, but a synthetically enhanced representation that consolidates information across multiple scales. By strategically instantiating Encoder blocks of varying depths (e.g., Encoder1 for early, high-resolution stages and Encoder6 for deeper, abstract stages) across the encoder-decoder, the model constructs a powerful, hierarchical feature abstraction cascade.
ConvNeXt block
Inspired by the self-attention mechanism in Swin Transformer, we employ a depthwise separable convolution with a kernel size of 7 × 7, setting the number of groups equal to the number of channels to perform independent spatial information mixing within each channel. The network width is increased to compensate for capacity loss. Feature maps are normalized to further extract representative information. A fully-connected layer implemented via 1 × 1 convolution expands the feature channels by a factor of four, followed by a Gaussian Error Linear Unit (GELU) activation function. Subsequently, another 1 × 1 convolution reduces the channel count back to its original dimension, as illustrated in Figure 1D. Experimental results demonstrate that adopting this inverted bottleneck design enhances the accuracy of medical image segmentation.
CBAM
Recognizing that features across different channels and spatial locations contribute unequally to segmentation accuracy, we augment critical bottleneck blocks with a CBAM, as illustrated in Figure 1E. CBAM operates through two sequential, complementary attention sub-modules. As shown in Figure 1F, the channel attention sub-module generates a 1D attention map by aggregating global spatial information via average pooling, followed by a compact multi-layer perceptron. This process highlights “what” is semantically meaningful by modeling interdependencies between feature channels, amplifying signals from diagnostically relevant tissue patterns while suppressing irrelevant background noise. As shown in Figure 1G, the spatial attention sub-module generates a 2D attention map by applying convolutional operations along the channel axis. It focuses on “where” informative regions are located, sharpening activations along object boundaries and within heterogeneous lesion areas. The refined features from the core block are first recalibrated channel-wise, then spatially, allowing the model to concentrate computational resources on the most salient aspects of the input feature map. This dual-path attention mechanism is particularly effective in medical imaging, where target structures often exhibit low contrast against complex backgrounds. By integrating CBAM into the deepest Encoder blocks, we enable the network to perform content-aware feature refinement, dynamically adjusting its focus and leading to more precise and contextually aware segmentation masks, especially for small, irregular, or poorly contrasted anatomical targets.
Loss function
We use Dice loss and focal loss to complete our task[28,29]. Dice loss solves the problem of class imbalance by optimizing the overlap between prediction and true segmentation. Focal loss improves the model performance by learning the weights to make the model pay more attention to difficult samples. The calculation method of the loss function is as follows:
Preprocessing
Because pixel-level manual tracing of thin ECG waveforms is time-consuming, an image-processing pipeline was used to generate preliminary waveform masks by suppressing the background grid and retaining candidate ECG traces. These pipeline outputs were not treated as final ground truth. All preliminary masks were subsequently reviewed and corrected against the original scanned ECG images by trained annotators, and only the final manually verified masks were used as reference labels for model training and evaluation. The image-processing steps used to produce the preliminary masks are described below.
Initial noise reduction: Apply a Gaussian blur filter to the original scanned image to suppress local noise, and then perform global threshold processing for preliminary binarization.
Grid line enhancement and positioning: Perform precise binarization threshold operations on the initially processed image to significantly enhance the background grid lines. Design structured template elements in the vertical and horizontal directions. Through the template matching algorithm, these template elements are slid in the image to accurately identify and locate the pixel coordinates of all vertical and horizontal grid lines.
Grid removal: Utilizing the grid pixel coordinate information obtained in step 2, systematically delete all pixel points belonging to the background grid in the image.
Residual noise removal: Set a threshold based on the pixel area size of the connected regions (contours) in the image to filter out and remove the small noise points remaining after step 3 processing.
Signal pixel compensation: During the above-mentioned process of removing grids and noise, some pixels belonging to ECG signals may be mistakenly deleted. To this end, interpolation processing is carried out on the signal region (for example, linear interpolation or morphological operation) to compensate for the lost signal pixels and restore the continuous ECG waveform.
The image-processing pipeline generated preliminary ECG waveform masks for all 239 images. All masks were manually reviewed and corrected by trained annotators with reference to the original scans, and only the final corrected masks were used for model development and evaluation. As a limited supplementary consistency check, six PDF-format ECG records with accessible original digital waveform signals were also examined. Masks produced by the preprocessing procedure were compared with masks derived from the corresponding original digital signals using IoU and Dice coefficients; the results are presented in Supplementary Figure 2 and Supplementary Table 1. Because this comparison included only six cases, it does not constitute comprehensive validation of the reference standard. Of the 239 labeled ECG images, 151 were assigned to training, 38 to validation, and 50 to the held-out test set.
Implementation details
In this study, we employed an end-to-end deep learning architecture to conduct feature segmentation experiments on ECG temporal signals. In the experiment, the batch processing size was set to 32, and the AdaBound optimizer was used. By dynamically adjusting the learning rate boundary, it effectively combined the rapid convergence of the Adam optimizer in the early stage of training with the stable generalization ability of the Stochastic Gradient Descent (SGD) optimizer in the late stage. The initial learning rate was set to 0.00001 with a weight decay of 0.00001. The training period was run for 100 epochs, a number determined through pre-experiment to ensure full convergence of the loss function. All implementations were developed using the PyTorch 2.4.1 deep learning framework and executed on a single NVIDIA GeForce RTX 4080 GPU with 16GB of GDDR6X memory.
Statistical analysis
During model development, validation-set comparisons, ablation experiments, five-fold cross-validation, held-out test-set and subgroup analyses, macro-F1 was calculated from predictions binarized at a threshold of 0.5 using the scikit-learn function f1-score with average = ’macro’. The class-specific F1-score was calculated as
As a supplementary internal stability analysis, five-fold cross-validation was performed at the patient level using the 189-image development dataset, comprising the 151-image training set and the 38-image validation set. The development dataset was partitioned into five non-overlapping folds. In each iteration, four folds were used for model training and the remaining fold was used for validation. The 50-image held-out test set was not included in cross-validation and was used only for the final evaluation of the selected model. Because each patient contributed one ECG image, no patient appeared in more than one fold. The same preprocessing procedure, CU2-NeXt configuration, training settings, and evaluation metrics were used across all folds. Fold-level results were summarized using the mean and standard deviation. This analysis was intended to assess internal stability and did not constitute external validation.
Segmentation performance on the held-out 50-image test set was also summarized descriptively by ECG lead format and overall image-noise level. Representative ECG images corresponding to different noise types are shown in Supplementary Figure 3. Because subgroup sizes were unequal, no formal between-subgroup hypothesis tests were performed; values are reported as mean ± standard deviation, except for a single 12-lead case. Standardized annotations for image-resolution categories, specific noise sources, text overlap, lead overlap, and waveform morphology were not available, so reliable subgroup estimates could not be produced for these characteristics. For interval validation, each digitized PR interval, QRS duration, and QT interval was paired with its reference measurement from the original ECG image. Mean absolute error (MAE), root mean square error (RMSE), and the Pearson correlation coefficient were calculated for each interval. For Bland-Altman analysis, the paired difference was defined as the digitized measurement minus the reference measurement. Bias was calculated as the mean paired difference, and the 95% limits of agreement were calculated as the bias ± 1.96 standard deviations of the paired differences.
Ethics statement
This retrospective study used stored paper-based ECG records from the Chinese PLA General Hospital. The Medical Ethics Committee of the Chinese PLA General Hospital assessed the study and determined that it was exempt from further medical ethics review; no separate ethics approval number was assigned to the exemption. Under this exemption, individual informed consent was not required because the study involved retrospective analysis of existing records, no direct patient contact, no clinical intervention, and no additional examination. Before analysis, identifiers visible on the ECG records, including patient names, medical record numbers, barcodes, and examination dates, were removed or masked. Only de-identified ECG images were available to the research team for model development and evaluation.
RESULTS
Analysis of segmentation results
We compared the proposed CU2-NeXt model with Attention U-Net, U-Net, Res-UNet, and DeepLabV3. These models represent commonly used segmentation architectures based on encoder-decoder structures, residual learning, attention mechanisms, and atrous convolution. The comparison was designed to assess their relative performance on scanned ECG images affected by variable image quality, gridline interference, and low signal-to-noise ratios. As illustrated in Figure 2A, CU2-NeXt produced comparatively continuous waveform masks with reduced gridline interference in the selected examples. Among the comparison models, U-Net and Attention U-Net captured the general waveform shape but retained some gridline artifacts or produced fragmented predictions in selected cases. Res-UNet showed similar limitations around fine boundaries, including occasional over-segmentation or connections between adjacent waveform peaks. DeepLabV3 produced less precise boundaries for some low-amplitude waveform components.
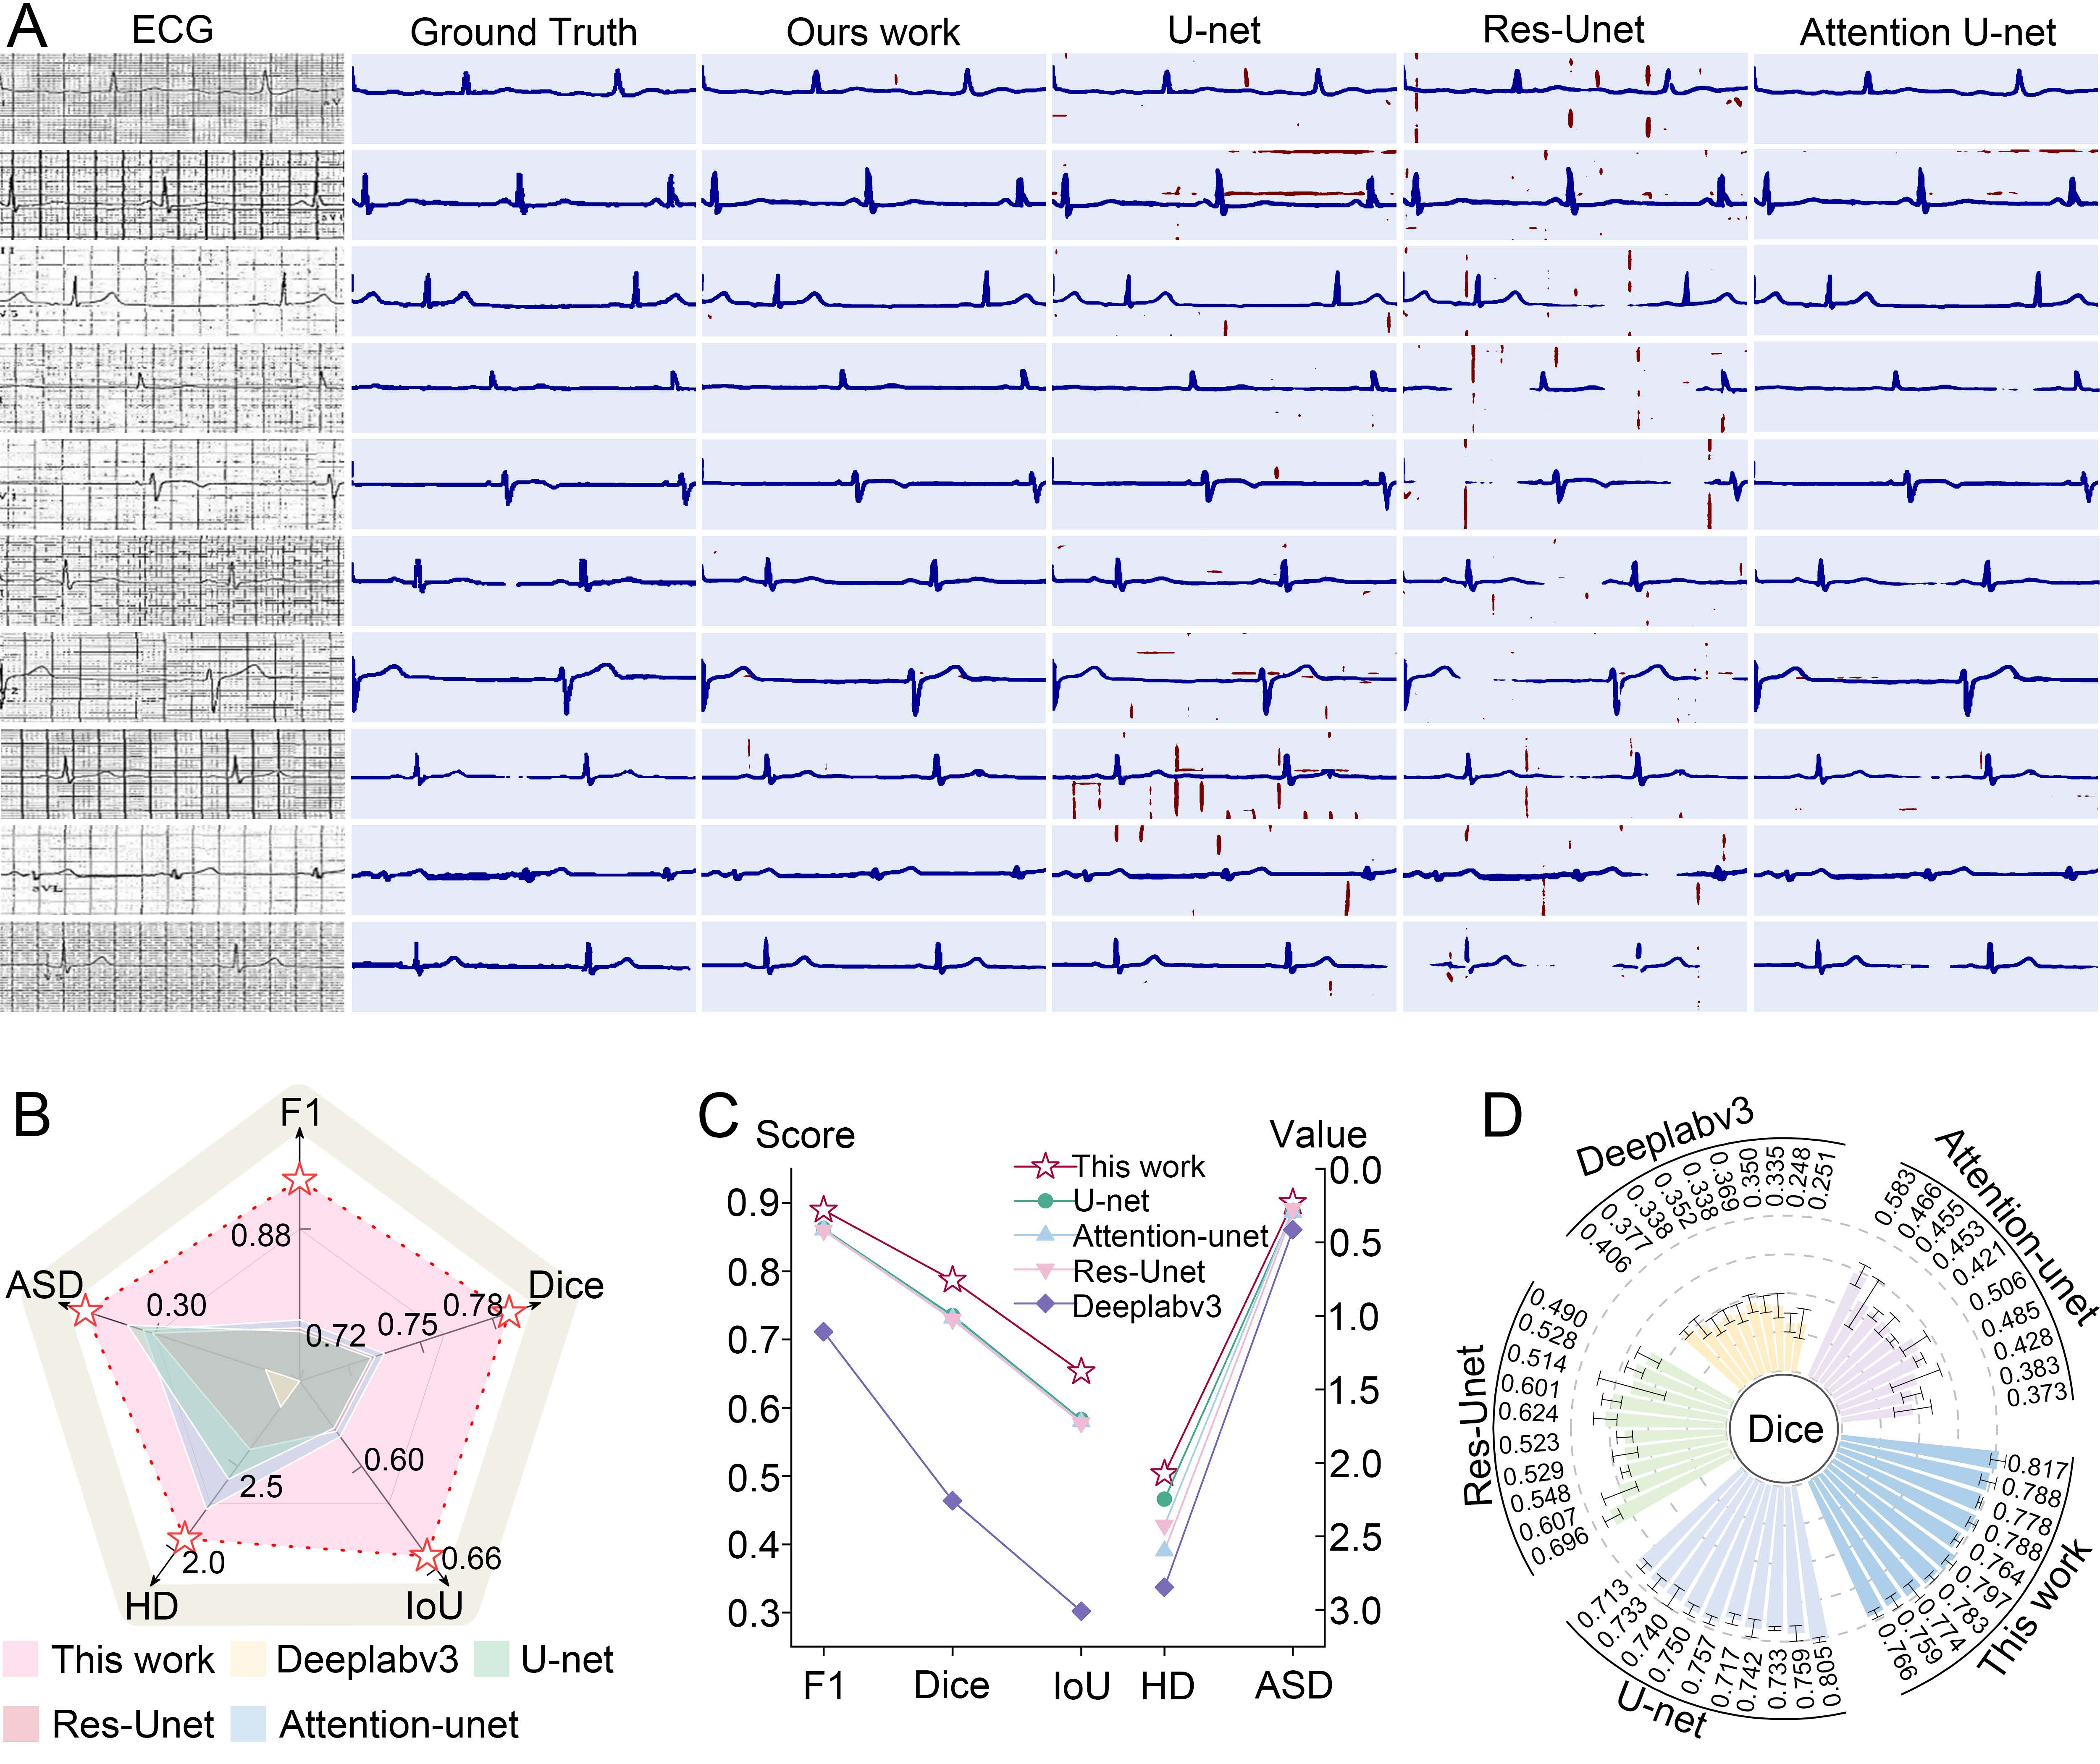
Figure 2. Analysis of the segmentation experiment results on ECG data. (A) Representative ECG segmentation results showing the manually corrected reference masks and outputs of the evaluated models; (B) Radar plot showing validation-set performance during model development, including macro-F1, Dice coefficient, IoU, HD, and ASD; (C) Line plot summarizing the same validation-set metrics. Higher macro-F1, Dice coefficient, and IoU indicate better overlap-based segmentation performance, whereas lower HD and ASD indicate better boundary agreement; (D) Dice coefficient evaluation on the test set ECG data with varied paper formats. Dice coefficients were first calculated at the image level. For visualization, the 50 images were randomly divided into 10 groups with 5 images per group. Each bar represents the group mean Dice coefficient, and error bars indicate the standard deviation within each group. This subset was not used for model training, model selection, hyperparameter tuning, or ablation experiments. Statistical comparisons between CU2-NeXt and the baseline models were performed using paired image-level data from all 50 images before grouping. Mean paired differences and 95% confidence intervals were estimated by paired bootstrap resampling. Two-sided Wilcoxon signed-rank tests were used, with Holm-Bonferroni correction within each baseline comparison across macro-F1, Dice coefficient, and IoU; adjusted P < 0.05 was considered statistically significant. ECG: Electrocardiogram; HD: hausdorff distance; ASD: average surface distance; IoU: intersection over union.
Segmentation was assessed using complementary overlap- and boundary-based measures. Macro-F1, defined as the unweighted mean of the ECG waveform and background class-specific F1-scores, was used for model-development, validation-set, ablation, held-out test-set, subgroup analyses and cross-validation results. The Dice coefficient also measured foreground overlap, and IoU quantified the intersection relative to the union of predicted and reference waveform pixels. Hausdorff distance (HD) measured the maximum boundary discrepancy, whereas average surface distance (ASD) measured the mean boundary separation.
The quantitative results presented in Figure 2B and C show differences in overlap- and boundary-based performance among the evaluated models. U-Net and Attention U-Net achieved relatively higher Macro-F1, Dice, and IoU values compared with Res-UNet and DeepLabV3, whereas the HD and ASD results varied across models. These findings illustrate that regional overlap and boundary-distance metrics characterize different aspects of segmentation and should not be used interchangeably.
In the quantitative comparison on the validation dataset, CU2-NeXt achieved higher overlap-based metrics than the evaluated baseline models. Compared with U-Net, macro-F1, Dice coefficient, and IoU increased by 1.49%, 2.90%, and 3.88%, respectively, while HD and ASD decreased by 0.17 and 0.06. Compared with Attention U-Net, the corresponding increases were 1.80%, 3.38%, and 4.51%, with reductions of 0.52 in HD and 0.07 in ASD. These results indicate favorable performance on the present dataset, although the small single-center sample limits conclusions regarding stability and generalizability.
On the held-out 50-image test set, we evaluated the macro-F1, Dice coefficient, IoU, HD, and ASD (as shown in Figure 2D and Supplementary Figure 4), and performed paired analyses of macro-F1, Dice coefficient, and IoU. Compared with U-Net, CU2-NeXt showed mean paired improvements of 0.0304 in macro-F1, 0.0401 in Dice coefficient, and 0.0516 in IoU, with 95% confidence intervals of 0.0269-0.0344, 0.0353-0.0451, and 0.0458-0.0576, respectively. Compared with Attention U-Net, the corresponding improvements were 0.0727, 0.3338, and 0.3482, with 95% confidence intervals of 0.0544-0.0935, 0.3151-0.3538, and 0.3343-0.3630, respectively. All paired comparisons remained statistically significant after Holm-Bonferroni correction. The full paired statistical results are provided in Supplementary Table 2.
The five-fold cross-validation analysis yielded a macro-F1 score of 0.881 ± 0.011, a Dice coefficient of 0.770 ± 0.021, and an IoU of 0.629 ± 0.028. The corresponding HD and ASD values were 4.064 ± 3.704 mm and 0.270 ± 0.103 mm, respectively. The overlap-based metrics varied relatively little across folds, whereas the greater fold-to-fold variation in HD and ASD suggests that boundary-level performance was more sensitive to fold composition and image quality. These results provide an internal assessment of model stability; they do not establish generalizability to data from other institutions. Complete fold-level results are provided in Supplementary Table 3.
A descriptive subgroup analysis was performed according to ECG lead format and overall image-noise level in the 50-image test set. The 13-lead subgroup achieved an IoU of 0.6560 ± 0.0330, a macro-F1 of 0.9661 ± 0.0059, and a Dice coefficient of 0.8118 ± 0.0259. The corresponding values for the 15-lead subgroup were 0.5750 ± 0.0510, 0.9550 ± 0.0145, and 0.6616 ± 0.0446. Only one 12-lead ECG was available and was therefore reported as a single-case result. The low-, medium-, and high-noise subgroups achieved Dice coefficients of 0.6979 ± 0.0331, 0.7235 ± 0.0460, and 0.8331 ± 0.0241, respectively. Complete subgroup results are provided in Supplementary Table 4.
These results provide preliminary evidence that CU2-NeXt possesses a stronger capacity for precise segmentation and boundary depiction in the present dataset. The performance gains are attributed to its synergistic architectural components: the ConvNeXt blocks facilitate robust and hierarchical feature extraction at multiple scales, effectively mining discriminative ECG information, while the strategically placed CBAM modules enable self-attentive learning, enhancing the model's focus on salient signal features and suppressing distracting gridlines. This leads to an improved ability to discriminate between foreground signals and background noise. As further evidenced by the consolidated performance visualization in Figure 2D, the segmentation results of CU2-NeXt show favorable overlap-based performance compared with the baseline models, although the stability of these findings still requires further validation in larger and more diverse datasets. The model’s favorable performance suggests its potential as a useful preprocessing approach for the automated digitization and analysis of historical ECG records.
Explanatory analysis of the model
Gradient-weighted Class Activation Mapping (Grad-CAM) was used to examine which image regions contributed to the foreground ECG-trace output at selected layers of the trained CU2-NeXt model [Figure 3]. Figure 3A showed spatially distributed activation at earlier layers and comparatively concentrated activation around waveform regions at selected deeper encoder and decoder layers. Warmer colors represent a greater relative positive contribution to the selected foreground output, whereas cooler colors indicate a lower relative contribution; they should not be interpreted as negative correlation or causal importance. These visualizations provide qualitative information about model attention and do not constitute quantitative validation of segmentation or clinical performance.
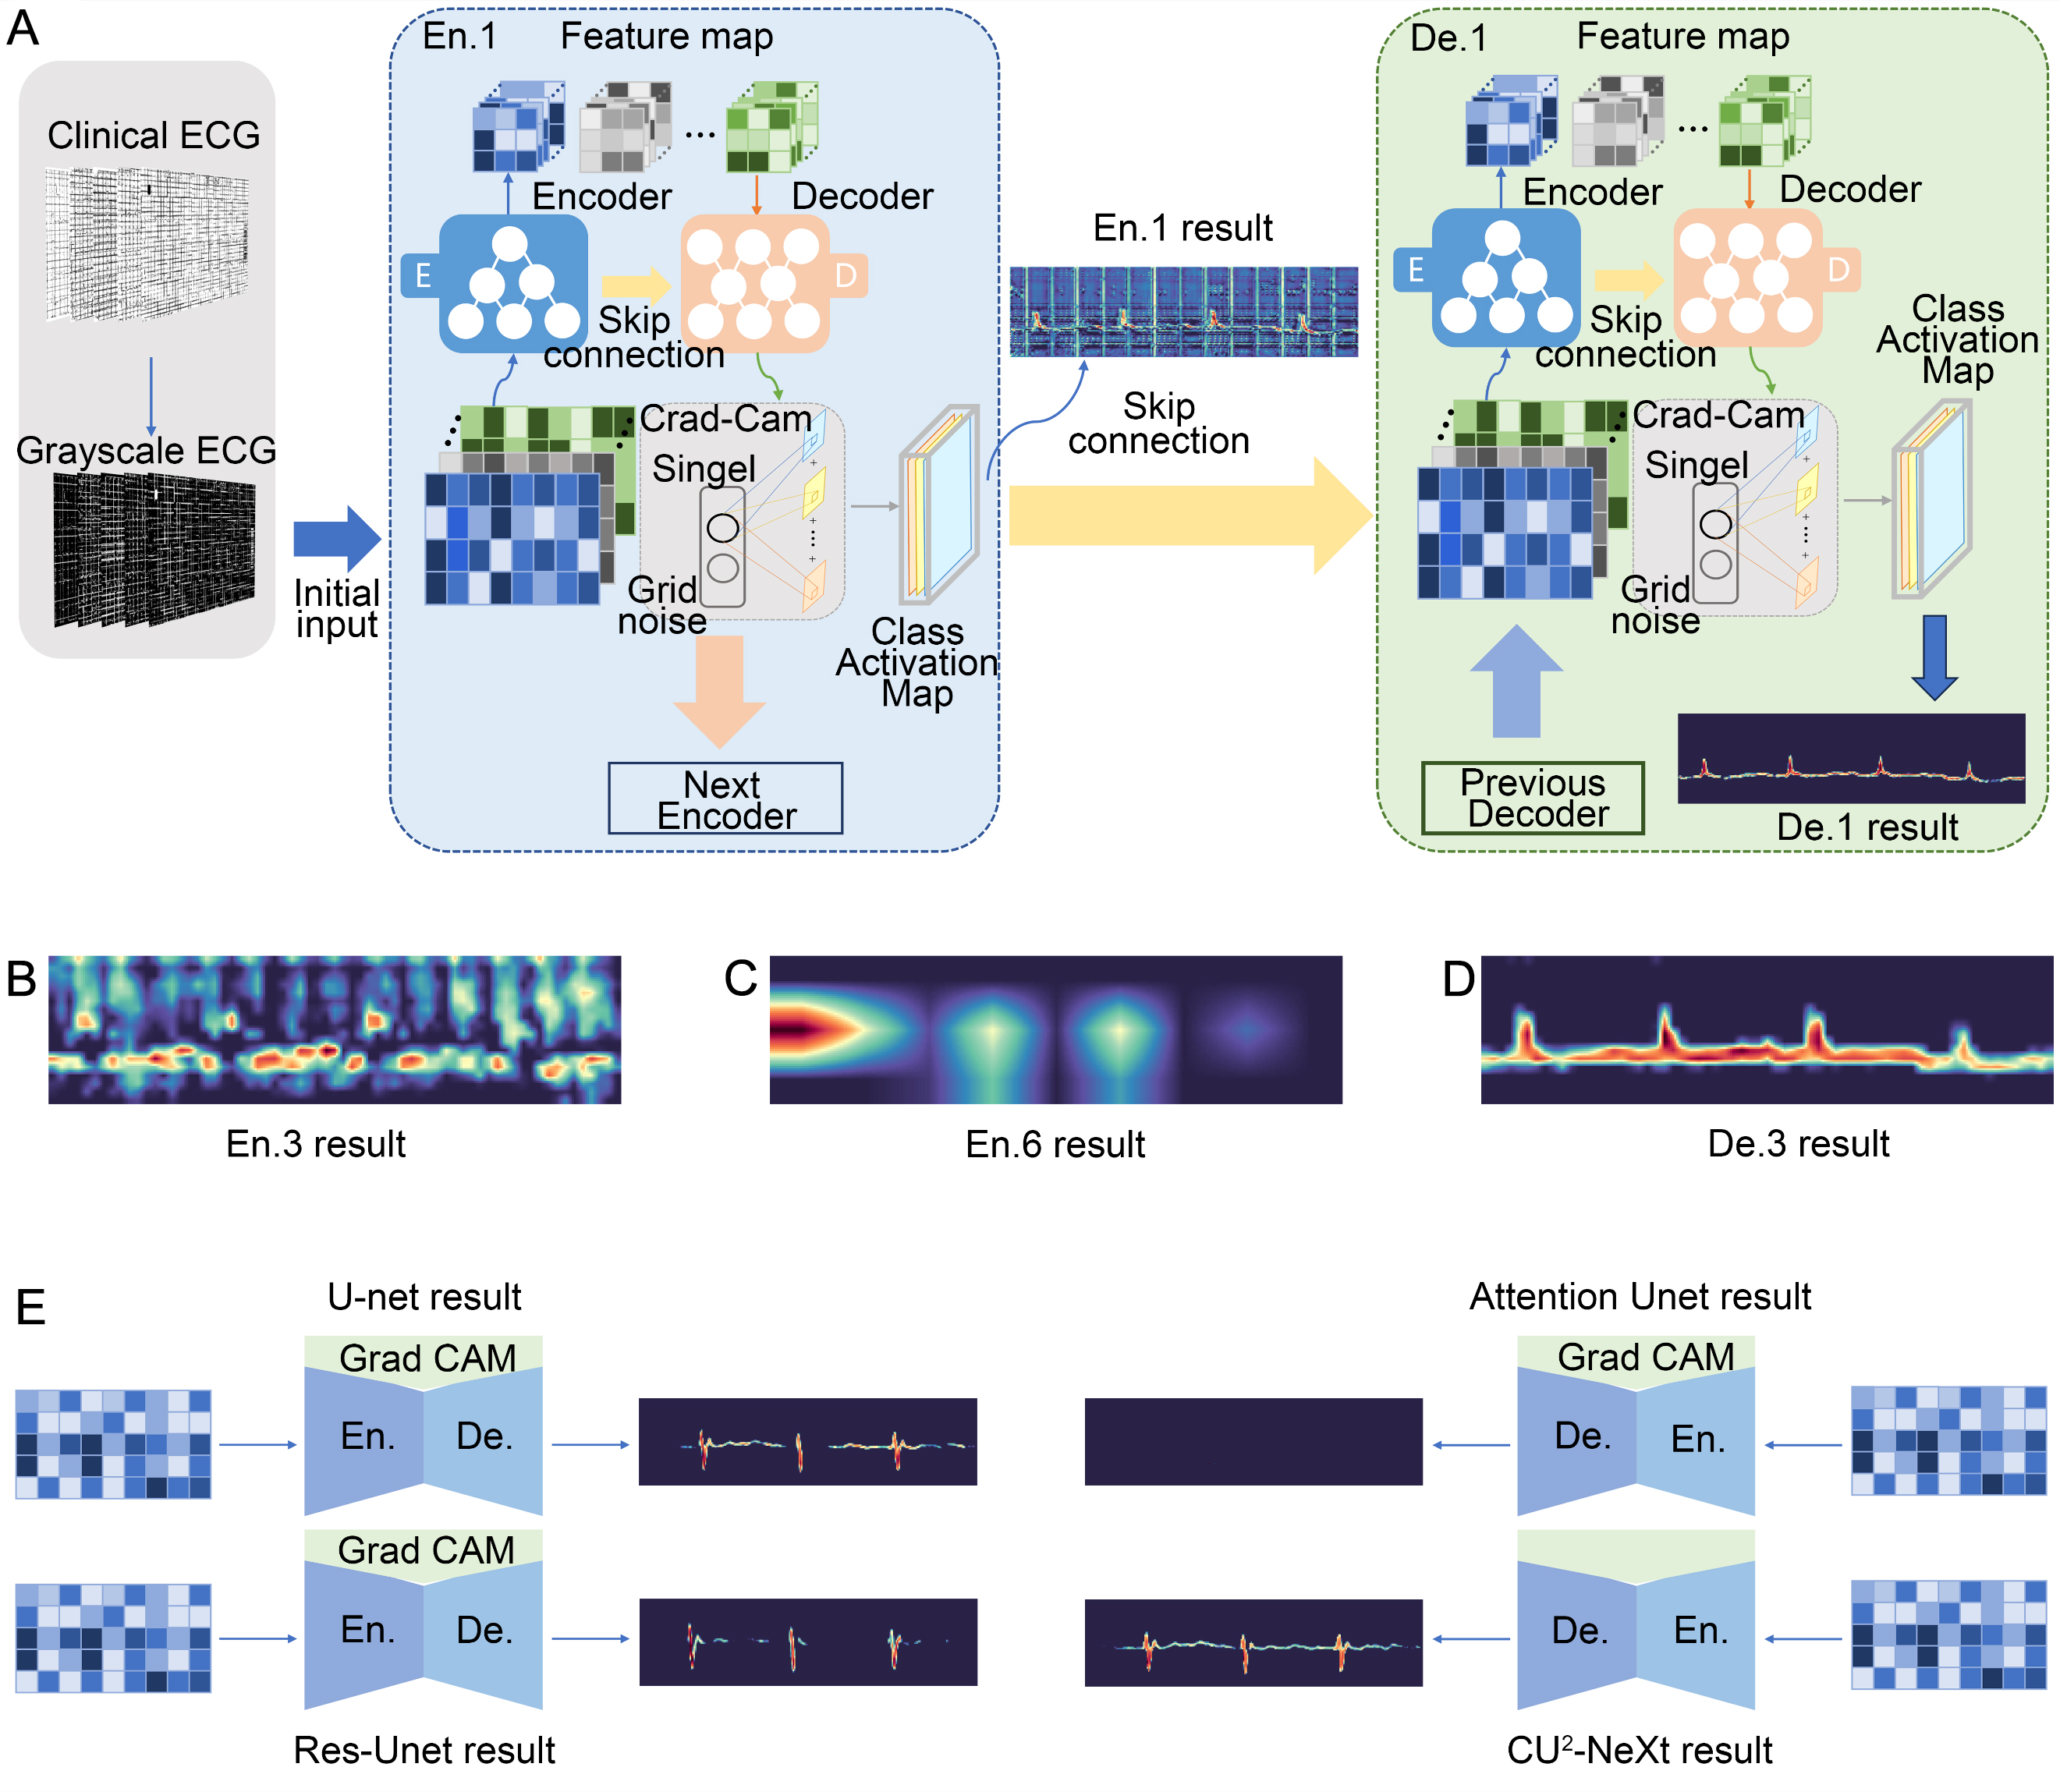
Figure 3. Grad-CAM visualization of feature responses in CU2-NeXt. (A) Overview of the visualization workflow; (B-D) Grad-CAM maps from Encoder 3, Encoder 6, and Decoder 3, respectively; warmer colors indicate greater relative positive contributions to the foreground ECG-trace output; (E) Qualitative comparison of Grad-CAM maps from CU2-NeXt and the baseline models under the same visualization settings. ECG: Electrocardiogram; Grad-CAM: gradient-weighted class activation mapping.
As shown in Figure 3B and C, across the selected layers, activation appeared to become more concentrated around visible ECG waveform regions, including portions of the P wave, QRS complex, and T wave. The activation maps of the decoder layers exhibited stronger spatial localization compared to those of some encoder layers, as illustrated in Figure 3D. These observations are descriptive and may suggest progressive refinement of waveform-related features.
For qualitative comparison, class activation maps were generated under identical settings for Attention U-Net, U-Net, and Res-UNet [Figure 3E]. The baseline heatmaps showed comparatively diffuse activation patterns in some examples, including responses in background grid regions. CU2-NeXt showed more concentrated activation around ECG waveform regions and fewer responses in background grid areas. These visualizations suggest that the model tended to focus on signal-related regions during segmentation.
Ablation studies
Figure 4 summarizes the ablation analysis, ECG digitization results, and interval-agreement analyses. As shown in Figure 4A, we conducted a comprehensive ablation study on 189 ECG images from the development dataset to evaluate the contributions of the key architectural components. The experiment was designed to measure the impact of different modules on segmentation performance and computational efficiency. Six evaluation metrics were employed: macro-F1, Dice coefficient, IoU, HD, ASD, and GFLOPs. Macro-F1, Dice, and IoU were used to quantify pixel-level overlap, whereas HD and ASD were used to evaluate boundary discrepancies. GFLOPs represented the computational complexity of each model. The results are summarized in Table 1. All configurations were trained for a maximum of 100 epochs using the same development-data protocol.
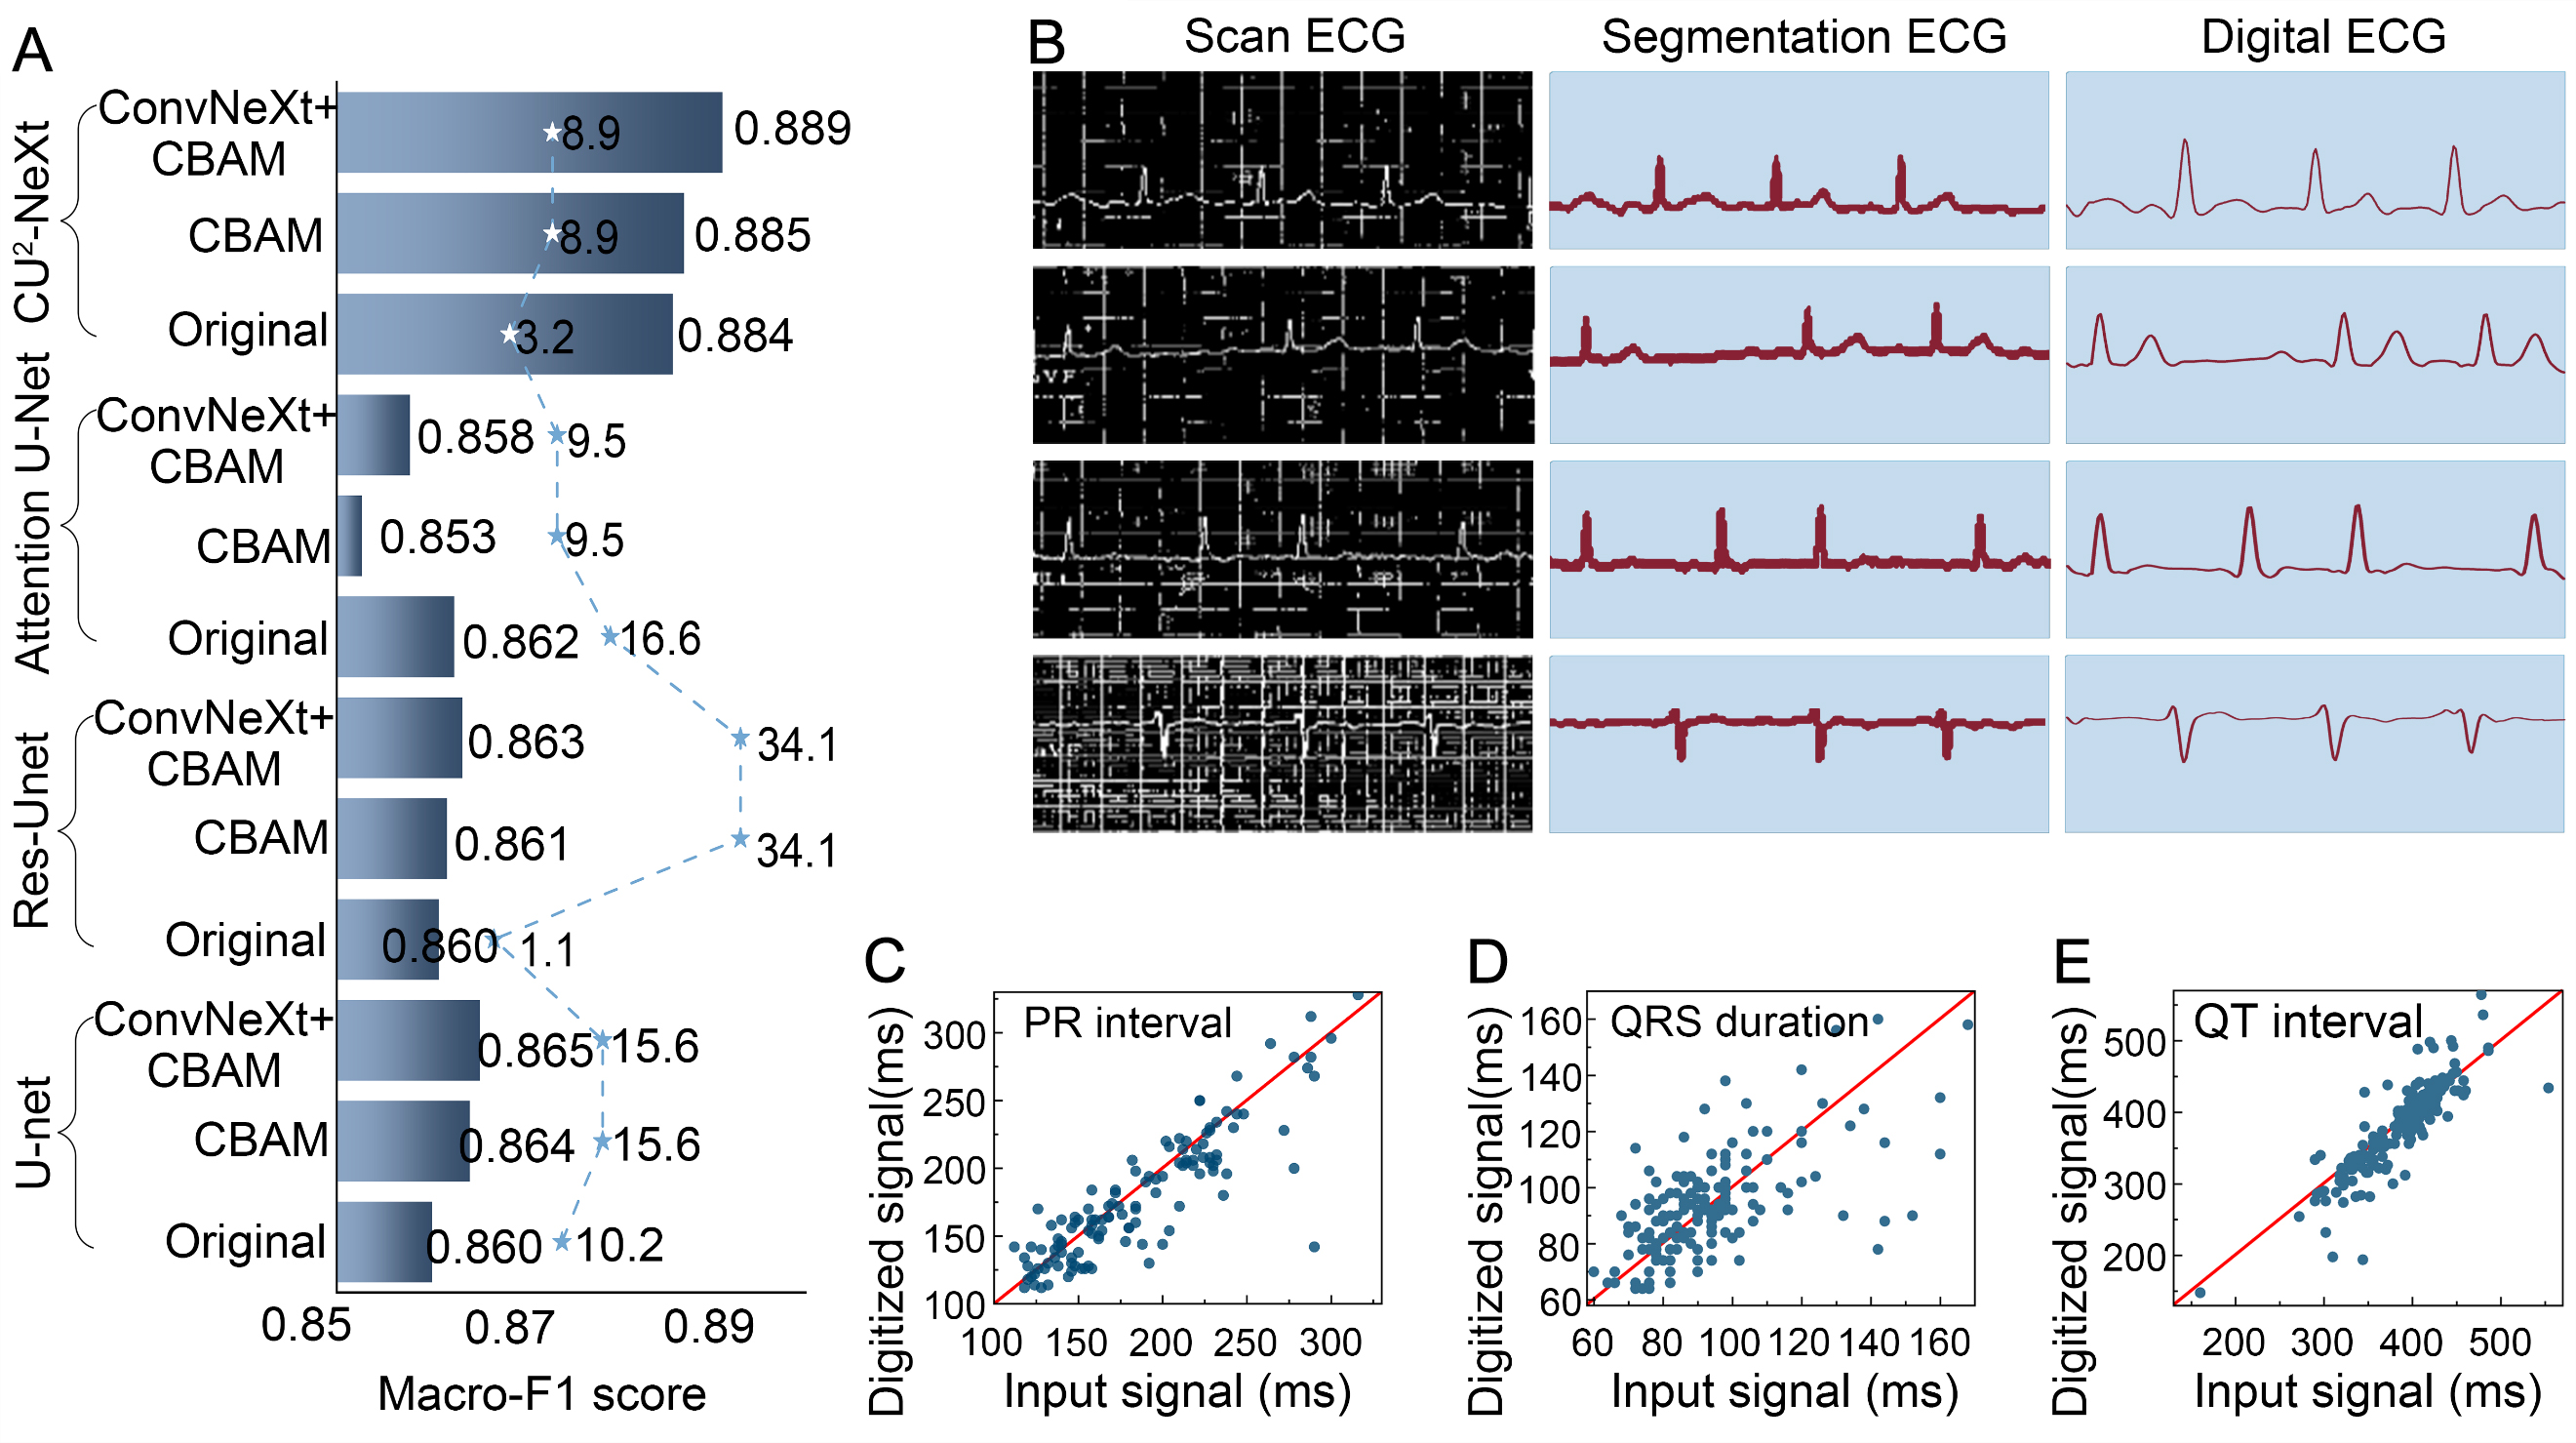
Figure 4. (A) Macro-F1 scores obtained from the 189-image development dataset and computational complexity of the evaluated architectural variants. Horizontal bars indicate the mean macro-F1 score calculated from the binarized segmentation results using a threshold of 0.5. Macro-F1 was defined as the unweighted mean of the F1-scores for the ECG waveform and background classes. The dashed line with star markers shows GFLOPs for one forward pass of a single ECG image; the markers do not indicate error bars or statistical significance; (B) Comparison of digitization results and model segmentation results. Left: Original gray-scale ECG, middle: Binary graph of model segmentation results, right: Digital ECG; (C) Agreement analysis of the PR interval between the digitized ECG signals and the manually measured values from the original ECG images; (D) Agreement analysis of the QRS duration between the digitized ECG signals and the manually measured values from the original ECG images; (E) Agreement analysis of the QT interval between the digitized ECG signals and the manually measured values from the original ECG images. ECG: Electrocardiogram; GFLOPs: giga floating point operations per second; CBAM: convolutional block attention module; QRS: the ventricular depolarization complex composed of the Q, R, and S waves; QT: the interval from the onset of the QRS complex to the end of the T wave; PR: the interval from the onset of the P wave to the onset of the QRS complex.
Ablation study of CU2-NeXt on the development dataset, including component, CBAM-location, and ConvNeXt-depth comparisons
| Method | Macro-F1 | Dice | IoU | HD | ASD | GFLOPs |
| U2-net | 0.884 | 0.778 | 0.638 | 2.044 | 0.220 | 3.169 |
| CBAM at Encoder 1 | 0.883 | 0.776 | 0.635 | 14.253 | 0.322 | 8.895 |
| CBAM at Encoder 3 | 0.878 | 0.765 | 0.623 | 5.418 | 0.269 | 8.895 |
| CBAM at Encoder 5 | 0.885 | 0.778 | 0.639 | 11.013 | 0.276 | 8.895 |
| CBAM at Encoder 6 | 0.885 | 0.780 | 0.641 | 2.128 | 0.211 | 8.895 |
| ConvNeXt depth (1,2,2,1) | 0.873 | 0.756 | 0.610 | 3.520 | 0.245 | 10.894 |
| ConvNeXt depth (1,1,1,1) | 0.874 | 0.762 | 0.608 | 6.365 | 0.275 | 7.169 |
| ConvNeXt depth (1,1,1,3) | 0.862 | 0.735 | 0.582 | 6.581 | 0.290 | 8.897 |
| CU2-NeXt | 0.889 | 0.787 | 0.652 | 2.074 | 0.227 | 8.897 |
We first evaluated the contribution of CBAM by comparing the complete CU2-NeXt model with a ConvNeXt-only configuration in which the CBAM-enhanced skip connections were replaced with standard skip connections. The ConvNeXt-only configuration achieved a macro-F1 score of 0.878, a Dice coefficient of 0.765, and an IoU of 0.621, with an HD of 3.848 mm and an ASD of 0.246 mm. After CBAM was incorporated into the complete CU2-NeXt architecture, macro-F1 score, Dice coefficient, and IoU increased to 0.889, 0.787, and 0.652, respectively, while the HD and ASD decreased to 2.074 and 0.227 mm, respectively. These results indicate that attention-based feature refinement contributed to improved overlap and boundary localization in this configuration.
To determine whether the effect of CBAM depended on its insertion location, we further evaluated CBAM-enhanced skip connections associated with Encoder 1, Encoder 3, Encoder 5 and Encoder 6. Among these configurations, the Encoder 6 placement achieved the highest overlap-based performance, with a macro-F1 score of 0.885, a Dice coefficient of 0.780, and an IoU of 0.641. The corresponding values for Encoder 1 were 0.883, 0.776, and 0.635, whereas those for Encoder 3 were 0.878, 0.765, and 0.623, respectively. However, the three location-specific configurations produced relatively high HD values of 14.253, 5.418, and 2.128 mm, respectively. This finding indicates that improved regional overlap does not necessarily correspond to more accurate localization of the most distant boundary errors. It also supports the use of complementary overlap- and distance-based metrics when evaluating thin and spatially discontinuous ECG waveforms.
We next assessed the contribution of ConvNeXt blocks, which constitute the main feature-extraction units in the encoder and decoder pathways. The ConvNeXt-only configuration achieved a macro-F1 score of 0.878, a Dice coefficient of 0.765, and an IoU of 0.621. We also examined depth configurations of (1,2,2,1), (1,1,1,1), and (1,1,1,3).
These configurations achieved macro-F1 scores of 0.873, 0.874, and 0.862; Dice coefficients of 0.756, 0.762, and 0.735; and IoU values of 0.610, 0.608, and 0.582, respectively. None outperformed the standard ConvNeXt-only configuration in the overlap-based metrics. These findings suggest that increasing or redistributing block depth did not improve segmentation performance on the present development dataset.
We also included U2-Net and U2-Net+CBAM as the baseline and CBAM-only comparison, respectively. U2-Net achieved a macro-F1 score of 0.884, a Dice coefficient of 0.778, and an IoU of 0.638, whereas U2-Net+CBAM achieved corresponding values of 0.885, 0.780, and 0.641. The complete CU2-NeXt model achieved the highest overlap-based results, with a macro-F1 score of 0.889, a Dice coefficient of 0.787, and an IoU of 0.652. Nevertheless, CU2-NeXt did not outperform the baseline models on every distance-based metric. Its HD of 2.074 was slightly higher than that of U2-Net (2.044), and its ASD of 0.227 was higher than those of U2-Net (0.220) and U2-Net+CBAM (0.211). Therefore, the results demonstrate an advantage primarily in overlap-based segmentation performance rather than superiority across all evaluated metrics. Macro-F1 averages the ECG waveform and background class-specific F1-scores, whereas Dice and IoU characterize foreground overlap and HD and ASD are sensitive to boundary deviations and isolated prediction errors.
We further compared CU2-NeXt with its direct baseline, U2-Net+CBAM, using a paired image-level analysis of 50 ECG images. Paired Wilcoxon signed-rank tests showed that CU2-NeXt achieved significantly higher macro-F1, Dice, and IoU values than U2-Net+CBAM (all multiplicity-adjusted P < 0.001). As detailed in Supplementary Table 5, the mean paired improvements were 0.0151 and 0.0403 for Macro F1-score and Dice and 0.0532 for IoU, with 95% bootstrap confidence intervals excluding zero. These findings provide statistical support for the improvements in overlap-based segmentation performance.
In summary, the expanded ablation study demonstrates that CBAM-based feature refinement and ConvNeXt-based feature extraction both contribute to the overlap-based segmentation performance of CU2-NeXt. The comparisons of individual modules, CBAM insertion locations, and ConvNeXt depth configurations also indicate that the effectiveness of these components depends on their architectural configuration. Overall, CU2-NeXt achieved the highest macro-F1, Dice, and IoU values while maintaining boundary-distance errors comparable to those of the baseline models, although it did not achieve the best HD or ASD.
Digitalization of ECG
The digital processing of ECG signals is a crucial step in enhancing the automation and repeatability of ECG signal analysis. In this study, after performing high-precision segmentation of ECG images based on the CU2-NeXt model, we further implemented the conversion process from images to numerical signals. To ensure consistency across different paper layouts, the digitization procedure identified the waveform regions corresponding to the 12 standard leads and extracted a 2.5-s short-duration segment from each lead. The additional long-duration rhythm strips displayed in the 13-lead and 15-lead layouts were not included in the standardized digitization analysis. This process first accurately locates the 12 lead regions in the image through automatic cropping and contour detection techniques, eliminating background noise and interference from non-signal areas, thereby extracting the independent signal regions for each lead. Subsequently, using the Viterbi Algorithm based on dynamic programming, the grayscale images of each lead were parsed into sequences and signal trajectories were reconstructed. Finally, a digital ECG waveform consistent with the original sampling rate was successfully generated (as shown in Figure 4B). This method effectively maintains the integrity of the waveform shape while effectively overcoming the interference caused by inconsistent image resolutions, slight distortions, and lead crossings.
To evaluate the accuracy of the digitized signals, we used the open-source Open-Source Electrophysiological Toolbox (OSET) to extract three clinically relevant intervals: the PR interval, reflecting atrioventricular conduction; QRS duration, reflecting ventricular depolarization; and the QT interval, encompassing ventricular depolarization and repolarization. These measurements were compared with the corresponding manually measured values from the original ECG images, as shown in Figure 4C-E.
For PR interval, 124 paired measurements were available. The MAE was 16.88 ms, the RMSE was 25.00 ms, and the Pearson correlation coefficient was 0.8787. Bland-Altman analysis yielded a bias of -7.57 ms and 95% limits of agreement from -54.46 to 39.32 ms. For QRS duration, 169 paired measurements were available; the MAE was 12.11 ms, the RMSE was 16.46 ms, and the Pearson correlation coefficient was 0.6724. The bias was 0.13 ms, with 95% limits of agreement from -32.23 to 32.49 ms. For QT interval, 169 paired measurements were available; the MAE was 21.84 ms, the RMSE was 32.53 ms, and the Pearson correlation coefficient was 0.8673. The bias was -7.09 ms, with 95% limits of agreement from -69.50 to 55.31 ms. Figure 4C-E shows the paired reference and digitized measurements, whereas the Bland-Altman summary statistics are reported in Supplementary Table 6. The International Electrotechnical Commission (IEC) 60601-2-25:2011 was considered only as an engineering reference and not as evidence of formal conformity or clinical interchangeability[30].
The interval comparisons indicate that measurable PR, QRS, and QT information was retained in the reconstructed signals in the present dataset. However, this analysis was intended as a technical assessment of waveform-information preservation and did not evaluate diagnostic accuracy, clinical decision-making, or interchangeability with native digital ECG recordings. Further validation using predefined clinical acceptance limits and external datasets is required before clinical application can be considered.
DISCUSSION
ECG images with low resolution and high noise levels remain a major obstacle to accurate paper-to-digital conversion, making image segmentation an important component of ECG digitization. A recent systematic review identified skew correction, binarization, grid removal, waveform extraction, and the lack of standardized datasets and evaluation metrics as persistent challenges in automatic paper-ECG digitization[8]. In this study, we developed an enhanced U-shaped architecture for segmenting curvilinear structures in scanned ECG images. The incorporation of ConvNeXt and CBAM blocks improved the principal overlap-based segmentation metrics compared with the evaluated baseline configurations, although CU2-NeXt did not achieve the best result for every boundary-distance metric. Interpretability analysis suggested that the symmetric encoder-decoder structure and multilevel skip connections enabled the model to capture geometric features of curvilinear ECG traces while directing attention toward waveform-related regions. However, these attention maps provide only qualitative evidence of the regions used by the model and should not be interpreted as a quantitative explanation of its predictions.
Large volumes of historical ECG records remain available only in paper form, and accurate separation of gridlines from waveform traces represents an important step in their digitization. Baydoun et al. reported a Matrix Laboratory (MATLAB)-based method that used region-of-interest detection, binarization, connected-component analysis, and interpolation to digitize 30 scanned ECGs, achieving more than 95% precision and high correlations for several standard ECG intervals[31]. In contrast, CU2-NeXt formulates waveform extraction as supervised segmentation and combines ConvNeXt-based feature extraction, CBAM-based attention refinement, and Viterbi-based trajectory reconstruction. This design reduces reliance on manually specified image-processing rules and supports waveform extraction from low-resolution, noisy ECG images. However, direct numerical comparison is not appropriate because the studies used different datasets, reference standards, and evaluation metrics. Accordingly, the present results demonstrate the technical feasibility of CU2-NeXt on the dataset evaluated in this study rather than superiority in routine clinical practice.
A strength of the proposed architecture is the combined use of CBAM attention and ConvNeXt blocks to refine waveform-related features and distinguish thin ECG traces from gridlines. The reconstructed signals also retained measurable waveform-interval information in the present evaluation. Nevertheless, the improvements were primarily observed in overlap-based metrics, including macro-F1, Dice coefficient, and IoU. CU2-NeXt did not consistently outperform U2-Net or U2-Net+CBAM in HD and ASD, indicating that improved overall mask overlap did not necessarily eliminate local boundary deviations. In addition, the increase in computational complexity relative to the original U2-Net should be considered when deploying the method in resource-constrained settings. The proposed architecture may provide a basis for other paper-ECG digitization tasks, but its applicability to different data sources and acquisition conditions requires further evaluation.
Although the improved CU2-NeXt model exhibits enhanced performance, it still has certain limitations. Specifically, CU2-NeXt may lose global contextual information from ECGs due to the local receptive field of the CBAM module. This can lead to information loss in tasks involving highly sparse signals with long-range spatial dependencies, such as ECG tracing. One potential solution is to incorporate multi-scale pooling in the spatial attention module of CBAM. Another unresolved challenge is the blurring of inflection points, which remains difficult for current segmentation methods. A promising direction could be the integration of an edge detection module during the decoder stage to enhance detail preservation around signal turning points.
The findings should be interpreted in light of the single-center design and limited sample size. The dataset consisted of 239 scanned ECG images obtained from 239 patients at the Chinese PLA General Hospital, with one ECG image per patient. Although the dataset included 12-lead, modified 15-lead, and partitioned 13-lead layouts, it may not fully represent the range of paper formats, grid colors and densities, printing quality, scanners, photographic acquisition conditions, image resolutions, waveform morphologies, and patient populations encountered at other institutions. The relatively small test set also limits the precision and stability of the reported performance estimates. No independent external dataset was available; therefore, the present study provides no direct evidence of cross-center generalizability. Validation using larger multicenter datasets acquired using different scanners, cameras, paper formats, lead layouts, and institutional workflows will be required before broader application can be considered.
The reference masks were initially generated with the assistance of an image-processing procedure and were subsequently reviewed and corrected by annotators. Although all 239 preliminary masks were manually checked, this assisted-labeling approach may still have introduced systematic bias, particularly if weak or ambiguous waveform pixels removed during preprocessing were underrepresented in the final masks. In six PDF-format records with accessible original digital signals, the preprocessing-generated masks achieved a Dice coefficient of 0.7847 ± 0.0473 and an IoU of 0.6478 ± 0.0647 relative to masks derived from the digital signals. This small supplementary comparison provides a limited consistency check but does not establish the validity of the reference standard for the full dataset. Accordingly, the overlap metrics reported in this study quantify agreement with the manually corrected study masks and should not be interpreted as absolute accuracy relative to device-exported digital ECG signals. Double annotation of 54 ECG images (22.6% of the dataset) yielded a Dice coefficient of 0.8306 ± 0.0148 and an IoU of 0.7105 ± 0.0216. Nevertheless, identification of thin, overlapping, weak, or interrupted ECG traces remains dependent on visual judgment, and residual annotation variability cannot be excluded. Future datasets should use independent annotation by multiple ECG experts, consensus adjudication of ambiguous regions, and, where available, device-exported digital signals as reference standards.
The evaluation of PR interval, QRS duration, and QT interval was intended to determine whether clinically relevant temporal information was retained after digitization, rather than to establish diagnostic equivalence with standard digital ECG recordings. The present study did not evaluate arrhythmia detection, conduction disorders, QT prolongation, ST-segment and T-wave (ST-T) abnormalities, clinical decision-making, or patient outcomes. It also did not assess whether digitization errors could change a clinical classification near a diagnostic threshold. Differences in QRS and QT measurements may arise from image quality, lead selection, waveform morphology, sampling resolution, and uncertainty in determining waveform onset and offset.
Clinically acceptable error margins depend on the intended use, the reference measurement protocol, and whether a value is close to a diagnostic or therapeutic threshold. As an engineering reference for computerized electrocardiographs, IEC 60601-2-25 includes commonly referenced mean-difference limits of approximately ±10 ms for QRS duration and ±25 ms for QT interval, together with criteria for measurement variability[30]. In the present study, the mean biases for QRS duration (0.13 ms) and QT interval (-7.09 ms) were within these mean-difference ranges. However, the corresponding 95% limits of agreement were -32.23 to 32.49 ms for QRS duration and -69.50 to 55.31 ms for QT interval, indicating that individual measurement differences could be substantially larger than the mean biases. Moreover, IEC equipment-level criteria cannot be directly applied to establish clinical interchangeability between reconstructed paper ECGs and natively acquired digital ECGs. Because application-specific equivalence margins were not predefined, the observed agreement should not be interpreted as clinical validation. Future studies should prospectively define acceptance margins, evaluate measurements near clinically relevant thresholds, and use cardiologist-adjudicated reference measurements in independent external cohorts.
Taken together, CU2-NeXt showed promising technical performance for ECG signal extraction from scanned paper records in the present dataset. Its use beyond this experimental setting will require larger multicenter cohorts, independent external validation, prospectively defined measurement-acceptance criteria, and direct evaluation of diagnostic performance in clinically representative workflows.
DECLARATIONS
Acknowledgments
The authors sincerely thank the staff from the Chinese PLA General Hospital for providing the data used in this study.
Authors’ contributions
Full access to all data and oversaw all analyses: Deng F, Kong D, Song X, Ren Y, Lou Z, Wang L
Designed the research: Deng F, Xu H, Li Z, Kong D, Lou Z, Wang L
Wrote the paper: Deng F, Wang L
Responsible for data engineering and preprocessing. Deng F, Xu H, Li Z, Ren Y
Supervised dataset creation and annotation: Deng F, Qin X, Xu H
Interpreted the results: Deng F, Xu H, Li Z, Song X
Revised the paper: Xu H, Li Z, Lou Z, Wang L
Supervised the project: Lou Z, Wang L
All authors substantially contributed to the research and reviewed the manuscript.
Availability of data and materials
The ECG data used in this study cannot be shared publicly due to privacy restrictions. The code for running the model is available from the corresponding authors with detailed explanations upon reasonable request.
AI and AI-assisted tools statement
During the preparation of this manuscript, the AI tool ChatGPT (version 5.6, released 2026-07-09) was used solely for language editing. The tool did not influence the study design, data collection, analysis, interpretation, or the scientific content of the work. All authors take full responsibility for the accuracy, integrity, and final content of the manuscript.
Financial support and sponsorship
This work was supported by Beijing Natural Science Foundation-Xiaomi Innovation Joint Fund (L233009).
Conflicts of interest
Song X serves as the Guest Editor of the Special Issue “Artificial Intelligence in Cardiovascular Aging and Disease” of The Journal of Cardiovascular Aging. He was not involved in any step of the editorial processing of this manuscript, including reviewer selection, manuscript handling, or decision-making. The remaining authors declare that they have no conflicts of interest.
Ethical approval and consent to participate
This retrospective study used stored paper-based ECG records from the Chinese PLA General Hospital. The Medical Ethics Committee of the Chinese PLA General Hospital assessed the study and determined that it was exempt from further medical ethics review; no separate ethics approval number was assigned to the exemption. Under this exemption, individual informed consent was not required because the study involved retrospective analysis of existing records, no direct patient contact, no clinical intervention, and no additional examination. Before analysis, identifiers visible on the ECG records, including patient names, medical record numbers, barcodes, and examination dates, were removed or masked. Only de-identified ECG images were available to the research team for model development and evaluation.
Consent for publication
Not applicable.
Copyright
© The Author(s) 2026.
Supplementary Materials
REFERENCES
1. Roth GA, Abate D, Abate KH, et al. Global, regional, and national age-sex-specific mortality for 282 causes of death in 195 countries and territories, 1980-2017: a systematic analysis for the global burden of disease study 2017. Lancet. 2018;392:1736-88.
3. Attia ZI, Harmon DM, Dugan J, et al. Prospective evaluation of smartwatch-enabled detection of left ventricular dysfunction. Nat Med. 2022;28:2497-503.
4. Holst H, Ohlsson M, Peterson C, Edenbrandt L. A confident decision support system for interpreting electrocardiograms. Clin Physiol. 1999;19:410-8.
6. Belforte G, De Mori R, Ferraris F. A contribution to the automatic processing of electrocardiograms using syntactic methods. IEEE Trans Biomed Eng. 1979;26:125-36.
7. Raghunath S, Ulloa Cerna AE, Jing L, et al. Prediction of mortality from 12-lead electrocardiogram voltage data using a deep neural network. Nat Med. 2020;26:886-91.
8. Lence A, Extramiana F, Fall A, Salem JE, Zucker JD, Prifti E. Automatic digitization of paper electrocardiograms - a systematic review. J Electrocardiol. 2023;80:125-32.
9. Poterucha TJ, Jing L, Ricart RP, et al. Detecting structural heart disease from electrocardiograms using AI. Nature. 2025;644:221-30.
10. Al-Zaiti SS, Martin-Gill C, Zègre-Hemsey JK, et al. Machine learning for ECG diagnosis and risk stratification of occlusion myocardial infarction. Nat Med. 2023;29:1804-13.
11. Attia ZI, Harmon DM, Behr ER, Friedman PA. Application of artificial intelligence to the electrocardiogram. Eur Heart J. 2021;42:4717-30.
12. Siontis KC, Noseworthy PA, Attia ZI, Friedman PA. Artificial intelligence-enhanced electrocardiography in cardiovascular disease management. Nat Rev Cardiol. 2021;18:465-78.
13. Kligfield P, Badilini F, Brown B, Helfenbein E, Kohls M. The ISCE ECG genome pilot challenge: a 2004 progress report. J Electrocardiol. 2004;37 Suppl:144-8.
14. Stockbridge N. Points to consider in electrocardiogram waveform extraction. J Electrocardiol. 2005;38:319-20.
15. Badilini F, Erdem T, Zareba W, Moss AJ. ECGScan: a method for conversion of paper electrocardiographic printouts to digital electrocardiographic files. J Electrocardiol. 2005;38:310-8.
16. Wu H, Patel KHK, Li X, et al. A fully-automated paper ECG digitisation algorithm using deep learning. Sci Rep. 2022;12:20963.
17. Randazzo V, Puleo E, Paviglianiti A, Vallan A, Pasero E. Development and validation of an algorithm for the digitization of ECG paper images. Sensors. 2022;22:7138.
18. Wang T, Wang YQ, Chang ZS, Lyu X, Huang ZP, Qin F. A fully-automated paper ECG digitisation algorithm for e-health applications. In: 2024 16th International Conference on Wireless Communications and Signal Processing (WCSP); 2024 Oct 24-26; Hefei, China. IEEE; 2024. pp. 1295-300.
19. Ganesh S, Bhatti PT, Alkhalaf M, Gupta S, Shah AJ, Tridandapani S. Combining optical character recognition with paper ECG digitization. IEEE J Transl Eng Health Med. 2021;9:1900309.
20. Li Y, Qu Q, Wang M, et al. Deep learning for digitizing highly noisy paper-based ECG records. Comput Biol Med. 2020;127:104077.
21. Patil R, Narkhede B, Varma S, Suraliya S, Mehendale N. Auto lead extraction and digitization of ECG paper records using cGAN. ArXiv. 2022;arXiv:2211.06720.
22. Shivashankara KK, Deepanshi, Shervedani AM, Clifford GD, Reyna MA, Sameni R. ECG-Image-Kit: a synthetic image generation toolbox to facilitate deep learning-based electrocardiogram digitization. Physiol Meas. 2024;45:055019.
23. Reyna MA, Deepanshi, Weigle J, et al. Ecg-image-database: a dataset of ecg images with real-world imaging and scanning artifacts; a foundation for computerized ecg image digitization and analysis. ArXiv. 2024;arXiv:2409.16612.
24. Fortune JD, Coppa NE, Haq KT, Patel H, Tereshchenko LG. Digitizing ECG image: a new method and open-source software code. Comput Methods Programs Biomed. 2022;221:106890.
25. Qin X, Zhang Z, Huang C, Dehghan M, Zaiane OR, Jagersand M. U2-Net: going deeper with nested U-structure for salient object detection. Pattern Recognition. 2020;106:107404.
26. Liu Z, Mao H, Wu CY, Feichtenhofer C, Darrell T, Xie SN. A ConvNet for the 2020s. In: 2022 IEEE/CVF Conference on Computer Vision and Pattern Recognition (CVPR); 2022 Jun 18-24; New Orleans, LA, USA. IEEE; 2022. pp. 11966-76.
27. Woo S, Park J, Lee JY, Kweon IS. CBAM: convolutional block attention module. In: Ferrari V, Hebert M, Sminchisescu C, Weiss Y, Editors. Computer Vision - ECCV 2018: 15th European Conference; 2018 Sep 8-14; Munich, Germany. Springer, Cham; 2018. pp. 3-19.
28. Lin TY, Goyal P, Girshick R, He K, Dollár P. Focal loss for dense object detection. In: 2017 IEEE International Conference on Computer Vision (ICCV); 2017 Oct 22-29; Venice, Italy. IEEE; 2017. pp. 2999-3007.
29. Milletari F, Navab N, Ahmadi SA. V-net: fully convolutional neural networks for volumetric medical image segmentation. In: 2016 fourth international conference on 3D vision (3DV); 2016 Oct 25-28; Stanford, CA, USA. IEEE; 2016. pp. 565-71.
30. International Electrotechnical Commission. IEC 60601-2-25:2011. Medical electrical equipment - Part 2-25: Particular requirements for the basic safety and essential performance of electrocardiographs. 2nd ed. Geneva: International Electrotechnical Commission; 2011. Available from: https://webstore.iec.ch/en/publication/2636 [accessed 18 July 2026].
Cite This Article
 Open Access
How to Cite
Deng F, Xu H, Li Z, Qin X, Lou Z, Song X, Wang L, Kong D, Ren Y. Clinical electrocardiogram digitization based on U2Net. J Cardiovasc Aging. 2026;6:43. https://dx.doi.org/10.20517/jca.2026.45
Download Citation
If you have the appropriate software installed, you can download article citation data to the citation manager of your choice. Simply select your manager software from the list below and click on download.
Export Citation File
Type of Import
Tips on Downloading Citation
Citation Manager File Format
Type of Import
Direct Import: When the Direct Import option is selected (the default state), a dialogue box will give you the option to Save or Open the downloaded citation data. Choosing Open will either launch your citation manager or give you a choice of applications with which to use the metadata. The Save option saves the file locally for later use.
Indirect Import: When the Indirect Import option is selected, the metadata is displayed and may be copied and pasted as needed.
About This Article
Special Topic
Copyright

Data & Comments
Data
0











Comments
Comments must be written in English. Spam, offensive content, impersonation, and private information will not be permitted. If any comment is reported and identified as inappropriate content by OAE staff, the comment will be removed without notice. If you have any queries or need any help, please contact us at [email protected].