

fig2
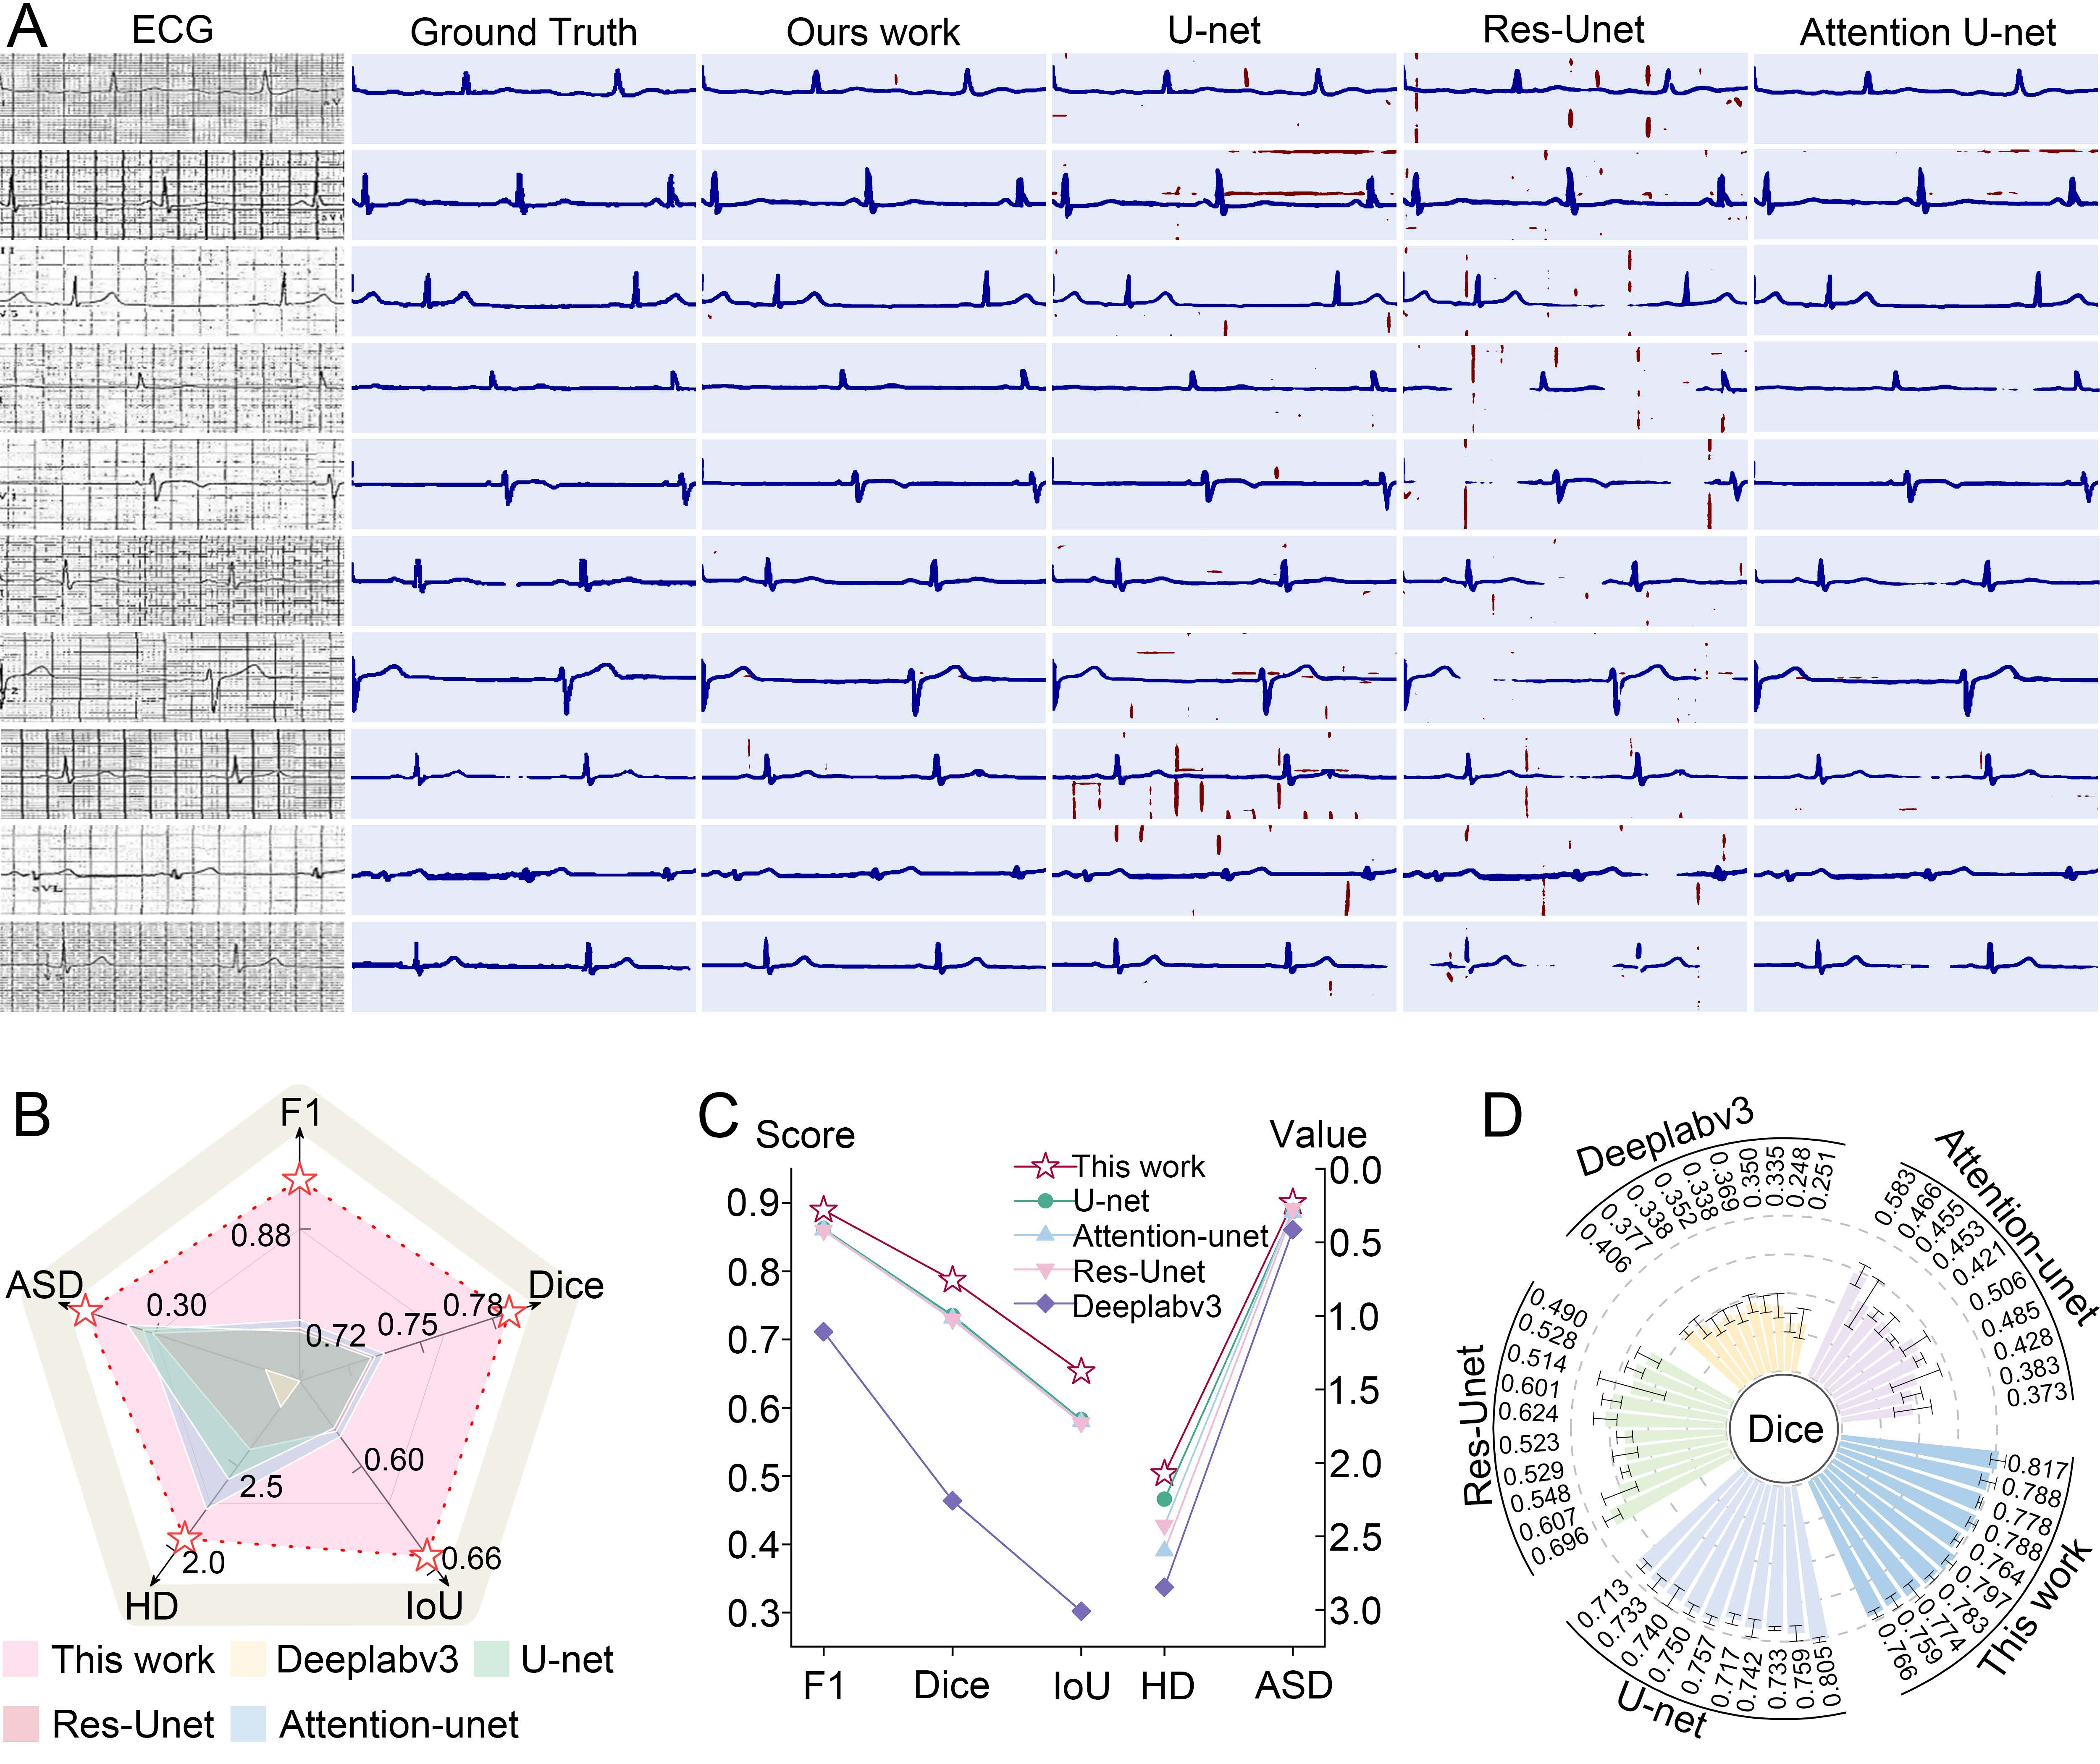
Figure 2. Analysis of the segmentation experiment results on ECG data. (A) Representative ECG segmentation results showing the manually corrected reference masks and outputs of the evaluated models; (B) Radar plot showing validation-set performance during model development, including macro-F1, Dice coefficient, IoU, HD, and ASD; (C) Line plot summarizing the same validation-set metrics. Higher macro-F1, Dice coefficient, and IoU indicate better overlap-based segmentation performance, whereas lower HD and ASD indicate better boundary agreement; (D) Dice coefficient evaluation on the test set ECG data with varied paper formats. Dice coefficients were first calculated at the image level. For visualization, the 50 images were randomly divided into 10 groups with 5 images per group. Each bar represents the group mean Dice coefficient, and error bars indicate the standard deviation within each group. This subset was not used for model training, model selection, hyperparameter tuning, or ablation experiments. Statistical comparisons between CU2-NeXt and the baseline models were performed using paired image-level data from all 50 images before grouping. Mean paired differences and 95% confidence intervals were estimated by paired bootstrap resampling. Two-sided Wilcoxon signed-rank tests were used, with Holm-Bonferroni correction within each baseline comparison across macro-F1, Dice coefficient, and IoU; adjusted P < 0.05 was considered statistically significant. ECG: Electrocardiogram; HD: hausdorff distance; ASD: average surface distance; IoU: intersection over union.




