

fig3
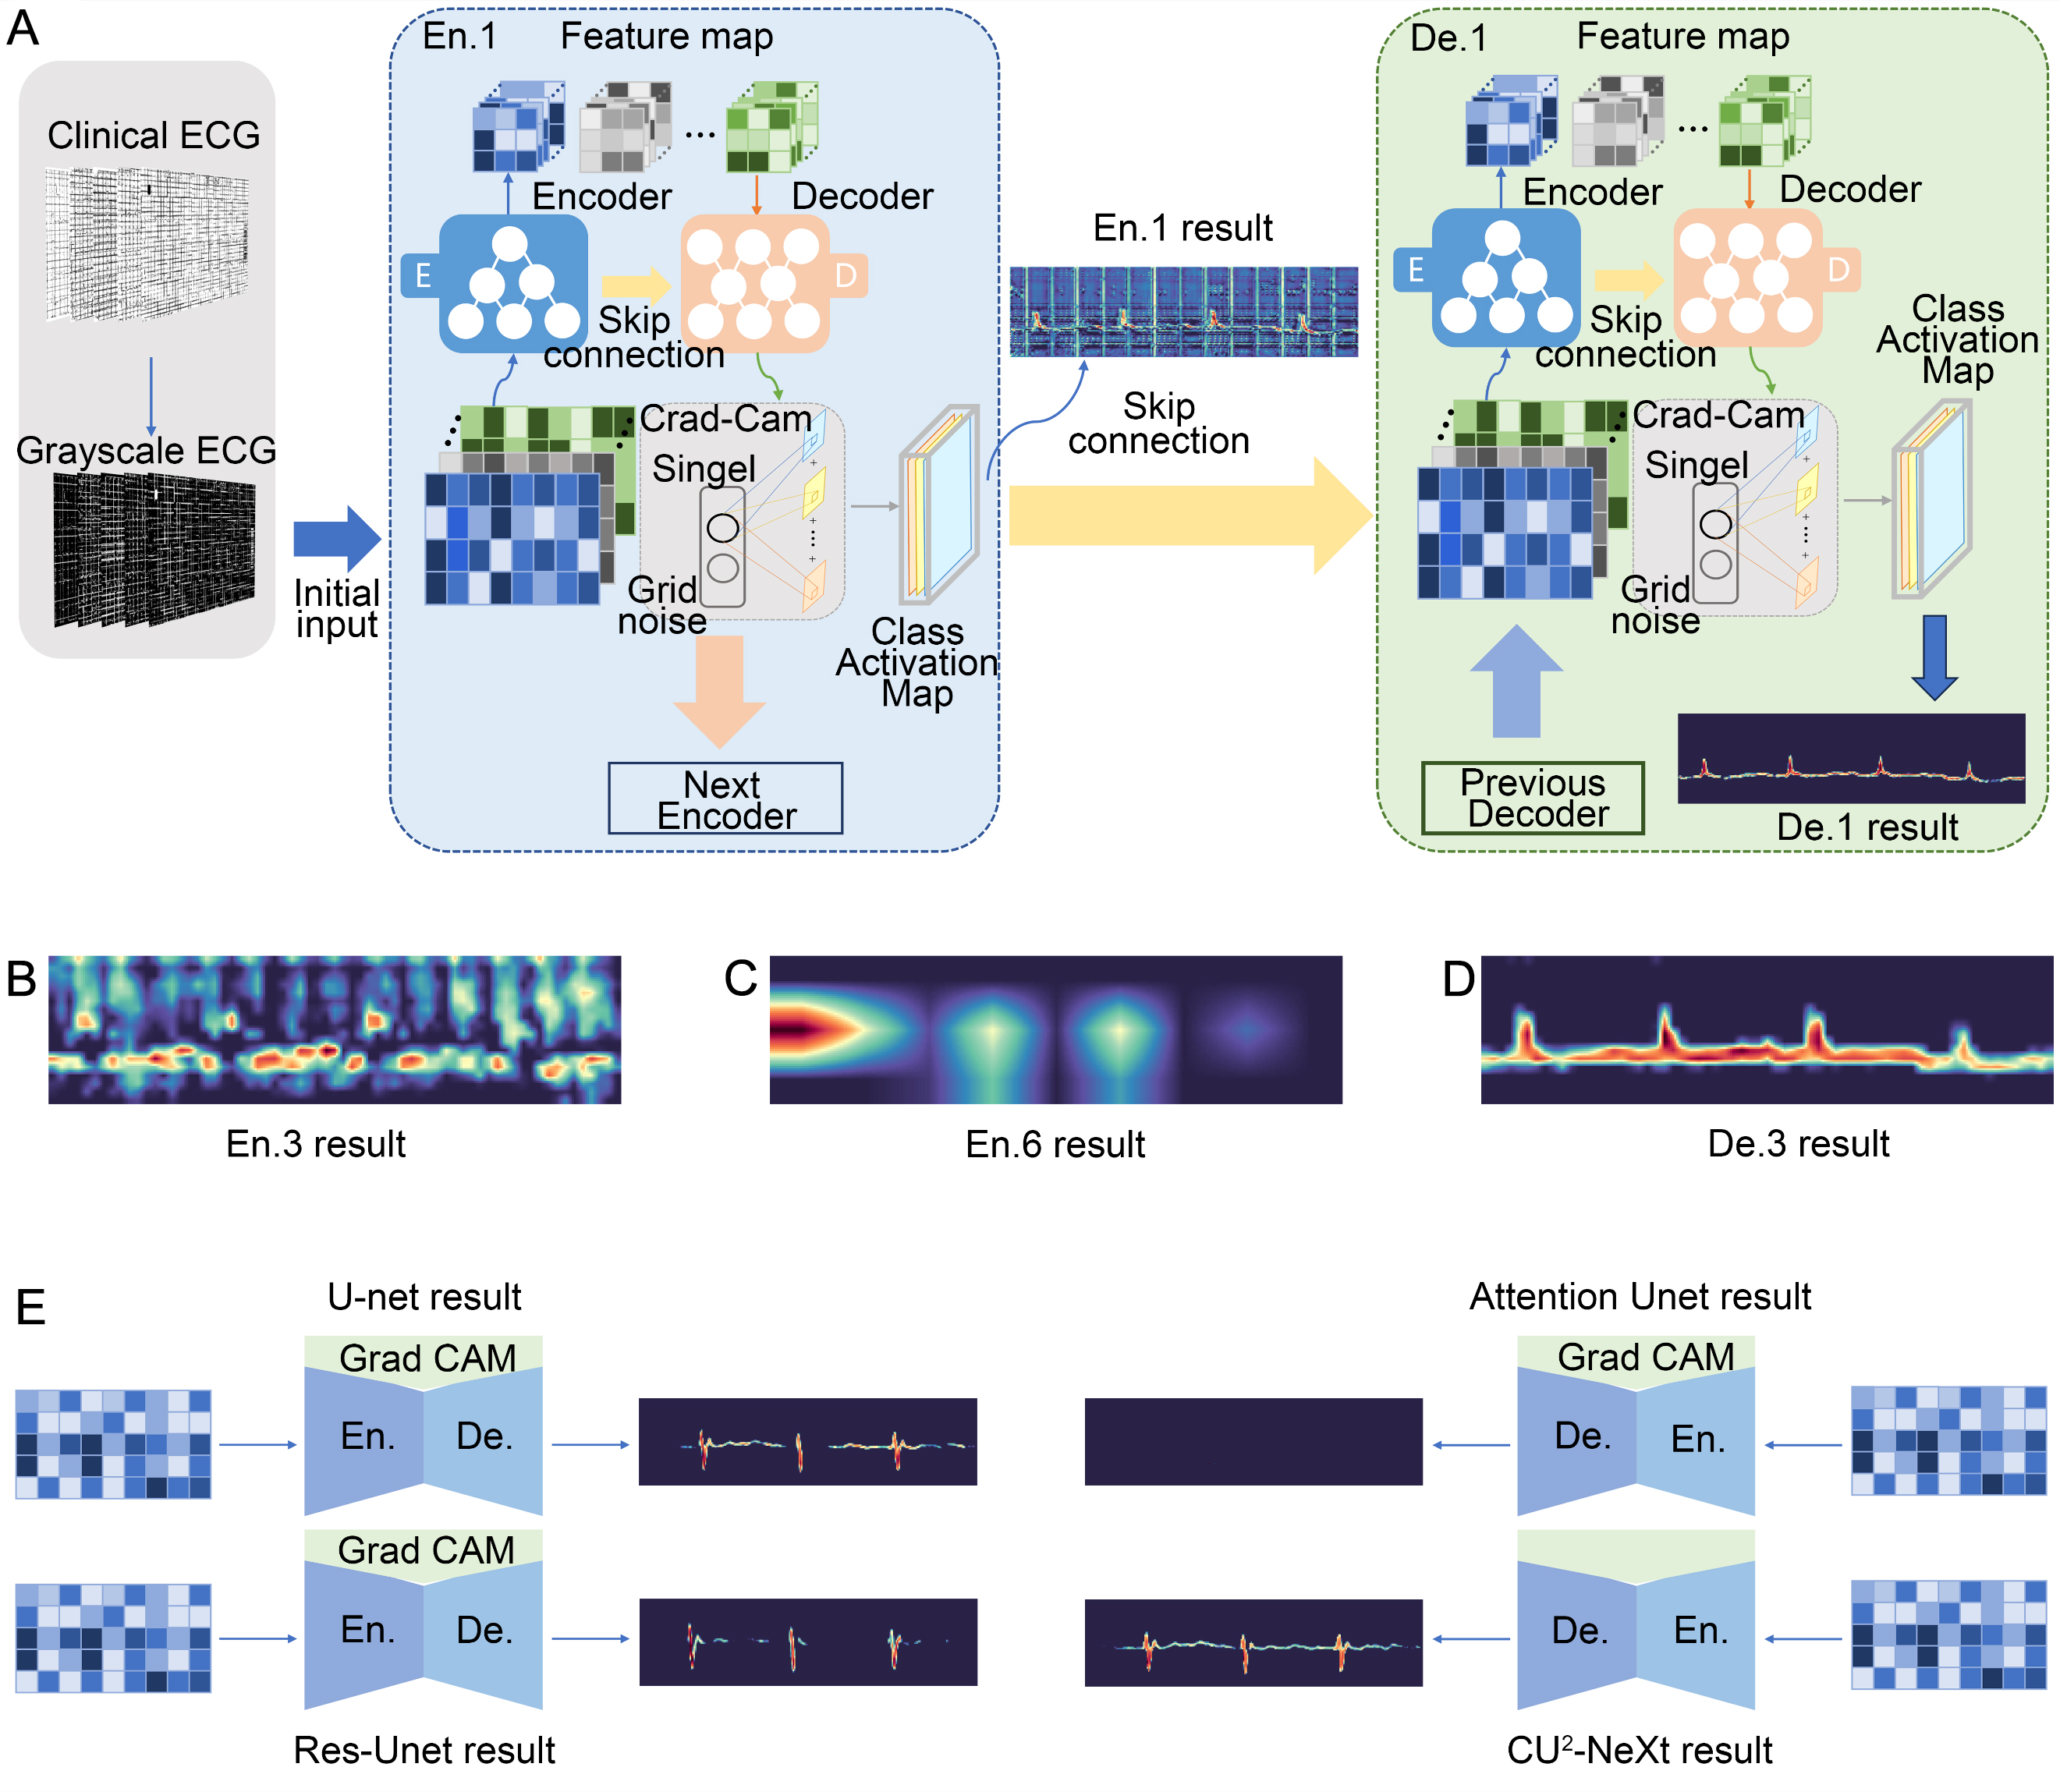
Figure 3. Grad-CAM visualization of feature responses in CU2-NeXt. (A) Overview of the visualization workflow; (B-D) Grad-CAM maps from Encoder 3, Encoder 6, and Decoder 3, respectively; warmer colors indicate greater relative positive contributions to the foreground ECG-trace output; (E) Qualitative comparison of Grad-CAM maps from CU2-NeXt and the baseline models under the same visualization settings. ECG: Electrocardiogram; Grad-CAM: gradient-weighted class activation mapping.




