

fig4
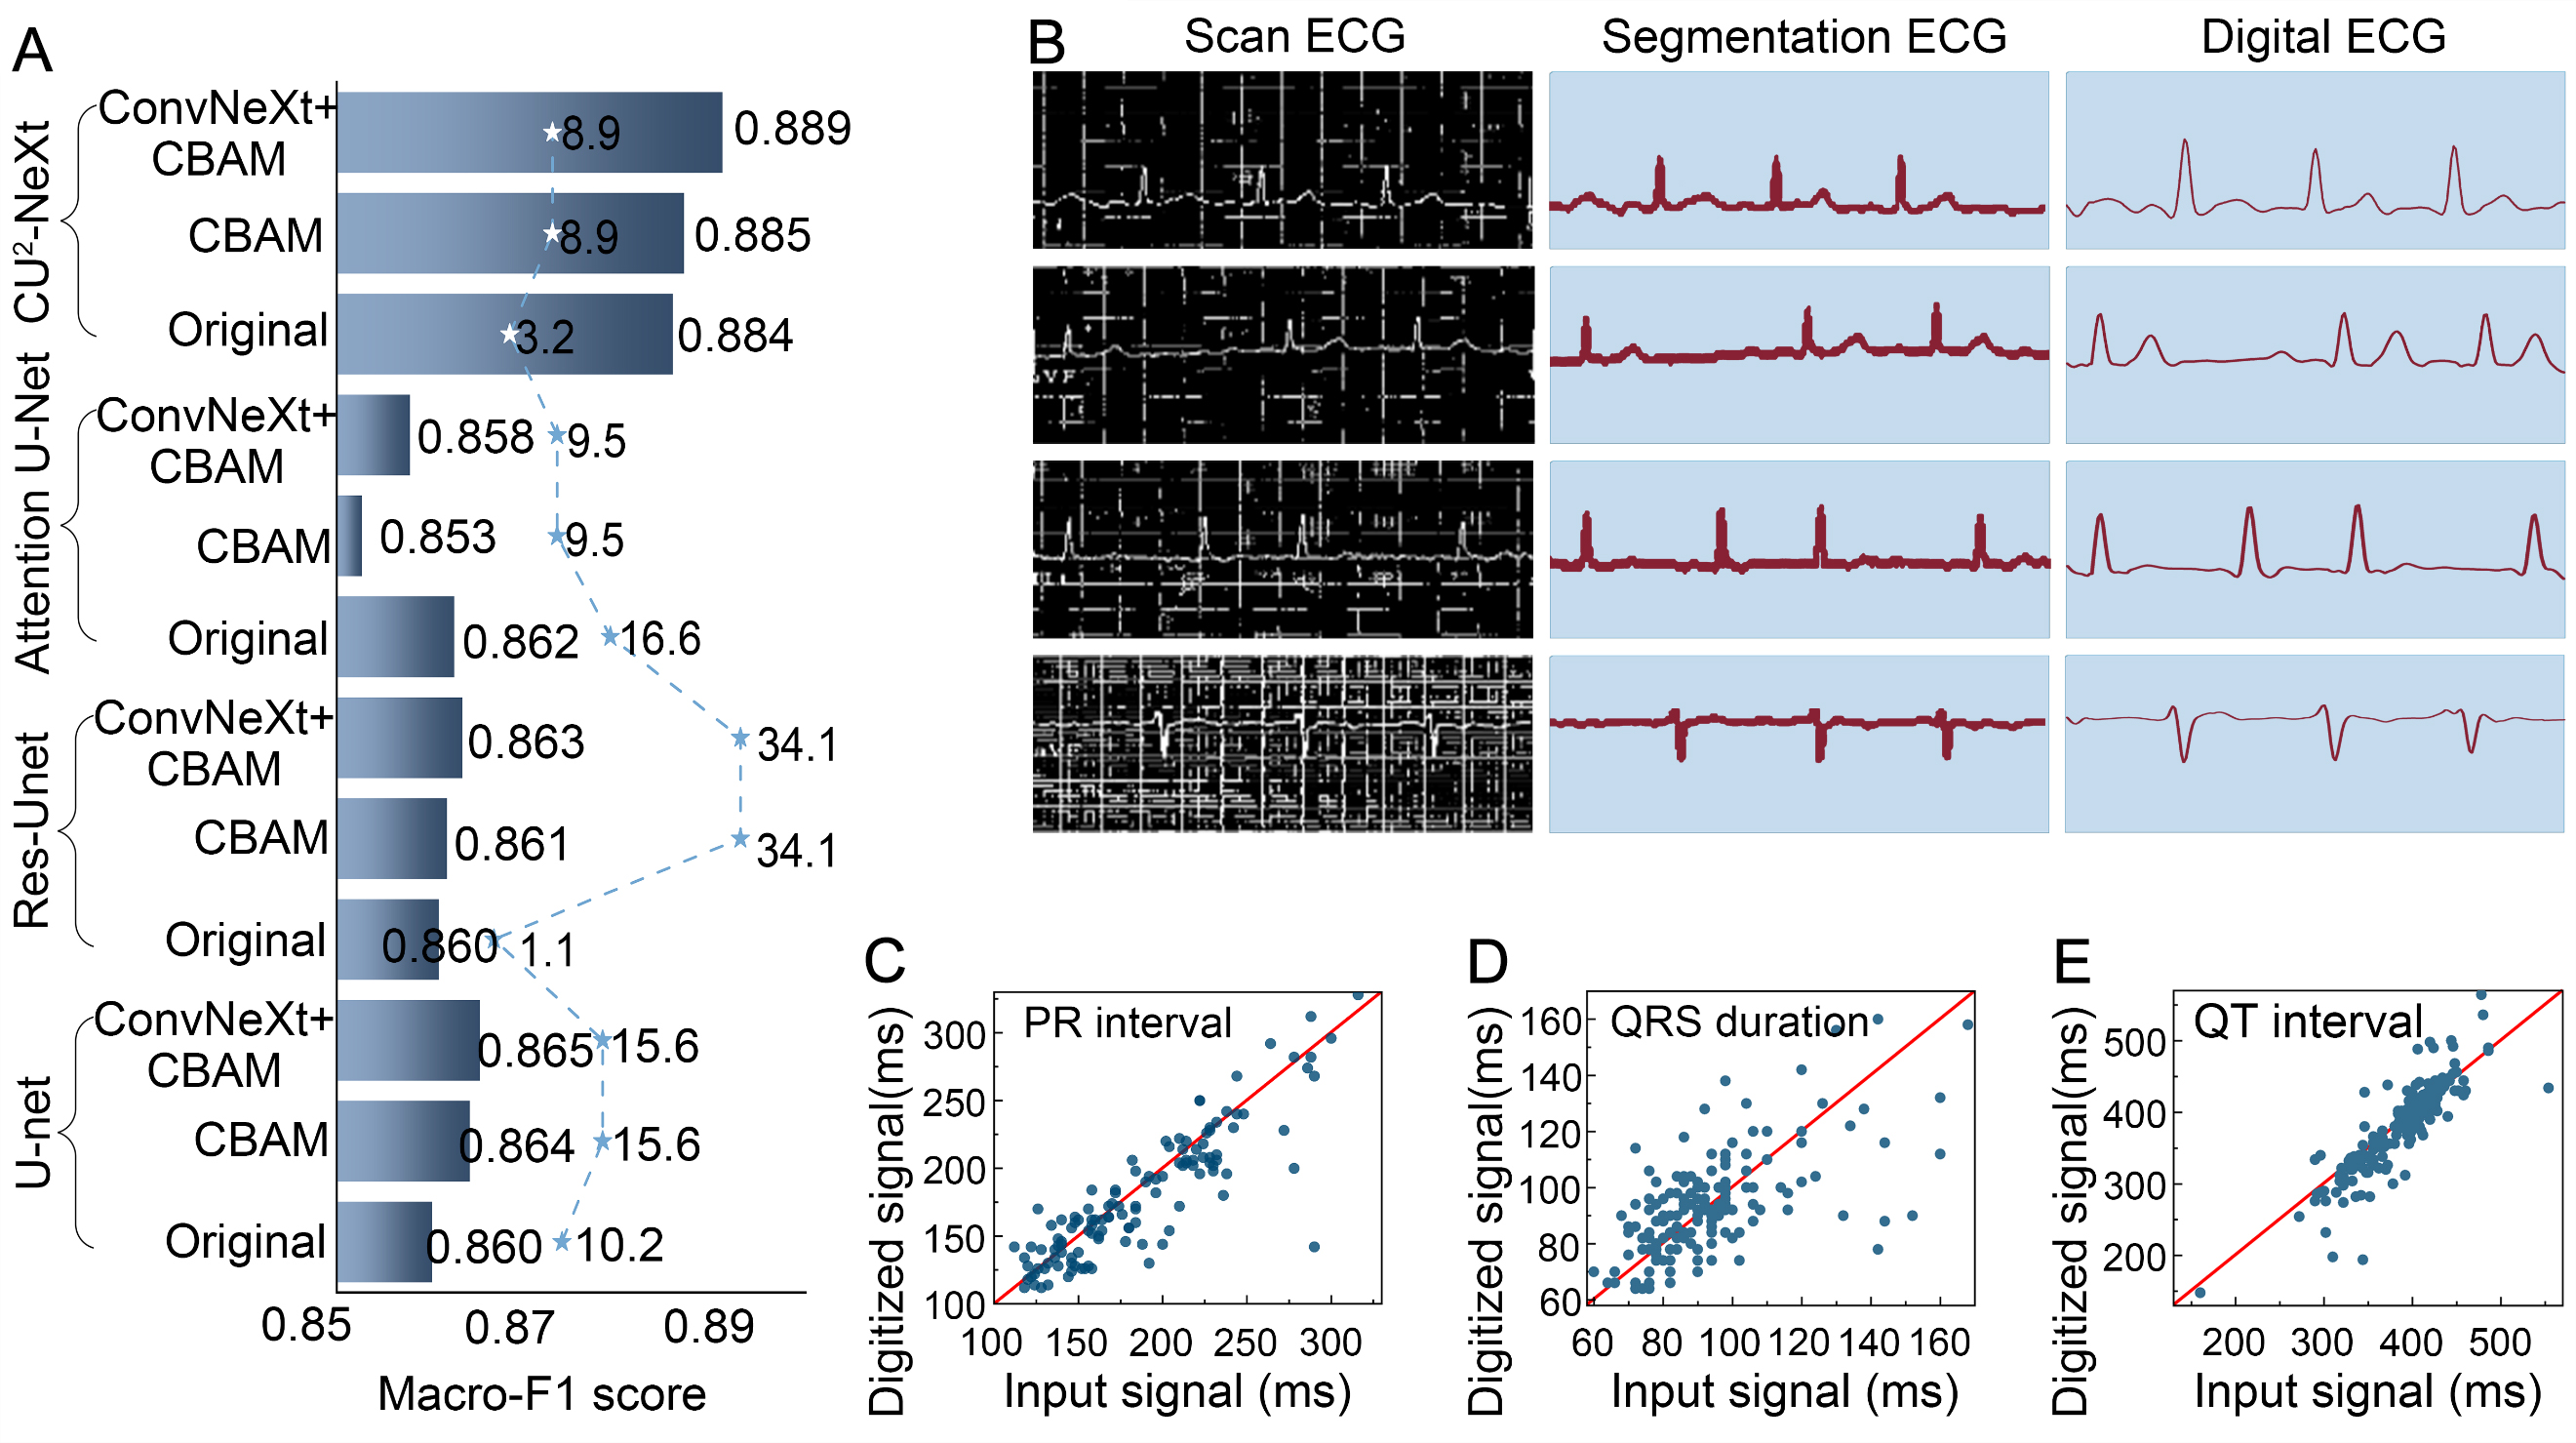
Figure 4. (A) Macro-F1 scores obtained from the 189-image development dataset and computational complexity of the evaluated architectural variants. Horizontal bars indicate the mean macro-F1 score calculated from the binarized segmentation results using a threshold of 0.5. Macro-F1 was defined as the unweighted mean of the F1-scores for the ECG waveform and background classes. The dashed line with star markers shows GFLOPs for one forward pass of a single ECG image; the markers do not indicate error bars or statistical significance; (B) Comparison of digitization results and model segmentation results. Left: Original gray-scale ECG, middle: Binary graph of model segmentation results, right: Digital ECG; (C) Agreement analysis of the PR interval between the digitized ECG signals and the manually measured values from the original ECG images; (D) Agreement analysis of the QRS duration between the digitized ECG signals and the manually measured values from the original ECG images; (E) Agreement analysis of the QT interval between the digitized ECG signals and the manually measured values from the original ECG images. ECG: Electrocardiogram; GFLOPs: giga floating point operations per second; CBAM: convolutional block attention module; QRS: the ventricular depolarization complex composed of the Q, R, and S waves; QT: the interval from the onset of the QRS complex to the end of the T wave; PR: the interval from the onset of the P wave to the onset of the QRS complex.




