


Machine learning model predicting new-onset acute kidney injury in fulminant myocarditis
 0
0 Abstract
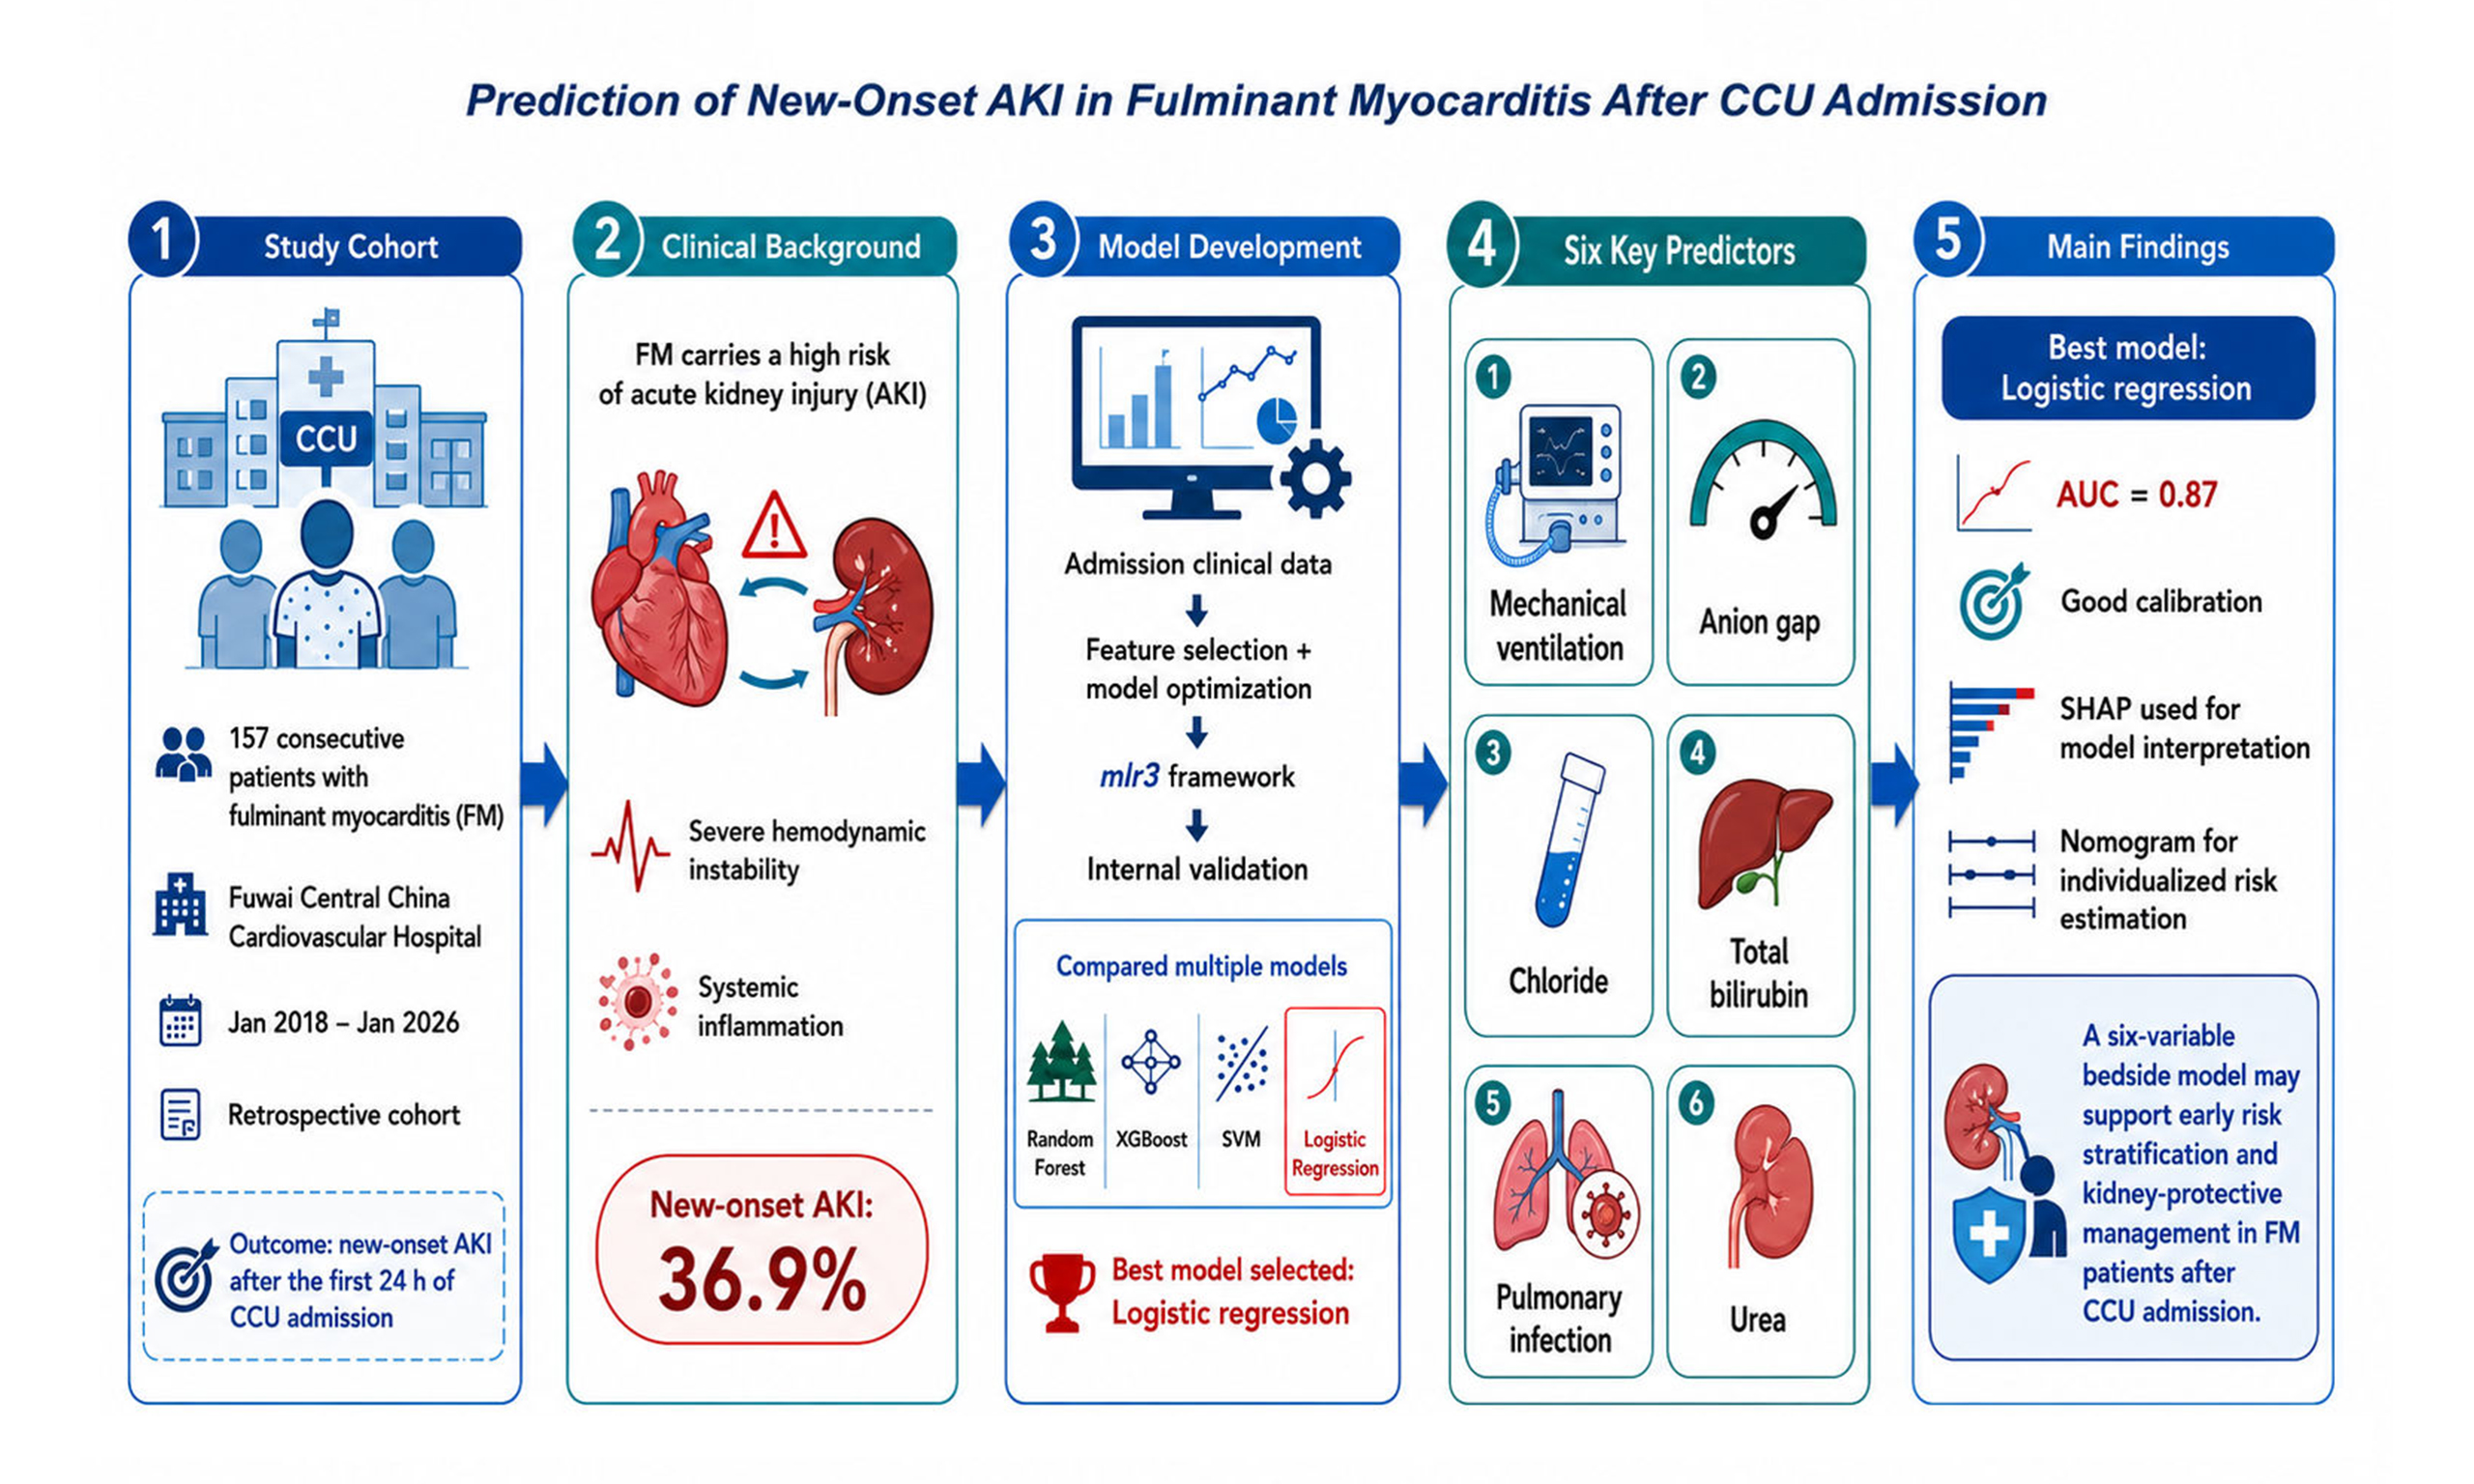
Aim: To develop and validate a SHapley additive exPlanations (SHAP)-interpretable machine learning (ML) model for predicting new-onset Acute kidney injury (AKI) after coronary care unit (CCU) admission in patients with Fulminant myocarditis (FM).
Methods: This retrospective cohort study included 157 consecutive patients with FM admitted to the CCU of Fuwai Central China Cardiovascular Hospital between January 2018 and January 2026. Admission clinical data were used for model development and internal validation. ML models were constructed, with feature selection and model optimization performed within the mlr3 framework.
Results: New-onset AKI occurred in 36.9% of patients after CCU admission. Among the evaluated models, logistic regression showed the best overall performance, with an area under the receiver operating characteristic curve of 0.87 and good calibration. Internal validation using 1,000 bootstrap resampling iterations confirmed the robustness of model discrimination, calibration, and clinical utility. Sensitivity analyses further supported the stability of the findings. SHAP analysis identified mechanical ventilation as having the greatest relative impact on model predictions, followed by anion gap, chloride, total bilirubin, pulmonary infection, and urea. Based on these six predictors, a nomogram was developed for individualized estimation of AKI risk.
Conclusion: A six-variable bedside prediction model demonstrated good discrimination and calibration for predicting new-onset AKI after CCU admission in patients with FM. The model may assist early risk stratification and support renal-protective management. Given the retrospective observational design, the selected predictors should be interpreted as predictive markers rather than causal determinants of AKI.
Keywords
INTRODUCTION
Fulminant myocarditis (FM) is a severe clinical phenotype within the myocarditis spectrum, characterized by acute onset, rapid progression, and critical illness. Myocarditis is an inflammatory myocardial disease caused by various non-ischemic stimuli and is associated with marked heterogeneity in clinical presentation and prognosis[1]. Persistent myocardial inflammation may lead to adverse cardiac remodeling and, in some patients, progression to inflammatory cardiomyopathy or dilated cardiomyopathy[2]. Patients with FM may rapidly develop acute heart failure, malignant ventricular arrhythmias, hemodynamic instability, or even cardiogenic shock, often requiring admission to a coronary care unit (CCU) for intensive monitoring and advanced life support[3]. Despite advances in diagnostic strategies, mechanical circulatory support, and contemporary critical care, FM remains associated with substantial short- and long-term risks of death or heart transplantation[4]. Acute kidney injury (AKI) is also a common complication among hospitalized patients, occurring in approximately 10%-15% of patients in general wards[5] and up to 50%-60% of critically ill patients[6]. Once AKI occurs, it is associated with increased healthcare costs, prolonged hospitalization, and higher morbidity and mortality[7-9]. Moreover, the duration of AKI and the pattern of renal recovery are closely related to subsequent clinical outcomes[10]. Although factors such as age, comorbidity burden, baseline kidney function, and proteinuria have been associated with renal recovery after AKI[11,12], reliable tools for the early prediction of new-onset AKI after CCU admission in patients with FM remain limited. Given the frequent coexistence of hemodynamic instability, systemic inflammation, vasoactive drug use, nephrotoxic exposure, and complex fluid management in FM, timely identification of patients at high risk for AKI is clinically important.
Machine learning (ML) can integrate multidimensional clinical information and capture complex non-linear relationships and interactions among variables, providing a potential approach for improving AKI risk prediction in patients with FM. Previous studies have shown that ML-based methods can support the early prediction of AKI in hospitalized patients[13]. In patients with FM, routinely available clinical data obtained early after CCU admission may contain important information related to subsequent AKI development, thereby enabling risk assessment before overt renal deterioration occurs. However, the limited interpretability of some ML models may restrict their clinical application. SHapley Additive exPlanations (SHAP) can quantify the contribution of each variable to model predictions and provide both global and individual-level explanations, thereby improving model transparency and clinical interpretability[14].
Therefore, this study aimed to develop and compare multiple ML-based predictive models using early clinical data from patients with FM admitted to the CCU, in order to estimate the risk of new-onset AKI after CCU admission. We further performed internal validation and sensitivity analyses of the optimal model, assessed its discrimination, calibration, and clinical utility, and applied SHAP-based interpretability analysis to identify key variables with substantial contributions to model predictions, with the goal of supporting early risk stratification and clinical decision-making in this high-risk population.
MATERIALS AND METHODS
Study population and participant selection
This retrospective cohort study was conducted at Fuwai Central China Cardiovascular Hospital. Between January 2018 and January 2026, a total of 157 consecutive patients diagnosed with FM who were hospitalized at our center were included in this study.
The diagnosis of FM was established according to the Chinese Society of Cardiology guidelines on the diagnosis and treatment of adult FM[15]. Patients were eligible for inclusion if they had a confirmed diagnosis of FM and available major early admission clinical data required for subsequent analyses.
Patients were excluded if critical baseline variables or outcome data were missing, or if they had pre-existing end-stage renal disease requiring chronic renal replacement therapy prior to CCU admission.
The study protocol was reviewed and approved by the Ethics Committee for Scientific Research, New Technologies and New Services of Fuwai Central China Cardiovascular Hospital (Approval No. 2026-Lun-23) and was conducted in accordance with the Declaration of Helsinki. Given the retrospective nature of the study, the use of anonymized clinical data, and the absence of any additional patient contact or intervention, the requirement for informed consent was waived by the ethics committee.
Definition of new-onset AKI
New-onset AKI was defined according to the Kidney Disease: Improving Global Outcomes (KDIGO) criteria[16]. Patients were classified as having new-onset AKI if they initially fulfilled KDIGO AKI criteria beyond the first 24 h after CCU admission, based on any of the following: (1) increase in serum creatinine (SCr) of ≥ 0.3 mg/dL within 48 h; (2) increase in SCr to ≥ 1.5 times baseline within 7 days; or (3) urine output < 0.5 mL/kg/h for at least 6 h[16]. Patients meeting AKI criteria within the first 24 h post-CCU admission were not considered as having new-onset AKI for the primary outcome. The primary outcome was defined as the development of new-onset AKI occurring after the initial 24 h of CCU admission.
Baseline characteristics and variable coding
Baseline characteristics were selected based on routine availability during the early CCU period, clinical relevance to AKI risk, and availability before AKI onset. All selected variables were obtained from clinical records within the first 24 h after CCU admission, before the assessment window for new-onset AKI, to support early individualized risk assessment. Demographic and anthropometric variables included age, sex, and body mass index (BMI). Presenting symptoms were documented and coded as symptoms (ranging from 0-6). Vital signs recorded at admission comprised heart rate, systolic blood pressure (SBP), diastolic blood pressure (DBP), respiratory rate, and body temperature.
Laboratory measurements included hematological parameters (white blood cell [WBC], red blood cell [RBC], platelet count, neutrophils, lymphocytes, red cell distribution width [RDW], hemoglobin, hematocrit), inflammatory markers (C-reactive protein [CRP]), electrolytes and metabolic indices (sodium, potassium, calcium, chloride, glucose, anion gap, lactate), liver-associated biomarkers (alanine aminotransferase [ALT], aspartate aminotransferase [AST], total bilirubin), lipid profile (triglycerides, total cholesterol, LDL-cholesterol [LDL-C], HDL-cholesterol [HDL-C]), cardiac biomarkers (creatine kinase-MB [CK-MB], B-type natriuretic peptide [BNP]), and baseline renal function markers, defined as urea and SCr measured within the first 24 h after CCU admission and before the assessment window for new-onset AKI. Cardiac systolic function was assessed by ejection fraction (EF) at admission.
Comorbidities and clinical conditions documented within the first 24 h after CCU admission included hypertension, diabetes, coronary heart disease, and pulmonary infection. Pulmonary infection was defined according to standardized ICD-10-coded clinical records and routine clinical documentation available within this early 24-h window. Treatment-related variables included the use of vasoactive agents, mechanical circulatory support, pacemaker insertion, and mechanical ventilation, all of which were extracted only if documented within the first 24 h after CCU admission. Mechanical ventilation referred to documented use of invasive or non-invasive ventilatory support during this early 24-h window, rather than during the entire CCU stay.
To facilitate modeling, several categorical variables were derived and standardized. First, the variable symptoms was converted into a composite variable (symptom_code), categorized into five symptom groups: fever (1), chest tightness or chest pain (2), syncope or loss of consciousness (3), poor appetite or fatigue (4), and diarrhea (5). If two or more symptom groups were present, symptom_code was assigned a value of 6; if no symptoms were present, it was set to 0.
Second, vasoactive therapy exposure was summarized as vasoactive_count (ranging from 0-3), indicating the number of vasoactive agents administered among norepinephrine, dopamine, and metaraminol (0 = none;
Third, mechanical circulatory support was recoded based on the provision of intra-aortic balloon pump (IABP) and/or extracorporeal membrane oxygenation (ECMO) as follows: 0 (neither), 1 (IABP only), 2 (ECMO only), and 3 (both).
A total of 47 baseline variables were considered as candidate predictors for model development. The incident AKI outcome had no missing data, and missingness among the candidate predictors was minimal, with all variables having missing rates below 0.7%. Missing values in candidate predictors were handled using multiple imputation before model development.
ML feature preprocessing
The initial dataset contained 47 features. To minimize multicollinearity, pairwise correlation analyses were conducted, and variables exhibiting correlation coefficients exceeding 0.90 were removed.
Patients were randomly divided into a training set and an internal test set at a 7:3 ratio. Continuous variables were standardized using z-score normalization, and categorical variables underwent one-hot encoding.
To address class imbalance, the synthetic minority oversampling technique (SMOTE) was applied exclusively to the training set. Feature selection was performed using the least absolute shrinkage and selection operator (LASSO). All preprocessing steps, including correlation-based filtering, normalization, encoding, SMOTE, and LASSO selection, were initially applied and fitted on the training set, and subsequently applied to the internal test set to avoid information leakage.
Statistical analysis
Baseline characteristics were compared between the AKI and non-AKI groups. Continuous variables with approximately normal distributions are presented as mean ± standard deviation (SD), whereas non-normally distributed continuous variables are presented as median (interquartile range [IQR]). Categorical variables are presented as n (%). Between-group comparisons were performed using one-way analysis of variance (ANOVA) for approximately normally distributed continuous variables, the Kruskal-Wallis H test for non-normally distributed continuous variables, and the chi-square test or Fisher’s exact test for categorical variables, as appropriate.
For machine-learning model development, 14 algorithms were implemented and benchmarked within the mlr3 framework: AdaBoostM1, Bayesian network (Bayes_net), CatBoost, ExtraTrees, gradient boosting machine (GBM), k-nearest neighbors (KKNN), LightGBM, logistic regression (logistic), naive Bayes (Naive_bayes), neural network (NNET), random forest (Ranger), classification and regression tree (RPART), support vector machine (SVM), and extreme gradient boosting (XGBoost)[17-25]. A standardized preprocessing and evaluation workflow was maintained consistently across training and internal test sets. Model performance metrics reported included area under the curve (AUC), accuracy (ACC), Brier score, F-beta score (Fbeta), classification error (CE), precision-recall AUC (PRAUC), sensitivity, specificity, negative predictive value (NPV), and positive predictive value (PPV).
Within the training set, 10-fold cross-validation was utilized to derive resampling-based performance estimates for benchmarking the candidate algorithms, and differences in performance metrics across folds were assessed using ANOVA or the Kruskal-Wallis H test, as appropriate. Therefore, the AUC reported during the machine-learning benchmarking stage represented the 10-fold cross-validation AUC within the training set, rather than an independent external testing AUC or a bootstrap optimism-corrected AUC.
For the model demonstrating optimal and robust internal validation performance, SHAP-based interpretability analyses were conducted to quantify feature contributions and provide both global and patient-specific explanations. After selection of the final logistic regression-based predictive model, additional internal validation was performed using 1,000 bootstrap resampling iterations. In this bootstrap procedure, the final model specification with the selected predictors was fixed, while model coefficients were refitted within each bootstrap sample. The complete machine-learning algorithm selection and model selection procedures were not repeated within each bootstrap sample. For optimism correction, the AUC of the refitted model was calculated both in the bootstrap sample and in the original full cohort, and the difference between these two AUC values was used to estimate optimism for each bootstrap iteration. The average optimism across 1,000 bootstrap resamples was then subtracted from the apparent AUC of the final model fitted in the full cohort to obtain the optimism-corrected AUC. The reported confidence intervals were derived from the bootstrap distribution of the internally validated AUC estimates.
Bootstrap-corrected model performance was assessed in terms of discrimination using the optimism-corrected AUC, calibration using calibration curves as well as calibration intercept and slope, and clinical utility using decision curve analysis. To evaluate the robustness of model performance with respect to potentially less objective clinical predictors, sensitivity analyses were further conducted by excluding pulmonary infection and mechanical ventilation individually and simultaneously from the logistic regression model, followed by repeated bootstrap internal validation and assessment of discrimination, calibration, and decision curve performance. All statistical analyses and ML model training were performed using Free Statistics (version 2.4), an R-based platform integrating the mlr3 ecosystem for benchmarking and interpretability analyses[26].
RESULTS
Baseline characteristics
A total of 157 patients with FM admitted to the CCU were included; 58 (36.9%) developed new-onset AKI, while 99 (63.1%) did not [Table 1]. Patients who developed AKI exhibited higher heart rates and greater inflammatory and metabolic disturbances, characterized by higher WBC counts, glucose, and anion gap levels, and lower platelet counts, serum calcium, chloride, and HDL-C levels [Table 1]. In addition, the median respiratory rate was statistically lower in the AKI group than in the non-AKI group, although the absolute difference was modest (18.00 [13.25, 22.00] vs. 20.00 [18.00, 22.00] breaths/min, P = 0.009; Table 1). Cardiac function at admission was more impaired in the AKI group, as reflected by a lower EF. Furthermore, these patients more frequently required intensive interventions, including vasoactive agents, mechanical support, and mechanical ventilation [Table 1]. AKI was also associated with a higher incidence of pulmonary infection [Table 1]. Markers of hypoperfusion and multi-organ injury were significantly elevated among patients with AKI, including higher lactate levels, liver enzymes (ALT and AST), total bilirubin, cardiac biomarkers (CK-MB and BNP), and renal parameters (urea and creatinine) at admission [Table 1]. In contrast, age, sex, BMI, major comorbidities, including hypertension, diabetes, and coronary heart disease, and several hematologic indices, including hemoglobin, hematocrit, and RDW, did not differ significantly between groups [Table 1].
Demographic and clinical characteristics stratified by AKI status
| Variables | Total (n = 157) | No AKI (n = 99) | AKI (n = 58) | P-value |
| Age (years), Mean ± SD | 42.16 ± 14.58 | 40.69 ± 14.28 | 44.67 ± 14.87 | 0.098 |
| Sex, n (%) | 0.242 | |||
| Female | 88 (56.05) | 59 (59.6) | 29 (50) | |
| Male | 69 (43.95) | 40 (40.4) | 29 (50) | |
| BMI (kg/m2), Mean ± SD | 23.46 ± 4.23 | 23.08 ± 4.02 | 24.11 ± 4.52 | 0.141 |
| Symptoms, n (%) | 0.952 | |||
| None | 1 (0.64) | 1 (1.01) | 0 (0) | |
| Fever | 44 (28.03) | 29 (29.29) | 15 (25.86) | |
| Chest tightness/chest pain | 40 (25.48) | 25 (25.25) | 15 (25.86) | |
| Syncope/loss of consciousness | 8 (5.10) | 4 (4.04) | 4 (6.9) | |
| Poor appetite/fatigue | 6 (3.82) | 3 (3.03) | 3 (5.17) | |
| Diarrhea | 1 (0.64) | 1 (1.01) | 0 (0) | |
| ≥ 2 symptom groups | 57 (36.31) | 36 (36.36) | 21 (36.21) | |
| Heart rate (beats/min), Mean ± SD | 99.52 ± 30.58 | 93.79 ± 26.71 | 109.29 ± 34.33 | 0.002 |
| SBP (mmHg), Mean ± SD | 102.03 ± 19.69 | 104.13 ± 18.51 | 98.43 ± 21.24 | 0.08 |
| DBP (mmHg), Mean ± SD | 65.96 ± 16.94 | 66.23 ± 14.92 | 65.48 ± 20.07 | 0.79 |
| WBC (×109/L), Mean ± SD | 12.80 ± 5.76 | 11.83 ± 5.35 | 14.44 ± 6.09 | 0.006 |
| Platelet count (×109/L), Mean ± SD | 199.60 ± 93.97 | 212.32 ± 86.63 | 178.10 ± 102.43 | 0.027 |
| RDW (%), Mean ± SD | 41.16 ± 4.78 | 40.97 ± 3.38 | 41.48 ± 6.51 | 0.523 |
| Hemoglobin (g/L), Mean ± SD | 121.69 ± 23.22 | 123.04 ± 21.44 | 119.41 ± 25.98 | 0.346 |
| Hematocrit (%), Mean ± SD | 36.55 ± 7.67 | 36.90 ± 7.17 | 35.97 ± 8.48 | 0.465 |
| Sodium (mmol/L), Mean ± SD | 136.90 ± 5.88 | 136.63 ± 4.80 | 137.36 ± 7.37 | 0.456 |
| Potassium (mmol/L), Mean ± SD | 4.26 ± 0.74 | 4.18 ± 0.65 | 4.39 ± 0.85 | 0.084 |
| Calcium (mmol/L), Mean ± SD | 1.98 ± 0.23 | 2.01 ± 0.19 | 1.94 ± 0.27 | 0.042 |
| Chloride (mmol/L), Mean ± SD | 100.14 ± 6.05 | 101.69 ± 5.73 | 97.51 ± 5.70 | < 0.001 |
| Glucose (mmol/L), Mean ± SD | 9.69 ± 4.56 | 9.01 ± 3.41 | 10.85 ± 5.88 | 0.014 |
| Anion gap (mmol/L), Mean ± SD | 18.72 ± 7.82 | 15.62 ± 3.78 | 23.95 ± 9.89 | < 0.001 |
| Albumin (g/L), Mean ± SD | 35.29 ± 6.17 | 35.87 ± 4.39 | 34.30 ± 8.32 | 0.125 |
| LDL-C (mmol/L), Mean ± SD | 1.84 ± 0.92 | 1.99 ± 0.85 | 1.59 ± 0.99 | 0.011 |
| HDL-C (mmol/L), Mean ± SD | 0.88 ± 0.34 | 0.97 ± 0.31 | 0.74 ± 0.36 | < 0.001 |
| EF at admission (%), Mean ± SD | 29.48 ± 11.74 | 32.16 ± 11.66 | 24.82 ± 10.43 | < 0.001 |
| Vasoactive agents, n (%) | < 0.001 | |||
| None | 20 (12.74) | 20 (20.2) | 0 (0) | |
| One agent | 78 (49.68) | 57 (57.58) | 21 (36.21) | |
| Two agents | 42 (26.75) | 14 (14.14) | 28 (48.28) | |
| Three agents | 17 (10.83) | 8 (8.08) | 9 (15.52) | |
| Mechanical support, n (%) | < 0.001 | |||
| Neither | 29 (18.47) | 26 (26.26) | 3 (5.17) | |
| IABP only | 29 (18.47) | 21 (21.21) | 8 (13.79) | |
| ECMO only | 27 (17.20) | 21 (21.21) | 6 (10.34) | |
| Both | 72 (45.86) | 31 (31.31) | 41 (70.69) | |
| Mechanical ventilation, n (%) | < 0.001 | |||
| No | 89 (56.69) | 78 (78.79) | 11 (18.97) | |
| Yes | 68 (43.31) | 21 (21.21) | 47 (81.03) | |
| Pacemaker, n (%) | 0.353 | |||
| No | 115 (73.25) | 75 (75.76) | 40 (68.97) | |
| Yes | 42 (26.75) | 24 (24.24) | 18 (31.03) | |
| Hypertension, n (%) | 1 | |||
| No | 156 (99.36) | 98 (98.99) | 58 (100) | |
| Yes | 1 (0.64) | 1 (1.01) | 0 (0) | |
| Diabetes, n (%) | 1 | |||
| No | 151 (96.18) | 95 (95.96) | 56 (96.55) | |
| Yes | 6 (3.82) | 4 (4.04) | 2 (3.45) | |
| Pulmonary infection, n (%) | < 0.001 | |||
| No | 103 (65.61) | 75 (75.76) | 28 (48.28) | |
| Yes | 54 (34.39) | 24 (24.24) | 30 (51.72) | |
| Coronary heart disease, n (%) | 0.761 | |||
| No | 142 (90.45) | 89 (89.9) | 53 (91.38) | |
| Yes | 15 (9.55) | 10 (10.1) | 5 (8.62) | |
| Respiratory rate (breaths/min), median (IQR) | 20.00 (16.00, 22.00) | 20.00 (18.00, 22.00) | 18.00 (13.25, 22.00) | 0.009 |
| Body temperature (°C), Median (IQR) | 36.50 (36.30, 36.70) | 36.50 (36.40, 36.80) | 36.45 (36.30, 36.68) | 0.056 |
| RBC (×1012/L), Median (IQR) | 4.06 (3.69, 4.56) | 4.06 (3.78, 4.57) | 4.06 (3.48, 4.48) | 0.31 |
| Neutrophils (×109/L), Median (IQR) | 9.89 (6.67, 14.01) | 9.23 (6.04, 13.57) | 11.46 (7.78, 15.31) | 0.014 |
| Lymphocytes (×109/L), Median (IQR) | 1.00 (0.70, 1.46) | 0.97 (0.72, 1.34) | 1.06 (0.69, 1.47) | 0.589 |
| CRP (mg/L), Median (IQR) | 30.70 (11.96, 71.45) | 22.34 (10.93, 59.79) | 46.96 (16.33, 83.11) | 0.104 |
| Lactate (mmol/L), Median (IQR) | 2.74 (1.75, 5.22) | 2.32 (1.63, 3.63) | 4.43 (2.48, 9.54) | < 0.001 |
| ALT (U/L), Median (IQR) | 141.35 (55.75, 704.28) | 84.75 (41.25, 224.95) | 737.65 (142.77, 3,217.00) | < 0.001 |
| AST (U/L), Median (IQR) | 156.50 (64.75, 860.15) | 107.45 (52.00, 257.50) | 1,152.50 (111.95, 3,382.25) | < 0.001 |
| Total bilirubin (µmol/L), Median (IQR) | 13.85 (9.40, 21.27) | 12.30 (8.15, 17.65) | 19.65 (12.25, 36.77) | < 0.001 |
| Triglycerides (mmol/L), Median (IQR) | 0.96 (0.70, 1.52) | 0.92 (0.70, 1.41) | 1.20 (0.72, 1.82) | 0.068 |
| Total cholesterol (mmol/L), Median (IQR) | 2.96 (2.31, 3.68) | 3.08 (2.60, 3.79) | 2.76 (2.01, 3.54) | 0.007 |
| CK-MB (U/L), Median (IQR) | 67.00 (35.00, 151.00) | 56.00 (33.00, 102.50) | 126.50 (48.75, 320.75) | < 0.001 |
| BNP (pg/mL), Median (IQR) | 999.00 (483.00, 2,077.50) | 916.00 (425.50, 1,399.50) | 1,315.00 (718.50, 2,278.75) | 0.049 |
| Urea (mmol/L), Median (IQR) | 7.55 (5.20, 10.57) | 6.60 (4.65, 9.27) | 9.50 (6.50, 14.00) | < 0.001 |
| Creatinine (µmol/L), Median (IQR) | 74.50 (57.75, 116.50) | 68.00 (51.00, 82.50) | 116.00 (72.00, 186.00) | < 0.001 |
Feature selection and multicollinearity assessment
Prior to model development, distributions and pairwise correlations among candidate variables were evaluated. The initial dataset included 47 features. To mitigate multicollinearity, pairwise correlations were assessed, and variables exhibiting correlation coefficients greater than 0.90 were excluded. The remaining predictors were standardized (z-score normalization for continuous variables; one-hot encoding for categorical variables) exclusively within the training set. Due to class imbalance, SMOTE oversampling was applied only to the training set. Subsequently, feature selection was performed using LASSO regression, retaining six predictors for modeling: anion gap, chloride, mechanical ventilation, pulmonary infection, total bilirubin, and urea. All preprocessing steps, including correlation-based filtering, scaling, encoding, SMOTE, and LASSO, were fitted to the training set and then consistently applied to the internal test set to prevent information leakage.
Figure 1 illustrates the correlation matrix among the six selected predictors. Pairwise correlations were generally low to moderate, indicating minimal multicollinearity among retained variables after filtering and feature selection.
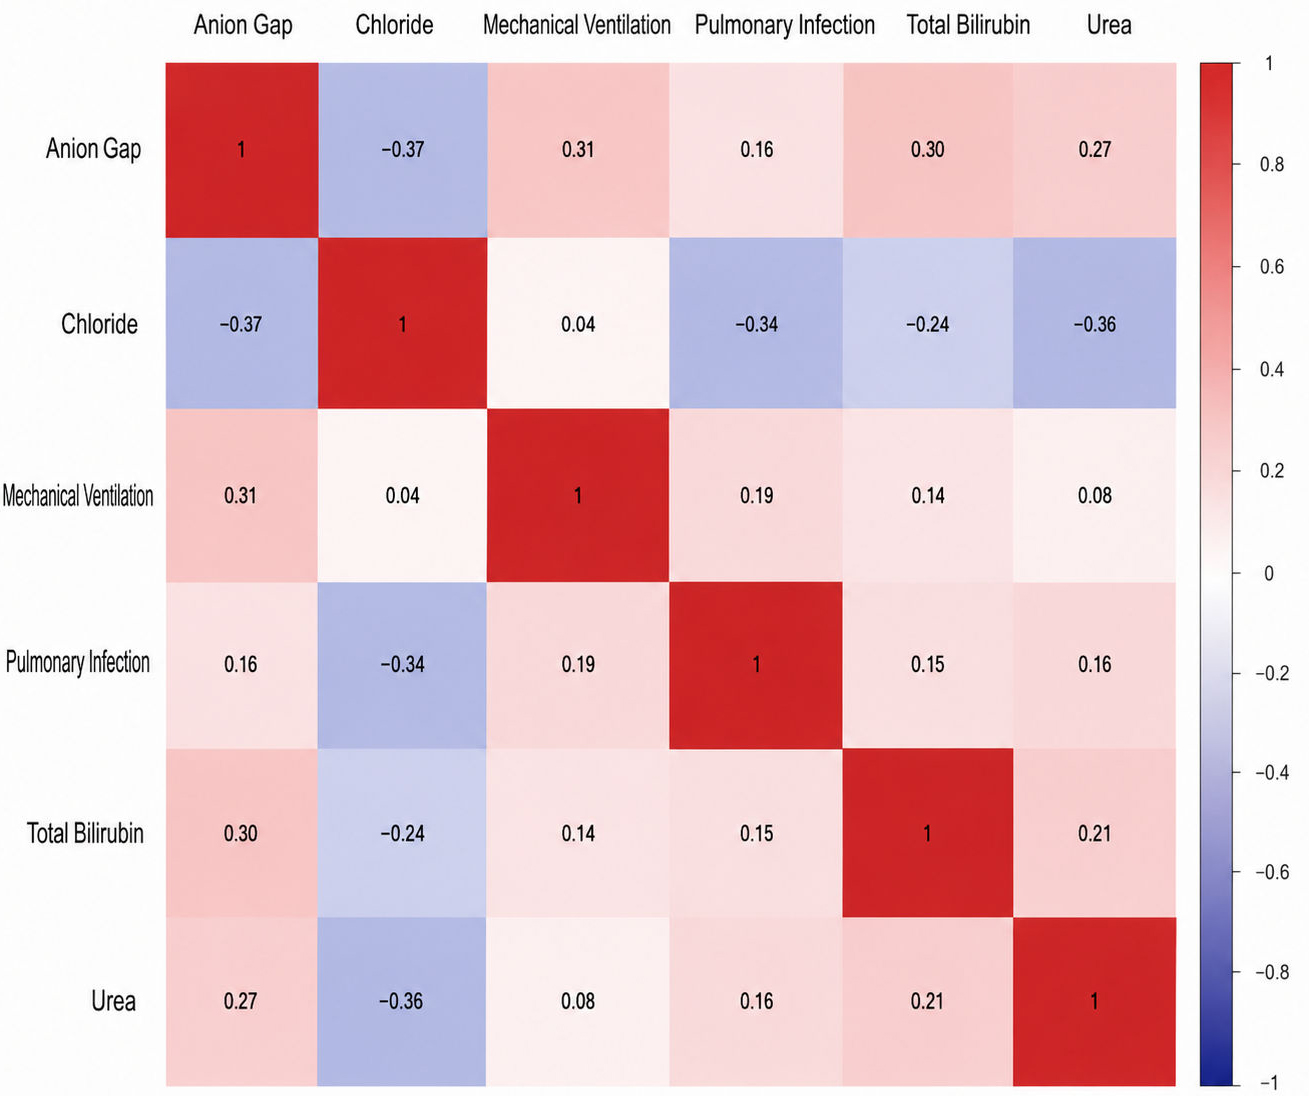
Figure 1. Correlation matrix among the Six LASSO-selected predictors. This heatmap presents pairwise correlation coefficients among the six predictors retained following correlation-based filtering and LASSO selection (anion gap, chloride, mechanical ventilation, pulmonary infection, total bilirubin, and urea). Correlation values are annotated in each cell, and the color gradient indicates both the direction and magnitude of correlations.
Model comparison and final model selection
In the baseline benchmark for the binary outcome, multiple models (AdaBoostM1, BayesNet, CatBoost, ExtraTrees, GBM, KKNN, LightGBM, Logistic regression, NaiveBayes, NNET, Ranger, RPART, SVM, and XGBoost) were evaluated on the same dataset [Table 2]. Discrimination performance (AUC) ranged from 0.73 to 0.87. Logistic regression achieved top-tier discrimination (AUC = 0.87, equal to GBM and NaiveBayes) and demonstrated robust precision-recall performance (PRAUC = 0.80), alongside consistent overall accuracy (ACC = 0.77; Fbeta = 0.68). Regarding calibration, logistic regression displayed favorable performance (Brier score = 0.16; CE = 0.23), indicating reliable probability predictions. Additionally, logistic regression provided a balanced sensitivity-specificity trade-off (sensitivity = 0.67; specificity = 0.83). Given its competitive discrimination, strong calibration, and practical interpretability, logistic regression was selected as the final model for subsequent analysis.
Baseline benchmark performance of multiple models for binary outcome classification
| Model | AUC | ACC | Brier | Fbeta | CE | PRAUC | Sensitivity | Specificity | NPV | PPV |
| AdaBoostM1 | 0.81 | 0.70 | 0.19 | 0.52 | 0.30 | 0.73 | 0.45 | 0.84 | 0.72 | 0.64 |
| BayesNet | 0.79 | 0.74 | 0.18 | 0.63 | 0.26 | 0.67 | 0.66 | 0.77 | 0.83 | 0.63 |
| CatBoost | 0.85 | 0.74 | 0.16 | 0.65 | 0.26 | 0.75 | 0.70 | 0.76 | 0.83 | 0.65 |
| ExtraTrees | 0.83 | 0.75 | 0.17 | 0.66 | 0.25 | 0.72 | 0.69 | 0.77 | 0.82 | 0.67 |
| GBM | 0.87 | 0.77 | 0.16 | 0.68 | 0.23 | 0.81 | 0.66 | 0.84 | 0.80 | 0.72 |
| KKNN | 0.82 | 0.73 | 0.19 | 0.60 | 0.27 | 0.67 | 0.59 | 0.81 | 0.77 | 0.68 |
| LightGBM | 0.85 | 0.71 | 0.19 | 0.59 | 0.29 | 0.77 | 0.62 | 0.77 | 0.78 | 0.63 |
| Logistic | 0.87 | 0.77 | 0.16 | 0.68 | 0.23 | 0.80 | 0.67 | 0.83 | 0.82 | 0.70 |
| NaiveBayes | 0.87 | 0.75 | 0.22 | 0.53 | 0.25 | 0.80 | 0.41 | 0.94 | 0.73 | 0.82 |
| NNET | 0.84 | 0.78 | 0.16 | 0.75 | 0.22 | 0.72 | 0.86 | 0.74 | 0.91 | 0.70 |
| Ranger | 0.84 | 0.74 | 0.16 | 0.61 | 0.26 | 0.76 | 0.60 | 0.81 | 0.78 | 0.66 |
| RPART | 0.73 | 0.70 | 0.21 | 0.60 | 0.30 | 0.56 | 0.66 | 0.71 | 0.82 | 0.56 |
| SVM | 0.83 | 0.75 | 0.17 | 0.65 | 0.25 | 0.70 | 0.68 | 0.78 | 0.82 | 0.66 |
| XGBoost | 0.76 | 0.70 | 0.21 | 0.61 | 0.30 | 0.62 | 0.63 | 0.74 | 0.77 | 0.62 |
Bootstrap internal validation and clinical utility assessment
To further assess the robustness and clinical utility of the logistic regression-based predictive model, we performed internal validation using 1,000 bootstrap resampling iterations. As shown in Figure 2A, the logistic regression model demonstrated good discrimination. The apparent AUC was 0.944, and the mean estimated optimism derived from 1,000 bootstrap resamples was 0.013, resulting in an optimism-corrected AUC of 0.931 (95%CI: 0.892-0.969). The calibration curve showed good agreement between the predicted probabilities generated by the logistic regression model and the observed outcomes [Figure 2B]. After 1,000 bootstrap resamples, the optimism-corrected calibration intercept was -0.040 and the calibration slope was 0.842. Decision curve analysis demonstrated that the logistic regression model provided a higher net benefit than both the treat-all and treat-none strategies at threshold probabilities ranging approximately from 0.02 to 0.99 [Figure 2C].
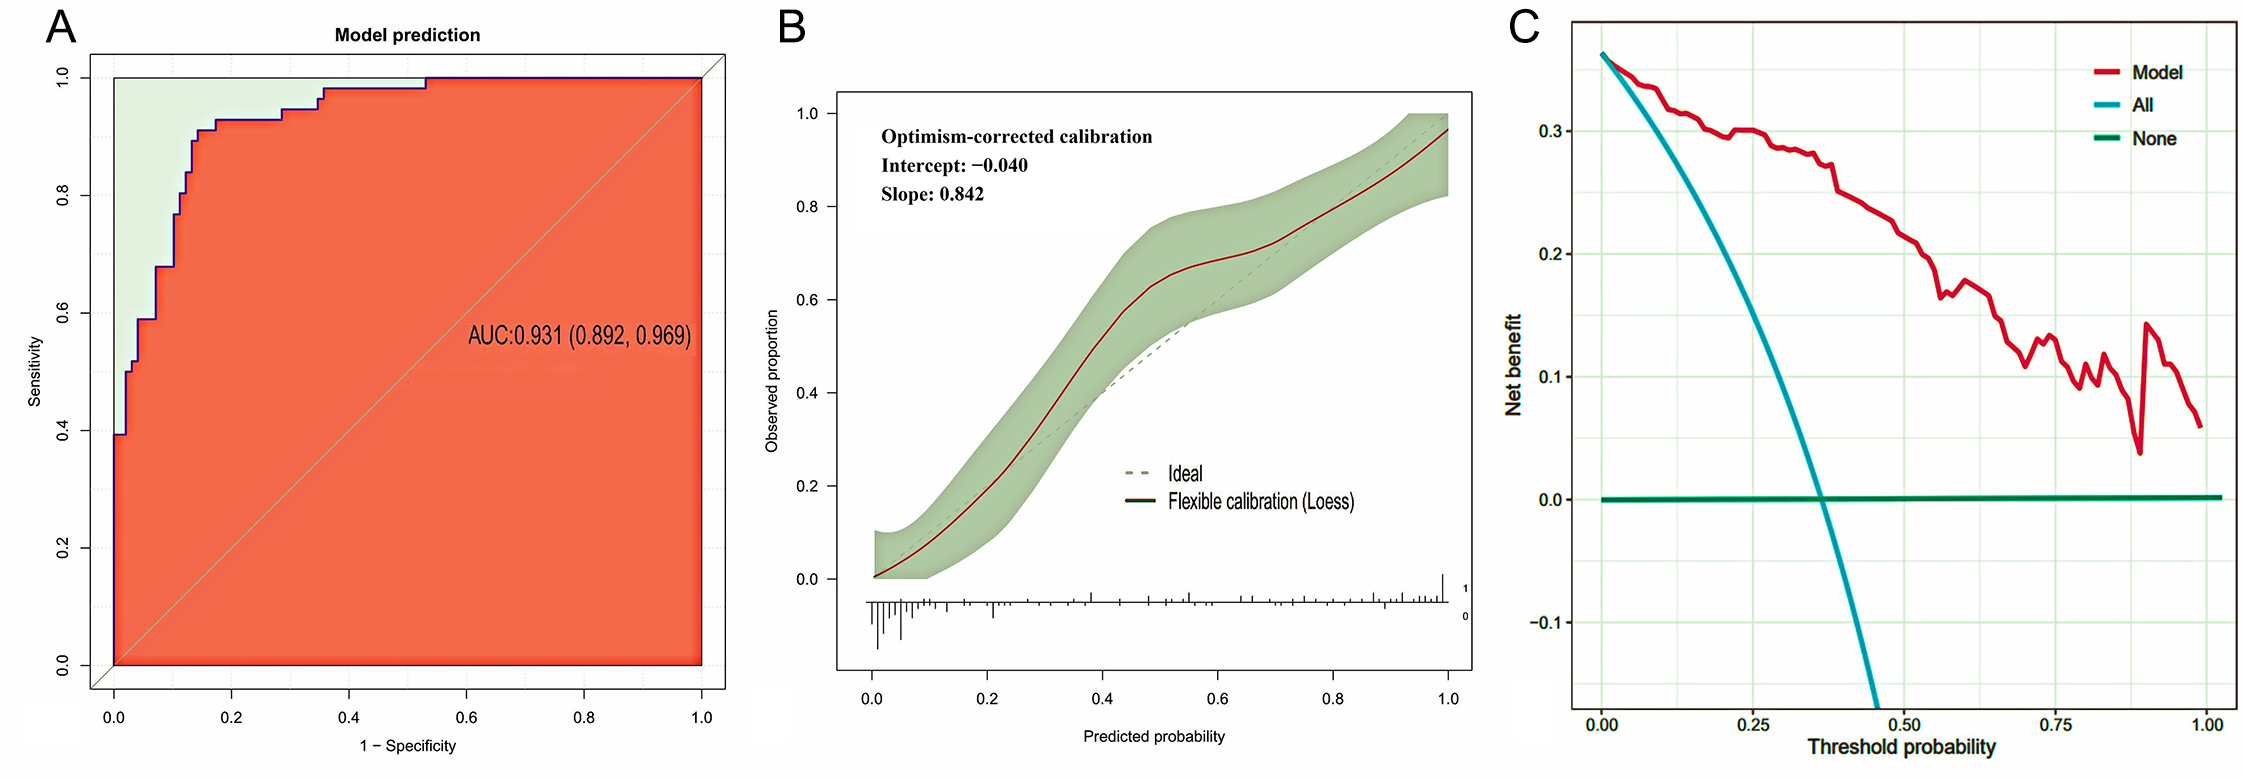
Figure 2. Bootstrap internal validation and clinical utility of the final logistic regression-based predictive model. (A) Receiver operating characteristic curve showing an optimism-corrected AUC of 0.931 (95%CI: 0.892-0.969). The apparent AUC of the final six-predictor logistic regression model fitted in the full cohort was 0.944, and the mean estimated optimism derived from 1,000 bootstrap resamples was 0.013, resulting in an optimism-corrected AUC of 0.931. In each bootstrap sample, the predictor set was fixed and the regression coefficients were re-estimated. The 95% confidence interval was estimated using bootstrap resampling. This AUC is distinct from the 10-fold cross-validation AUC reported in Table 2, which was used for candidate algorithm benchmarking. (B) Calibration curve showing agreement between the probabilities predicted by the final logistic regression model and the observed probabilities. (C) Decision curve analysis comparing the net benefit of the final logistic regression model with the treat-all and treat-none strategies. The model provided greater net benefit than both reference strategies across threshold probabilities of approximately 0.02-0.99.
Sensitivity analyses of bootstrap internal validation and clinical utility
To further evaluate the stability of the model, three sensitivity analyses were performed based on the full logistic regression model, and internal validation was conducted using 1,000 bootstrap resampling iterations for each analysis. Overall, the results of the sensitivity analyses showed trends consistent with those of the full model in terms of discrimination, calibration, and clinical net benefit.
After simultaneous exclusion of pulmonary infection and mechanical ventilation, the model showed an optimism-corrected AUC of 0.827 (95%CI: 0.756-0.898; Supplementary Figure 1A). After 1,000 bootstrap resamples, the optimism-corrected calibration intercept was -0.056 and the calibration slope was 0.909, indicating generally good calibration after internal validation [Supplementary Figure 1B]. Decision curve analysis showed that the model provided a higher net benefit than both the treat-all and treat-none strategies at threshold probabilities of approximately 0.02-0.99 [Supplementary Figure 1C].
After exclusion of pulmonary infection alone, the optimism-corrected AUC was 0.931 (95%CI: 0.893-0.968; Supplementary Figure 2A). After 1,000 bootstrap resamples, the optimism-corrected calibration intercept was -0.029 and the calibration slope was 0.868, indicating generally good calibration after internal validation [Supplementary Figure 2B]. The corresponding decision curve analysis showed that the model provided a higher net benefit than both the treat-all and treat-none strategies at threshold probabilities of approximately 0.02-0.99 [Supplementary Figure 2C].
After exclusion of mechanical ventilation alone, the model showed an optimism-corrected AUC of 0.836 (95%CI: 0.766-0.906; Supplementary Figure 3A). After 1,000 bootstrap resamples, the optimism-corrected calibration intercept was -0.068 and the calibration slope was 0.886, indicating generally good calibration after internal validation [Supplementary Figure 3B]. Decision curve analysis further showed that the model provided a higher net benefit than both the treat-all and treat-none strategies at threshold probabilities of approximately 0.02-0.99 [Supplementary Figure 3C].
Together, these sensitivity analyses showed that after excluding pulmonary infection and/or mechanical ventilation, the model maintained good calibration and favorable clinical net benefit. Excluding pulmonary infection alone produced results similar to the full model. Excluding mechanical ventilation, either alone or together with pulmonary infection, resulted in lower AUC values; however, the optimism-corrected AUCs remained above 0.80.
Interpretability of the logistic model using SHAP analysis
Global interpretation of the logistic model
Based on the final logistic regression model, SHAP values were applied to quantify and visualize the contributions of key clinical features to the prediction of new-onset AKI after CCU admission in FM
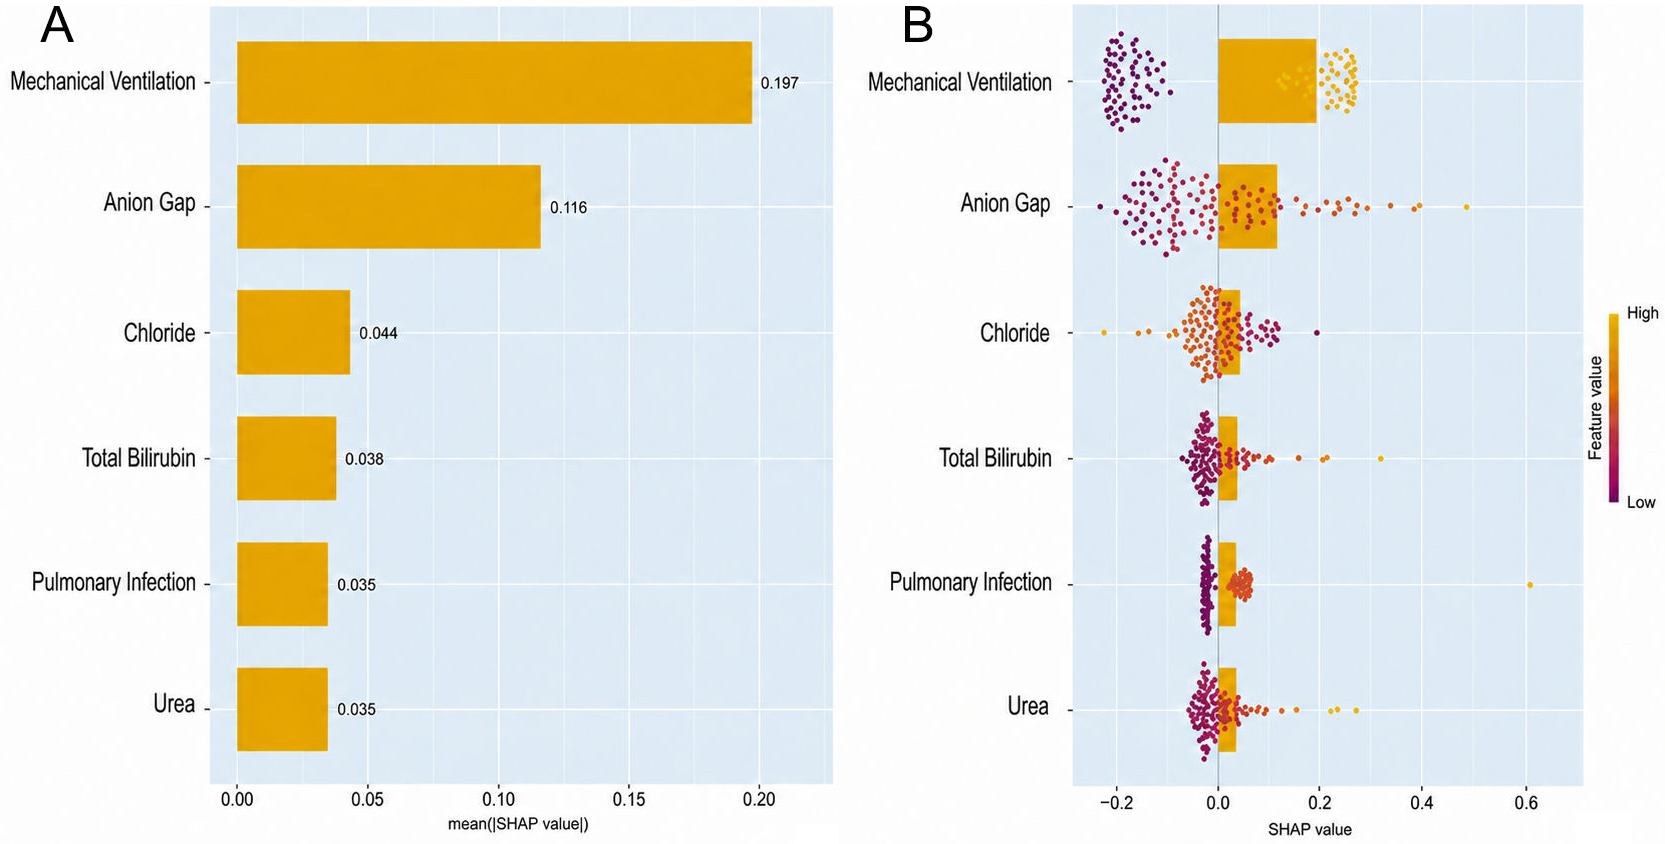
Figure 3. SHAP interpretation of the final logistic regression model for predicting new-onset AKI after CCU admission in FM. (A) Global feature importance ranked by mean absolute SHAP value (top features shown). (B) SHAP summary (beeswarm) plot illustrating the distribution and direction of feature effects across individuals; each dot represents a patient, the horizontal position reflects the SHAP value (impact on prediction), and color indicates feature magnitude (high vs. low). Positive SHAP values increase predicted AKI risk, whereas negative values reduce it.
Individual-level SHAP explanation of predicted AKI risk
To further demonstrate patient-specific interpretability of the final logistic regression model, individual-level SHAP analyses were performed [Figure 4A and B]. In this representative high-risk case, the predicted probability increased from a baseline value of 0.378 to a final estimate of 0.911, driven by the cumulative positive contributions of multiple clinical features. Mechanical ventilation was the strongest contributor (SHAP value: +0.268), resulting in the largest upward shift in predicted risk. Additional risk-enhancing effects were observed for anion gap (value = 21; +0.085), chloride (value = 95; +0.0595), total bilirubin (value = 33.2; +0.0539), and pulmonary infection (+0.0526), with a smaller contribution from urea (value = 9.5). Overall, this decomposition illustrates how the logistic model integrates multiple clinically relevant abnormalities to generate a high predicted probability of new-onset AKI following CCU admission.
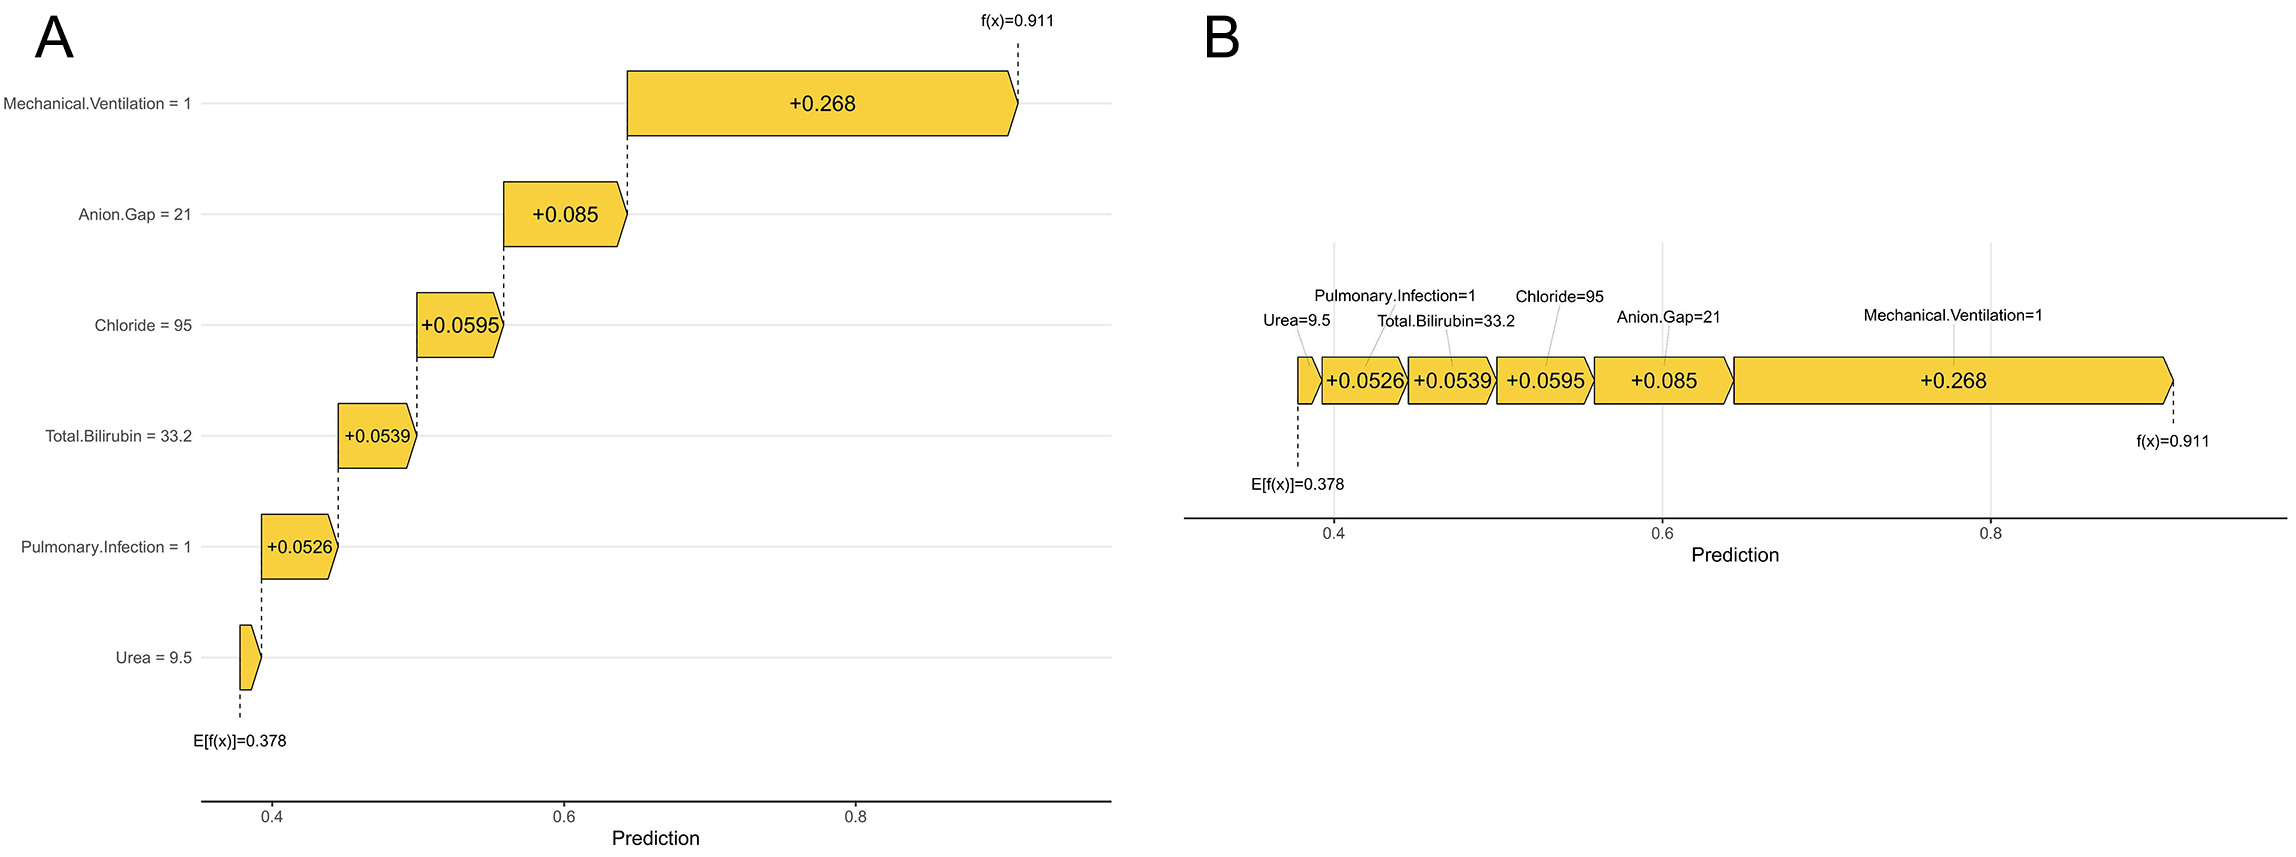
Figure 4. Individual-level SHAP explanations (waterfall and force plots) for the Final logistic regression model predicting new-onset AKI after CCU admission in FM. (A) SHAP waterfall plot for a representative patient. Feature-specific SHAP values accumulate from the baseline prediction to yield the final predicted probability. (B) SHAP force plot for the same patient, illustrating how combined SHAP contributions shift the prediction from the baseline to the final value.
Development of a nomogram for individualized risk estimation
A nomogram was developed based on the final logistic regression model to enable individualized prediction of new-onset AKI after CCU admission in FM [Figure 5]. The nomogram incorporates six predictors: mechanical ventilation, anion gap, chloride, total bilirubin, pulmonary infection, and urea. For each patient, points are assigned according to the value of each predictor and summed to generate a total score, which corresponds to the linear predictor and the estimated probability of AKI. This graphical tool translates the final model into a clinically applicable instrument for bedside risk assessment.
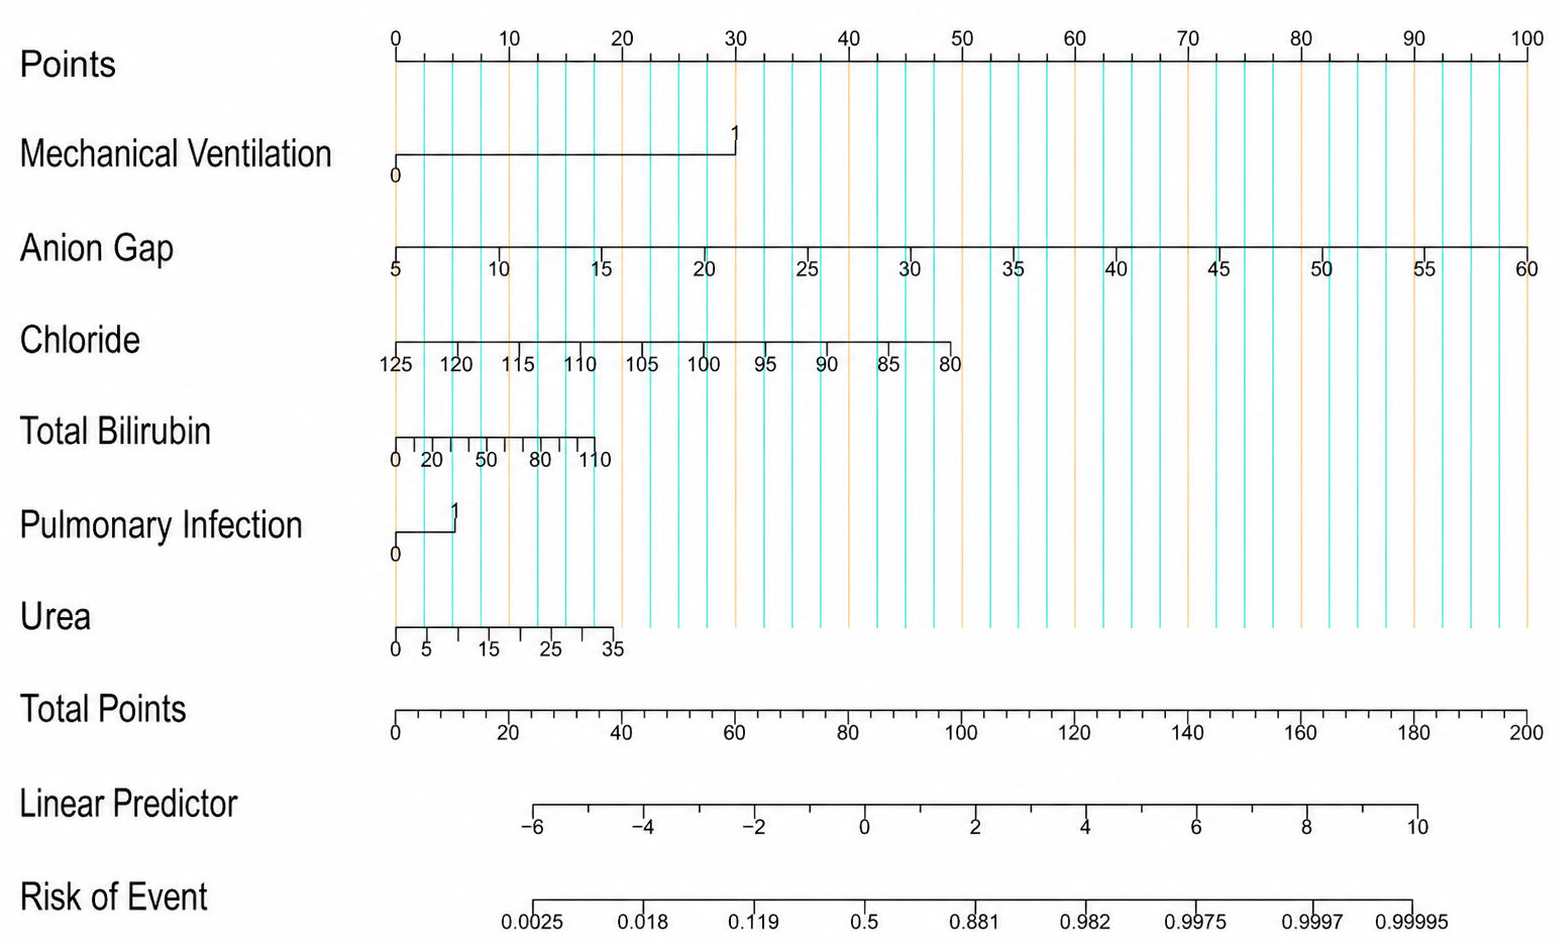
Figure 5. Nomogram derived from the final logistic regression model for predicting new-onset AKI after CCU admission in FM. Nomogram for individualized AKI risk estimation. Points assigned to each predictor are summed to obtain total points, which map to the linear predictor and predicted probability of the event.
DISCUSSION
In this cohort of 157 patients with FM admitted to the CCU, new-onset AKI occurred in 36.9% and was consistently associated with greater systemic severity and worse cardiocirculatory status upon presentation. Compared with those without AKI, patients who developed AKI exhibited more pronounced inflammatory activation and metabolic abnormalities, characterized by higher WBC counts, glucose, and anion gap levels, lower platelet counts, calcium, chloride, and HDL-C, poorer cardiac function, as reflected by reduced EF, and more frequent use of intensive supportive therapies, including vasoactive agents, mechanical circulatory support, and mechanical ventilation, along with a higher incidence of pulmonary infection. Additionally, these patients showed greater evidence of hypoperfusion and multi-organ injury, as indicated by elevated lactate, liver enzymes, bilirubin, cardiac biomarkers, urea, and creatinine levels at admission. Conversely, demographic variables and most comorbidities were largely comparable between groups. Reflecting these clinical patterns, feature selection identified six key predictors: mechanical ventilation, anion gap, chloride, total bilirubin, pulmonary infection, and urea. Among multiple candidate algorithms, logistic regression demonstrated robust discrimination and favorable calibration, supporting its use in subsequent explainable modeling, SHAP interpretation, and development of a nomogram for individualized AKI risk estimation. After selection of the final logistic regression-based predictive model, additional internal validation was performed using 1,000 bootstrap resampling iterations. Bootstrap-corrected performance was assessed by the optimism-corrected AUC, calibration curves, calibration intercept, calibration slope, and decision curve analysis. The model showed stable performance in bootstrap internal validation. In sensitivity analyses, exclusion of pulmonary infection alone had minimal impact, whereas exclusion of mechanical ventilation reduced the AUC. However, all optimism-corrected AUCs remained above 0.80, with good calibration and favorable clinical net benefit.
Compared with prior studies, our research provides distinct incremental value by addressing a clinically important but relatively underexplored scenario: the early prediction of new-onset AKI in adult patients with FM admitted to the CCU. AKI prediction models have been extensively developed and validated across diverse clinical contexts, including sepsis[27], cardiac surgery[28], post-percutaneous coronary intervention[29], hospitalized patients with diabetes and heart failure[30], and persistent AKI following liver transplantation[31]. In addition, systematic evidence suggests that machine-learning algorithms and conventional regression models may demonstrate comparable performance for AKI prediction[32]. However, predictive tools specifically targeting new-onset AKI in FM remain limited. This gap is clinically important because FM is characterized by severe inflammatory activation, extreme hemodynamic instability, rapid circulatory deterioration, and a high risk of multi-organ injury. Both the AHA scientific statement and critical care reviews emphasize that rapid deterioration and circulatory collapse can occur early in FM, often necessitating intensive CCU or ICU management[33,34]. Furthermore, severe FM commonly requires mechanical ventilation and mechanical circulatory support, as illustrated by previous case summaries and adult cohort studies[35-39], indicating that the mechanisms and risk factors associated with AKI in FM may differ from those observed in general ICU, infectious, or perioperative patient populations. Additionally, FM is a relatively rare critical illness, making it difficult for single centers to accumulate large patient cohorts[33,34]; existing myocarditis evidence frequently originates from pediatric single-center studies[40,41], mixed-age registries[42], or contexts such as vaccine-related myocarditis/pericarditis in adolescents[43]. In contrast, our cohort specifically focuses on adult FM patients, aligning more closely with existing adult-focused evidence
In the SHAP interpretation of the final logistic regression model, mechanical ventilation showed the strongest overall contribution to predicting new-onset AKI following CCU admission [Figure 3A and B][48]. This result should be interpreted primarily as a predictive association rather than direct evidence of causality. Clinically, mechanical ventilation may identify patients with more severe respiratory failure, hemodynamic compromise, and higher overall illness severity, all of which are closely related to AKI risk. At the same time, this association is biologically plausible because lung-kidney crosstalk may contribute to renal injury in critically ill patients[49]. Positive-pressure ventilation, particularly when accompanied by elevated plateau pressures or PEEP, can increase intrathoracic pressure, potentially reducing venous return, decreasing cardiac output, and impairing renal venous drainage[48]. These hemodynamic effects may promote renal hypoperfusion and venous congestion, thereby reducing glomerular filtration rate and increasing susceptibility to AKI, especially in patients with FM who often have underlying circulatory instability[48]. Experimental evidence also suggests that injurious ventilation may amplify systemic inflammation, induce distal epithelial apoptosis, and contribute to extra-pulmonary organ dysfunction, providing mechanistic support for possible renal involvement[49]. Nevertheless, because our study was observational and the SHAP analysis was designed to explain model predictions, these findings should not be taken as proof that mechanical ventilation itself causes AKI. Rather, emerging evidence on ventilation-induced kidney injury (VIKI) supports the biological plausibility of this association and highlights the need for lung-protective ventilation, individualized PEEP strategies, optimized fluid management, and close renal monitoring after initiation of mechanical ventilation[50,51].
Beyond mechanical ventilation, anion gap, chloride, total bilirubin, pulmonary infection, and urea also contributed substantially to AKI prediction in the SHAP analysis. These variables were clinically interpretable and were broadly consistent with the baseline clinical patterns observed in AKI patients, including greater inflammatory burden, metabolic disturbance, impaired cardiac function, and higher need for intensive interventions. However, similar to mechanical ventilation, these predictors should be regarded mainly as risk markers within the prediction model rather than definitive mechanistic determinants of AKI. Pulmonary infection may reflect a more severe systemic inflammatory state, hypoxemia, and hemodynamic instability, which are conditions that can impair renal microcirculation and increase AKI susceptibility, but the present model cannot establish a causal effect of infection on AKI[52]. Chloride disturbances and chloride-rich resuscitation strategies may be associated with hyperchloremic acidosis and renal vasoconstriction, supporting careful management of chloride load and acid-base balance in critically ill patients[53]. Total bilirubin may serve as a marker of hepatic dysfunction, systemic stress, or multi-organ involvement, factors that have been associated with AKI risk in ICU populations, although findings may vary across different clinical settings[54]. The anion gap, particularly when corrected for albumin, reflects the burden of unmeasured anions and metabolic derangement and has shown predictive value for AKI in critically ill patients[55]. Similarly, urea-related metrics, including BUN-based indices such as the BUN-to-albumin ratio, may capture azotemia, catabolic stress, and renal vulnerability and have been validated as AKI predictors in hospitalized cohorts[56]. Collectively, these SHAP-derived predictors support the clinical interpretability of the nomogram and suggest a multifactorial AKI risk profile after CCU admission, while reinforcing that model explanations should guide risk stratification and hypothesis generation rather than be interpreted as causal proof. These findings support integrated prevention strategies focused on infection control, individualized fluid and electrolyte management, hemodynamic optimization, and diligent renal monitoring.
The primary strengths of this study are as follows: focusing on an adult FM cohort admitted to the CCU, we addressed the clinically relevant yet relatively understudied scenario of new-onset AKI following CCU admission. We developed a parsimonious prediction model comprising six readily obtainable bedside variables (anion gap, chloride, mechanical ventilation, pulmonary infection, total bilirubin, and urea). After evaluating multiple algorithms, the logistic regression model demonstrated robust discrimination
Limitations
Several limitations should be acknowledged. First, this was a single-center study with a relatively small sample size, which may limit the generalizability of the findings to other CCU populations or institutions with different patient characteristics, treatment strategies, and clinical workflows. Therefore, although the model showed favorable performance in the present cohort, its applicability to broader clinical settings should be interpreted with caution.
Second, this study was observational in nature, and the associations between candidate predictors and new-onset AKI may have been influenced by unmeasured or residual confounding. Although we included routinely available demographic, clinical, laboratory, comorbidity, and treatment-related variables, some potentially relevant factors, such as overall disease severity, multi-organ dysfunction, detailed hemodynamic parameters, nephrotoxic medication exposure, fluid balance, contrast use, and dynamic changes in renal function, were not fully incorporated into the model. Therefore, the observed associations may partly reflect underlying illness severity rather than direct causal effects.
Third, the model was developed using baseline variables obtained within the first 24 h after CCU admission. This design was intended to support early risk stratification before the assessment window for new-onset AKI; however, it may not capture subsequent clinical deterioration or treatment changes during hospitalization. Future studies incorporating time-updated variables may further improve predictive accuracy.
Fourth, although we performed 7:3 internal validation, 10-fold cross-validation, and additional bootstrap internal validation with optimism-corrected performance estimates, no independent external validation cohort was available in the present study. External validation in multicenter cohorts is therefore necessary to confirm the robustness, calibration, and clinical utility of the model before routine clinical implementation.
Fifth, because this was a retrospective observational study, the model should be interpreted as a predictive and associative tool rather than a causal model. The identified predictors should not be regarded as direct causal determinants of new-onset AKI. In particular, treatment- and complication-related variables, such as mechanical ventilation and pulmonary infection, may partly reflect underlying disease severity, systemic inflammatory burden, or clinical deterioration rather than acting as independent causal drivers of AKI. Therefore, the model is intended to support early risk stratification, but not to determine causal pathways or justify interventions targeting individual predictors.
Despite these limitations, the model was based on early and easily accessible clinical variables, making it potentially useful as an interpretable tool for early identification of patients at high risk of new-onset AKI in the CCU setting.
Conclusions
A parsimonious prediction model incorporating six readily available bedside variables was developed for predicting new-onset AKI in adult patients with FM upon CCU admission. The model showed robust discrimination and good calibration, offering a practical approach for early risk stratification and kidney-protective management in the CCU setting.
DECLARATIONS
Acknowledgments
We gratefully thank Jie Liu (Department of Vascular and Endovascular Surgery, Chinese PLA General Hospital) for statistical support and helpful comments on the manuscript.
Authors’ contributions
Made substantial contributions to the conception and design of the study, revised the manuscript critically for important intellectual content: Qu Y, Zhang J (Jing Zhang)
Performed data acquisition: Zheng X, Ye F, Zhang J (Jingjing Zhang)
Performed data analysis and interpretation: Qu Y, Zheng X, Zhang J (Jingjing Zhang)
Drafted the manuscript: Zheng X
All authors read and approved the final manuscript.
Availability of data and materials
All original data supporting the findings of this study are available from the corresponding author upon reasonable request.
AI and AI-assisted tools statement
Not applicable.
Financial support and sponsorship
None.
Conflicts of interest
All authors declared that there are no conflicts of interest.
Ethical approval and consent to participate
This retrospective cohort study was conducted at Fuwai Central China Cardiovascular Hospital. The study protocol was reviewed and approved by the Ethics Committee for Scientific Research, New Technologies and New Services of Fuwai Central China Cardiovascular Hospital (Approval No. 2026-Lun-23). The study was conducted in accordance with the Declaration of Helsinki. Given the retrospective nature of the study, the use of anonymized clinical data, and the absence of any additional patient contact or intervention, the requirement for informed consent was waived by the ethics committee.
Consent for publication
Not applicable.
Copyright
© The Author(s) 2026.
Supplementary Materials
REFERENCES
1. Ammirati E, Moslehi JJ. Diagnosis and treatment of acute myocarditis: a review. JAMA. 2023;329:1098.
2. Sorella A, Galanti K, Iezzi L, et al. Diagnosis and management of dilated cardiomyopathy: a systematic review of clinical practice guidelines and recommendations. Eur Heart J Qual Care Clin Outcomes. 2025;11:206-22.
3. Martens P, Cooper LT, Tang WHW. Diagnostic approach for suspected acute myocarditis: considerations for standardization and broadening clinical spectrum. J Am Heart Assoc. 2023;12:e031454.
4. Montero S, Abrams D, Ammirati E, et al. Fulminant myocarditis in adults: a narrative review. J Geriatr Cardiol. 2022;19:137-51.
5. Wilson FP, Martin M, Yamamoto Y, et al. Electronic health record alerts for acute kidney injury: multicenter, randomized clinical trial. BMJ. 2021;372:m4786.
6. Hoste EAJ, Bagshaw SM, Bellomo R, et al. Epidemiology of acute kidney injury in critically ill patients: the multinational AKI-EPI study. Intensive Care Med. 2015;41:1411-23.
7. Chertow GM, Levy EM, Hammermeister KE, Grover F, Daley J. Independent association between acute renal failure and mortality following cardiac surgery. Am J Med. 1998;104:343-8.
8. Chertow GM, Burdick E, Honour M, Bonventre JV, Bates DW. Acute kidney injury, mortality, length of stay, and costs in hospitalized patients. J Am Soc Nephrol. 2005;16:3365-70.
9. Hobson C, Ozrazgat-Baslanti T, Kuxhausen A, et al. Cost and mortality associated with postoperative acute kidney injury. Ann Surg. 2015;261:1207-14.
10. Kellum JA, Sileanu FE, Bihorac A, Hoste EAJ, Chawla LS. Recovery after acute kidney injury. Am J Respir Crit Care Med. 2017;195:784-91.
11. Hickson LJ, Chaudhary S, Williams AW, et al. Predictors of outpatient kidney function recovery among patients who initiate hemodialysis in the hospital. Am J Kidney Dis. 2015;65:592-602.
12. Craven AMS, Hawley CM, McDonald SP, Rosman JB, Brown FG, Johnson DW. Predictors of renal recovery in Australian and New Zealand end-stage renal failure patients treated with peritoneal dialysis. Perit Dial Int. 2007;27:184-91.
13. Koyner JL, Carey KA, Edelson DP, Churpek MM. The development of a machine learning inpatient acute kidney injury prediction model. Crit Care Med. 2018;46:1070-7.
14. Luo X, Li B, Zhu R, et al. Development and validation of an interpretable machine learning model for predicting in-hospital mortality for ischemic stroke patients in ICU. Int J Med Inf. 2025;198:105874.
15. Jiang J, Shu H, Wang DW, et al. Chinese Society of Cardiology guidelines on the diagnosis and treatment of adult fulminant myocarditis. Sci China Life Sci. 2024;67:913-39.
16. Disease: Improving Global Outcomes (KDIGO). KDIGO clinical practice guideline for acute kidney injury. Kidney Int Suppl. 2012;2:1-138. Available from: https://kdigo.org/wp-content/uploads/2016/10/KDIGO-2012-AKI-Guideline-English.pdf [Last accessed on 20 Aug 2026].
17. Xu R, Chen Y, Yao Z, et al. Application of machine learning algorithms to identify people with low bone density. Front Public Health. 2024;12:1347219.
18. Mullick SS, Datta S, Das S. Adaptive learning-based k-nearest neighbor classifiers with resilience to class imbalance. IEEE Trans Neural Netw Learn Syst. 2018;29:5713-25.
19. Ke G, Meng Q, Finley T, et al. LightGBM: a highly efficient gradient boosting decision tree. Adv Neural Inf Process Syst. 2017;30:3146-54.
20. Yang Z, Ren J, Zhang Z, et al. A new three-way incremental naive bayes classifier. Electronics. 2023;12:1730.
21. Bisong E. The multilayer perceptron (MLP). In: Building machine learning and deep learning models on google cloud platform. Berkeley, CA: Apress; 2019. pp. 401-5.
23. Strobl C, Malley J, Tutz G. An introduction to recursive partitioning: rationale, application, and characteristics of classification and regression trees, bagging, and random forests. Psychol Methods. 2009;14:323-48.
24. Suthaharan S. Support vector machine. In: Machine learning models and algorithms for big data classification. Boston, MA: Springer; 2016. pp. 207-35.
25. Chen T, Guestrin C. XGBoost: a scalable tree boosting system. In Proceedings of the 22nd ACM SIGKDD International Conference on Knowledge Discovery and Data Mining; San Francisco California USA. New York, NY, USA: ACM; 2016. pp. 785-94.
26. Zheng X, Zhang W, Yang F, Wang L, Yu B, Liang B. Evaluative performance of TyG-ABSI versus traditional indices in relation to cardiovascular disease and mortality: evidence from the U.S. NHANES. Cardiovasc Diabetol. 2025;24:344.
27. Yue S, Li S, Huang X, et al. Machine learning for the prediction of acute kidney injury in patients with sepsis. J Transl Med. 2022;20:215.
28. Tseng P, Chen Y, Wang C, et al. Prediction of the development of acute kidney injury following cardiac surgery by machine learning. Crit Care. 2020;24:478.
29. Kuno T, Mikami T, Sahashi Y, et al. Machine learning prediction model of acute kidney injury after percutaneous coronary intervention. Sci Rep. 2022;12:749.
30. Li G, Zhao Z, Yu Z, Liao J, Zhang M. Machine learning for risk prediction of acute kidney injury in patients with diabetes mellitus combined with heart failure during hospitalization. Sci Rep. 2025;15:10728.
31. Del Toro-Cisneros N, Antiga-López FJ, Felix-Bauer KC, et al. Development of a prediction index for persistent acute kidney injury following orthotopic liver transplant. Ann Hepatol. 2025;30:101923.
32. Song X, Liu X, Liu F, Wang C. Comparison of machine learning and logistic regression models in predicting acute kidney injury: a systematic review and meta-analysis. Int J Med Inf. 2021;151:104484.
33. Kociol RD, Cooper LT, Fang JC, et al. Recognition and initial management of fulminant myocarditis: a scientific statement from the American Heart Association. Circulation. 2020;141:e69-92.
35. Ho JS, Sia C, Chan MY, Lin W, Wong RC. Coronavirus-induced myocarditis: a meta-summary of cases. Heart Lung. 2020;49:681-5.
36. Barhoum P, Pineton De Chambrun M, Dorgham K, et al. Phenotypic heterogeneity of fulminant COVID-19-related myocarditis in adults. J Am Coll Cardiol. 2022;80:299-312.
37. Lobo MLS, Taguchi Â, Gaspar HA, Ferranti JF, Carvalho WBD, Delgado AF. Fulminant myocarditis associated with the H1N1 influenza virus: case report and literature review. Rev Bras Ter Intensiva. 2014;26:321-26.
38. Tian F, Xiao Y, Peng Z, et al. Fulminant myocarditis caused by influenza B virus in a male child: a case report and literature review. J Cardiothorac Surg. 2024;19:492.
39. Nirthanakumaran D, Pathan S, Parikh D, Pathan F. Fulminant myocarditis with normal inflammatory markers. JACC Case Rep. 2025;30:103878.
40. Zhao Y, Da M, Yang X, Xu Y, Qi J. A retrospective analysis of clinical characteristics and outcomes of pediatric fulminant myocarditis. BMC Pediatr. 2024;24:553.
41. Yuan J, Li L, Li F, et al. Analysis of risk factors affecting prognosis of fulminant myocarditis in children: a ten-year single-center study. BMC Pediatr. 2025;25:209.
42. Caforio ALP, Kaski JP, Gimeno JR, et al. Endomyocardial biopsy: safety and prognostic utility in paediatric and adult myocarditis in the European Society of Cardiology EURObservational Research Programme Cardiomyopathy and Myocarditis Long-Term Registry. Eur Heart J. 2024;45:2548-69.
43. Foltran D, Delmas C, Flumian C, et al. Myocarditis and pericarditis in adolescents after first and second doses of mRNA COVID-19 vaccines. Eur Heart J Qual Care Clin Outcomes. 2022;8:99-103.
44. Kanaoka K, Onoue K, Terasaki S, et al. Features and outcomes of histologically proven myocarditis with fulminant presentation. Circulation. 2022;146:1425-33.
45. Montero S, Aissaoui N, Tadié J, et al. Fulminant giant-cell myocarditis on mechanical circulatory support: management and outcomes of a French multicentre cohort. Int J Cardiol. 2018;253:105-12.
46. Gerfaud-Valentin M, Sève P, Iwaz J, et al. Myocarditis in adult-onset still disease. Medicine. 2014;93:280-9.
47. Zheng Y, Chen Z, Song W, et al. Cardiovascular adverse events associated with immune checkpoint inhibitors: a retrospective multicenter cohort study. Cancer Med. 2024;13:e7233.
48. Van Den Akker JP, Egal M, Groeneveld AJ. Invasive mechanical ventilation as a risk factor for acute kidney injury in the critically ill: a systematic review and meta-analysis. Crit Care. 2013;17:R98.
49. Imai Y, Parodo J, Kajikawa O, et al. Injurious mechanical ventilation and end-organ epithelial cell apoptosis and organ dysfunction in an experimental model of acute respiratory distress syndrome. JAMA. 2003;289:2104.
50. Yang H, Benos PV, Kitsios GD. Protecting the lungs but hurting the kidneys: causal inference study for the risk of ventilation-induced kidney injury in ARDS. Ann Transl Med. 2020;8:985.
51. Seubert ME, Goeijenbier M. Controlled mechanical ventilation in critically Ill patients and the potential role of venous bagging in acute kidney injury. J Clin Med. 2024;13:1504.
52. Ni W, Qin HD. Prognostic factors and evaluation methods of acute kidney injury among sepsis patients with pulmonary infection. Eur Rev Med Pharmacol Sci. 2023;27:10403-10.
53. Haines RW, Kirwan CJ, Prowle JR. Managing chloride and bicarbonate in the prevention and treatment of acute kidney injury. Semin Nephrol. 2019;39:473-83.
54. Zhou H. Total bilirubin level is associated with acute kidney injury in neonates admitted to the neonatal intensive care units: based on MIMIC-III database. Eur J Pediatr. 2024;183:4235-41.
55. Wang Z, Zhang H, Xie X, Cao F, Li F. Albumin-corrected anion gap predicts acute kidney injury in critically ill patients with acute pancreatitis: a retrospective cohort study. BMC Nephrol. 2025;26:348.
Cite This Article
 Open Access
How to Cite
Download Citation
Export Citation File:
Type of Import
Tips on Downloading Citation
Citation Manager File Format
Type of Import
Direct Import: When the Direct Import option is selected (the default state), a dialogue box will give you the option to Save or Open the downloaded citation data. Choosing Open will either launch your citation manager or give you a choice of applications with which to use the metadata. The Save option saves the file locally for later use.
Indirect Import: When the Indirect Import option is selected, the metadata is displayed and may be copied and pasted as needed.
About This Article
Copyright

Data & Comments
Data
0










Comments
Comments must be written in English. Spam, offensive content, impersonation, and private information will not be permitted. If any comment is reported and identified as inappropriate content by OAE staff, the comment will be removed without notice. If you have any queries or need any help, please contact us at [email protected].