

fig3
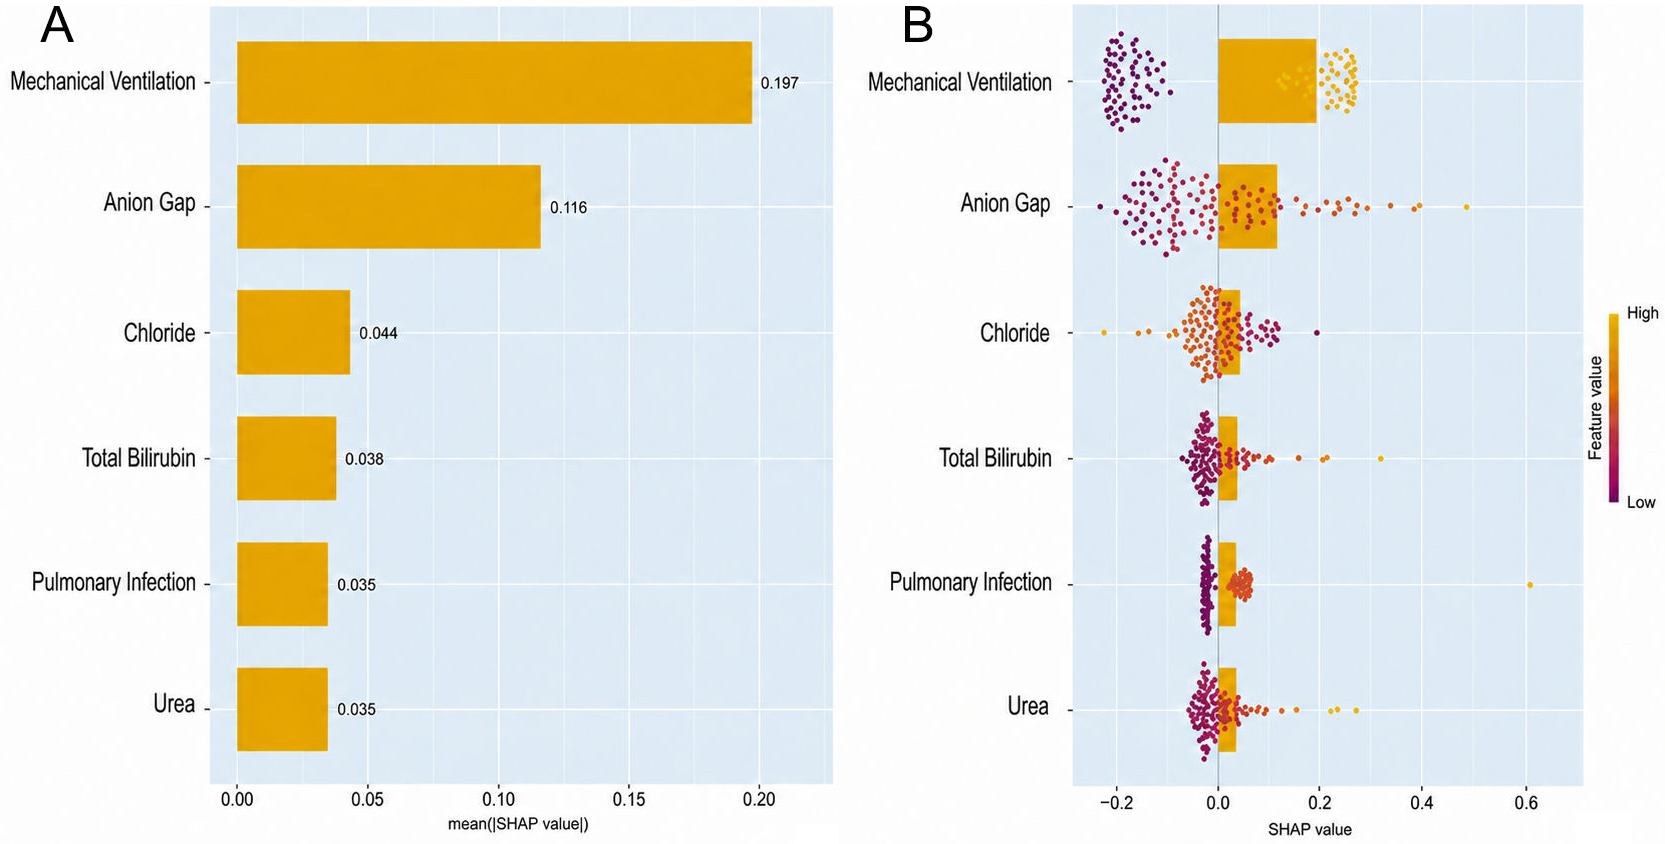
Figure 3. SHAP interpretation of the final logistic regression model for predicting new-onset AKI after CCU admission in FM. (A) Global feature importance ranked by mean absolute SHAP value (top features shown). (B) SHAP summary (beeswarm) plot illustrating the distribution and direction of feature effects across individuals; each dot represents a patient, the horizontal position reflects the SHAP value (impact on prediction), and color indicates feature magnitude (high vs. low). Positive SHAP values increase predicted AKI risk, whereas negative values reduce it.




