

fig4
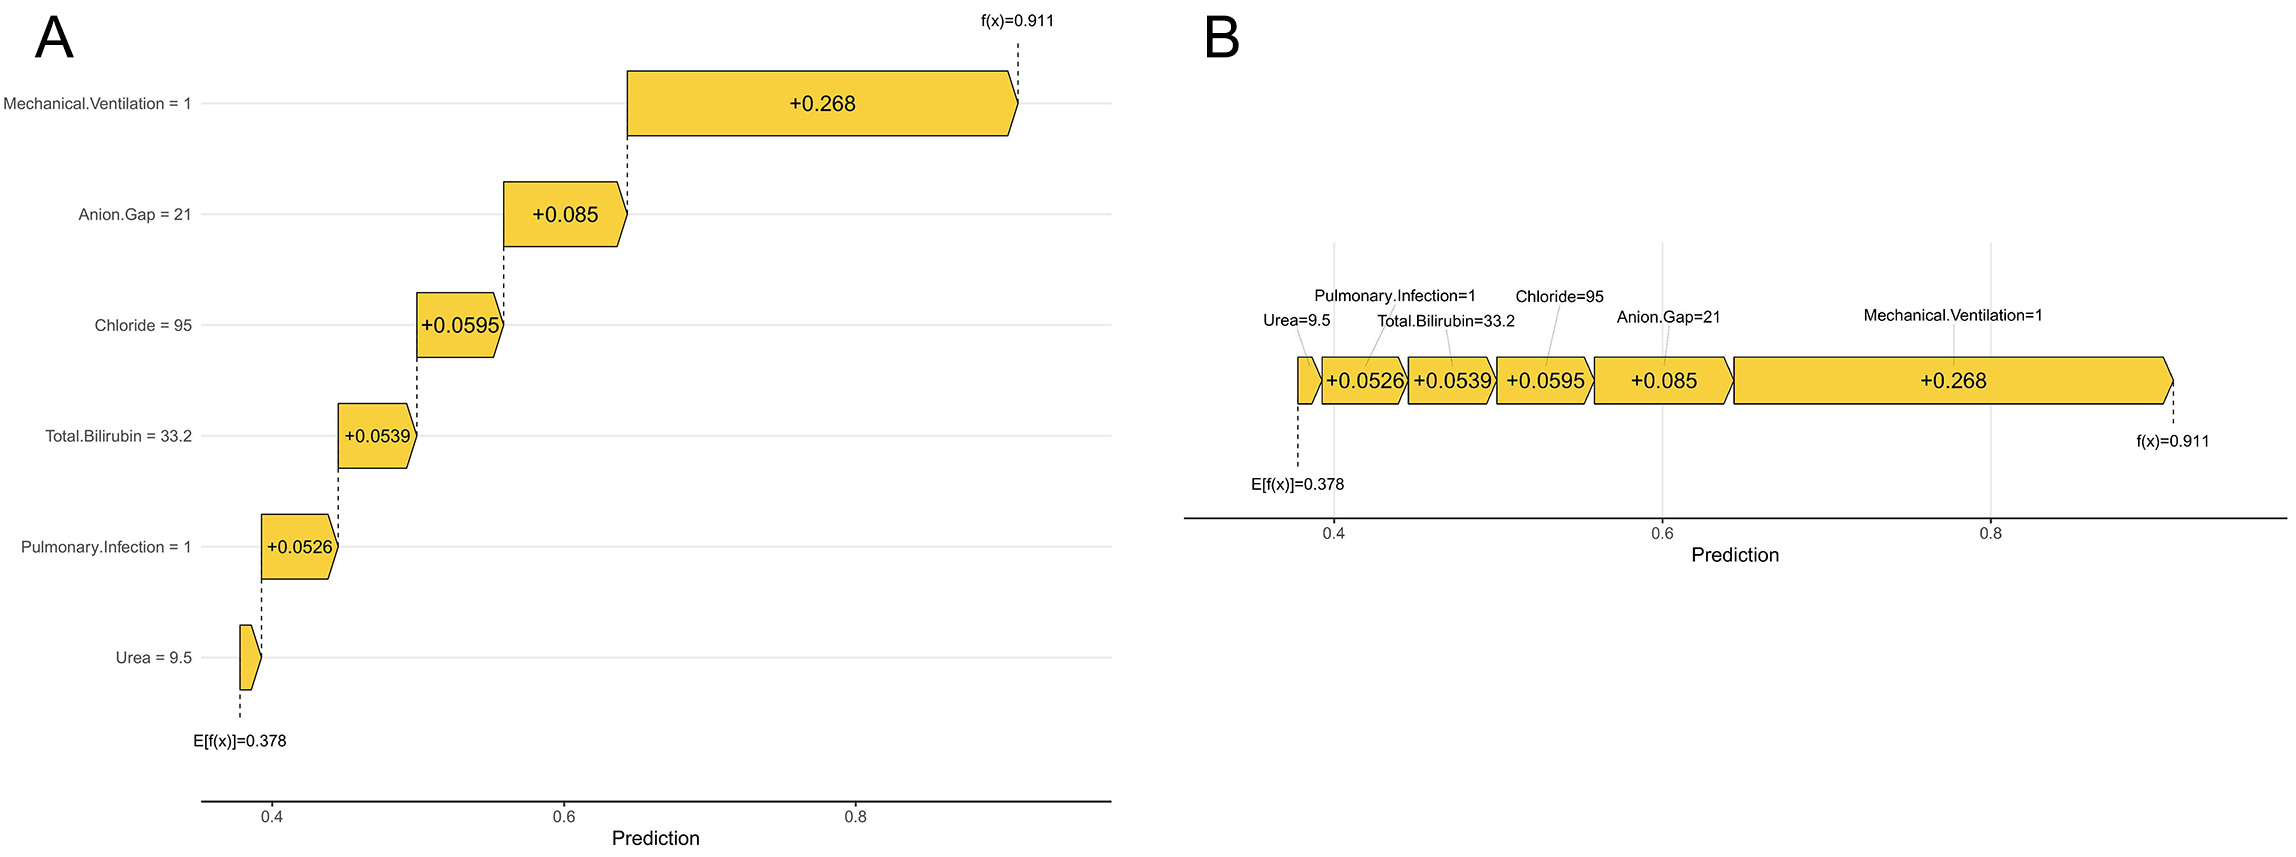
Figure 4. Individual-level SHAP explanations (waterfall and force plots) for the Final logistic regression model predicting new-onset AKI after CCU admission in FM. (A) SHAP waterfall plot for a representative patient. Feature-specific SHAP values accumulate from the baseline prediction to yield the final predicted probability. (B) SHAP force plot for the same patient, illustrating how combined SHAP contributions shift the prediction from the baseline to the final value.




