

fig2
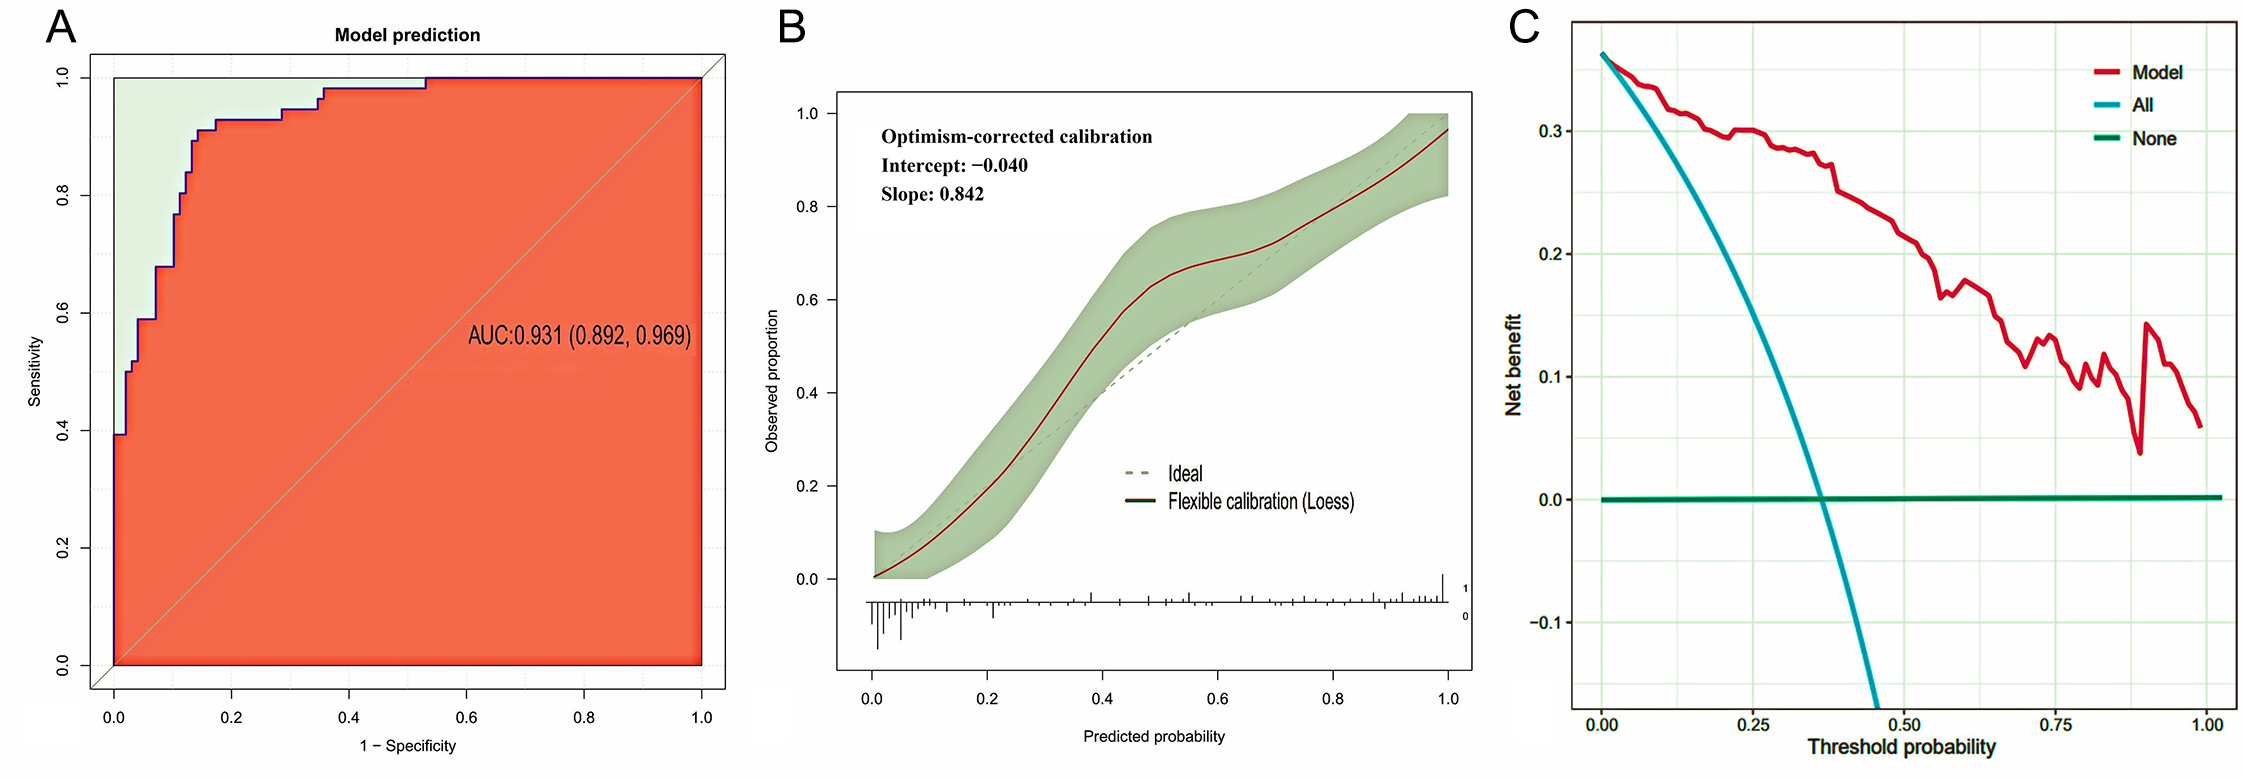
Figure 2. Bootstrap internal validation and clinical utility of the final logistic regression-based predictive model. (A) Receiver operating characteristic curve showing an optimism-corrected AUC of 0.931 (95%CI: 0.892-0.969). The apparent AUC of the final six-predictor logistic regression model fitted in the full cohort was 0.944, and the mean estimated optimism derived from 1,000 bootstrap resamples was 0.013, resulting in an optimism-corrected AUC of 0.931. In each bootstrap sample, the predictor set was fixed and the regression coefficients were re-estimated. The 95% confidence interval was estimated using bootstrap resampling. This AUC is distinct from the 10-fold cross-validation AUC reported in Table 2, which was used for candidate algorithm benchmarking. (B) Calibration curve showing agreement between the probabilities predicted by the final logistic regression model and the observed probabilities. (C) Decision curve analysis comparing the net benefit of the final logistic regression model with the treat-all and treat-none strategies. The model provided greater net benefit than both reference strategies across threshold probabilities of approximately 0.02-0.99.




