
fig9
From: Unlocking the head: unleashing deep learning and depth camera for free head movement gaze estimation
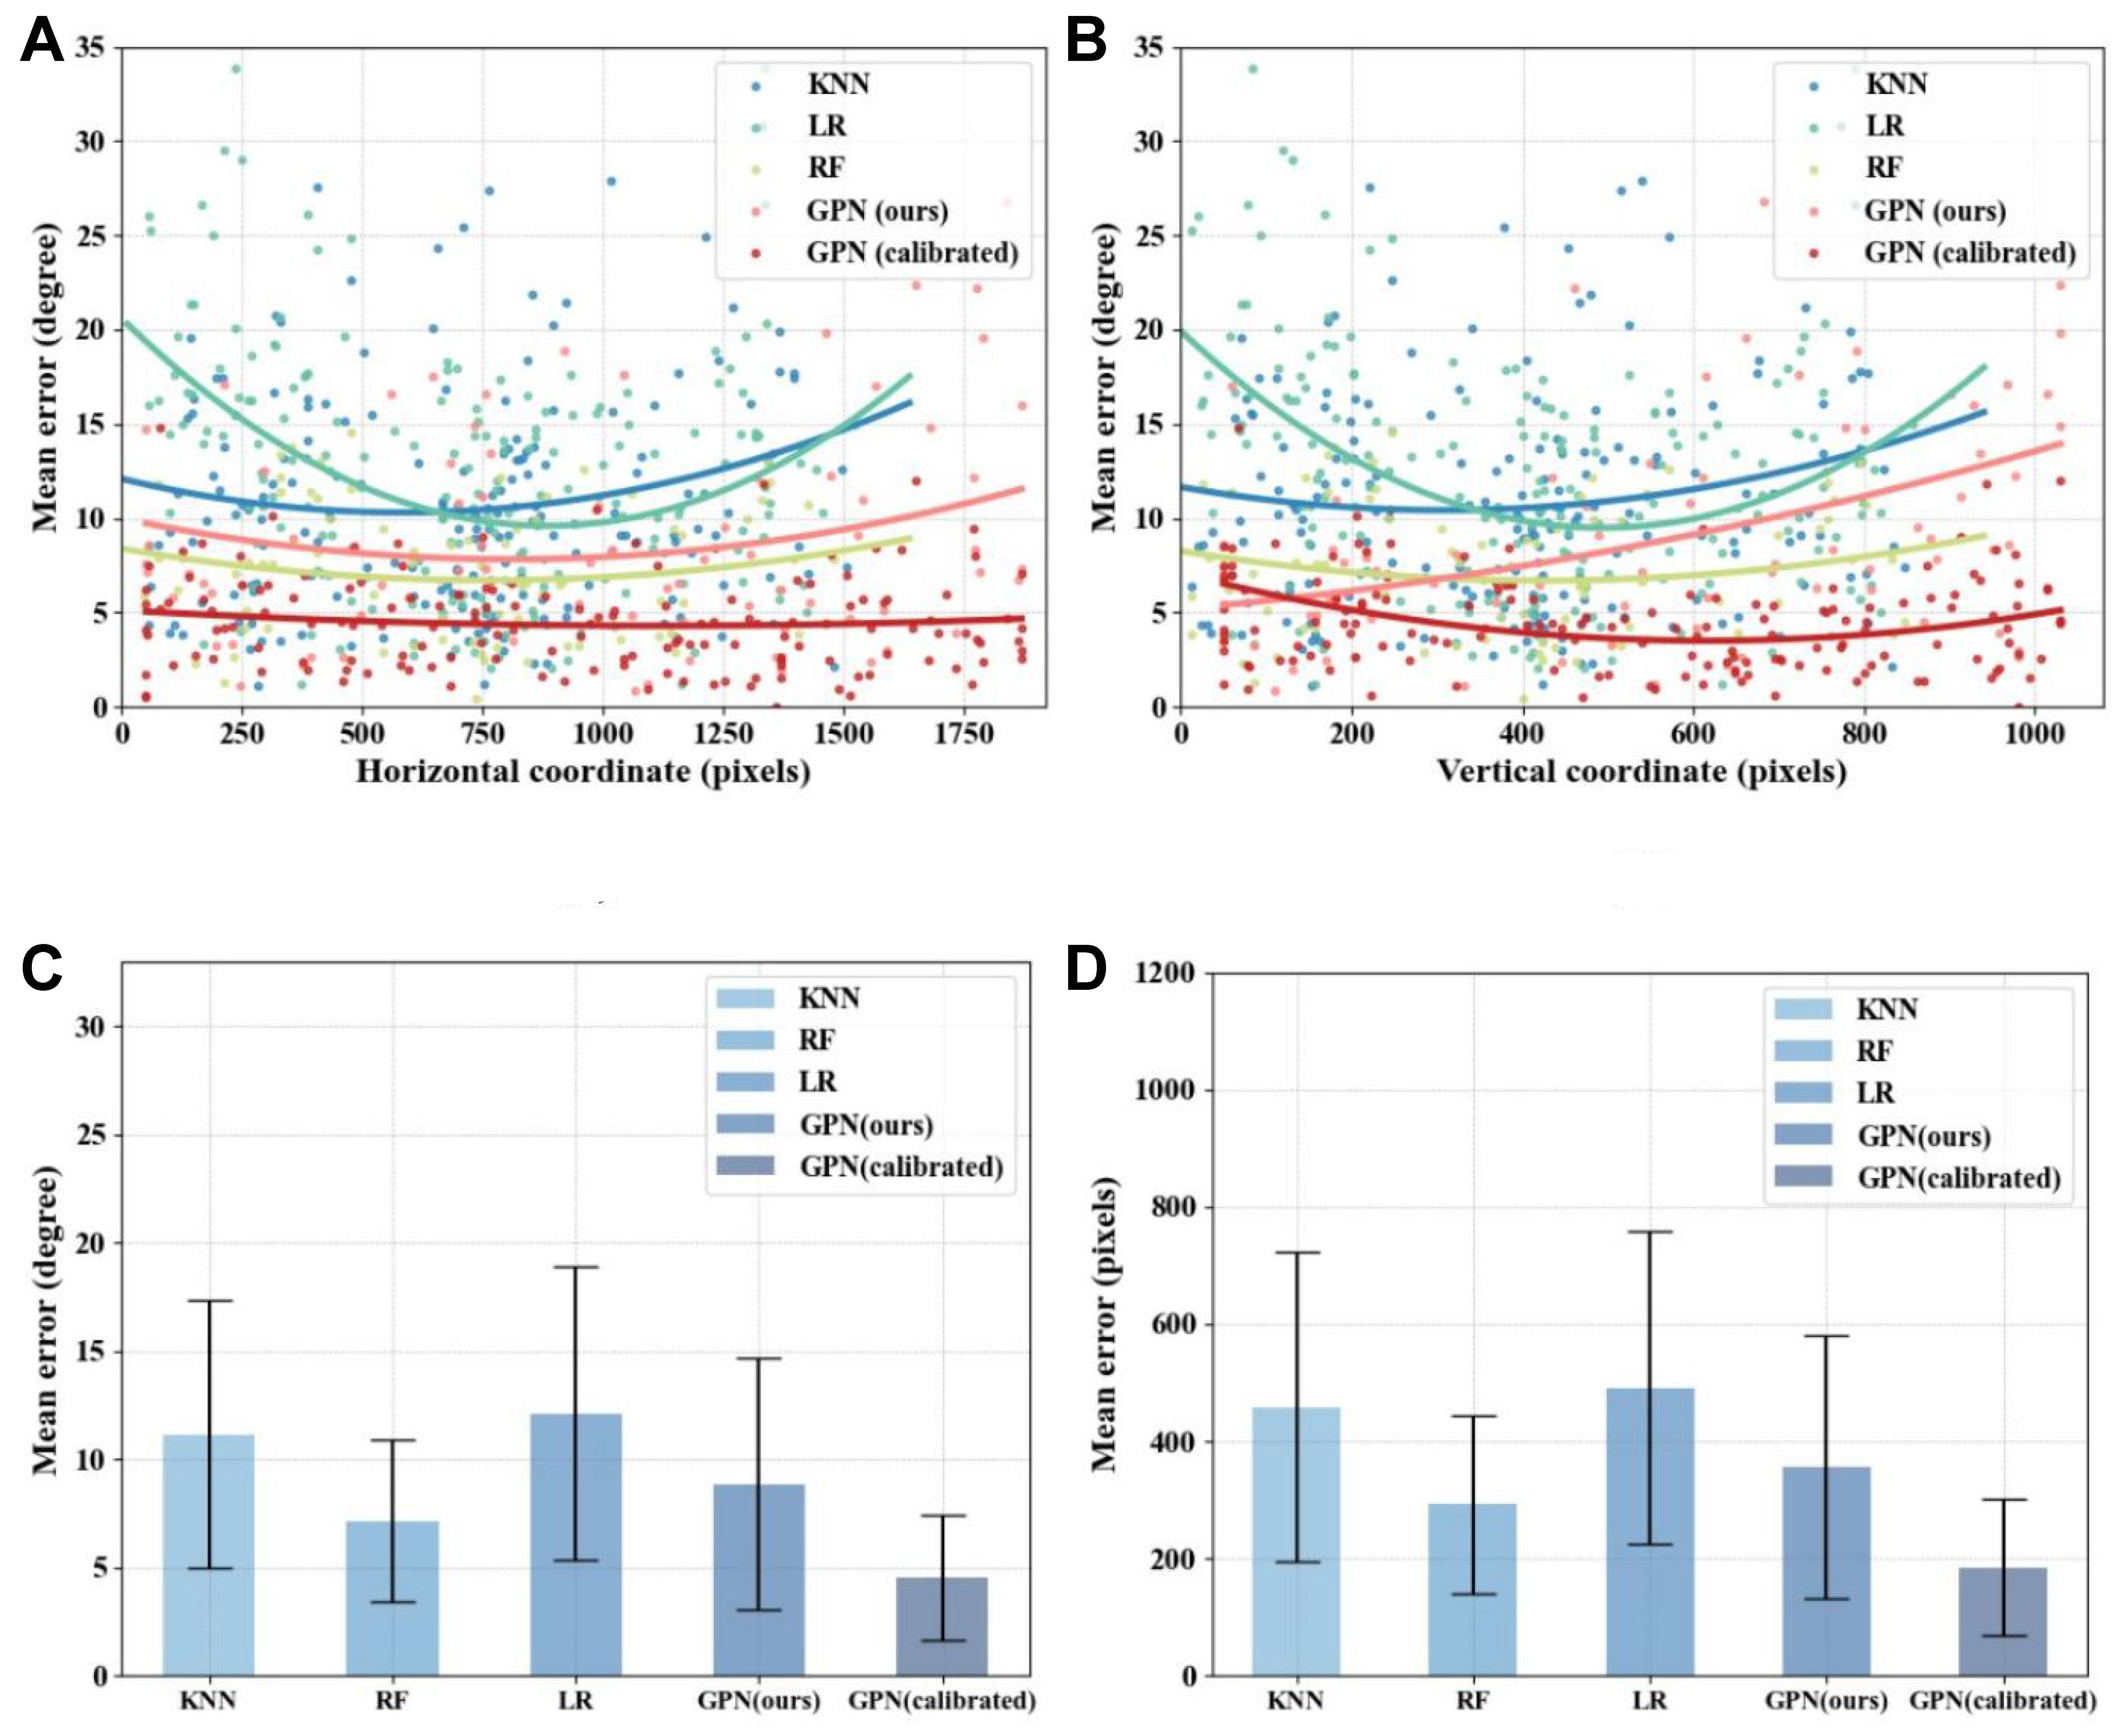
Figure 9. Performance comparison analysis of GPN and other models. (A) scatterplot and fitted curve analysis of the horizontal coordinates of the target points between different models; (B) Scatterplot and fitted curve analysis of the vertical coordinates of the target points between different models; (C) Analysis of mean angular errors for different models; error bars represent the standard deviations of angular errors across the test samples (n = 2); (D) Analysis of mean pixel errors for different models; error bars represent the standard deviations of pixel errors across the test samples (n = 2). GPN: Gaze-Point-Net; KNN: K-nearest neighbors; LR: linear regression; RF: random forest.