
fig6
From: Unlocking the head: unleashing deep learning and depth camera for free head movement gaze estimation
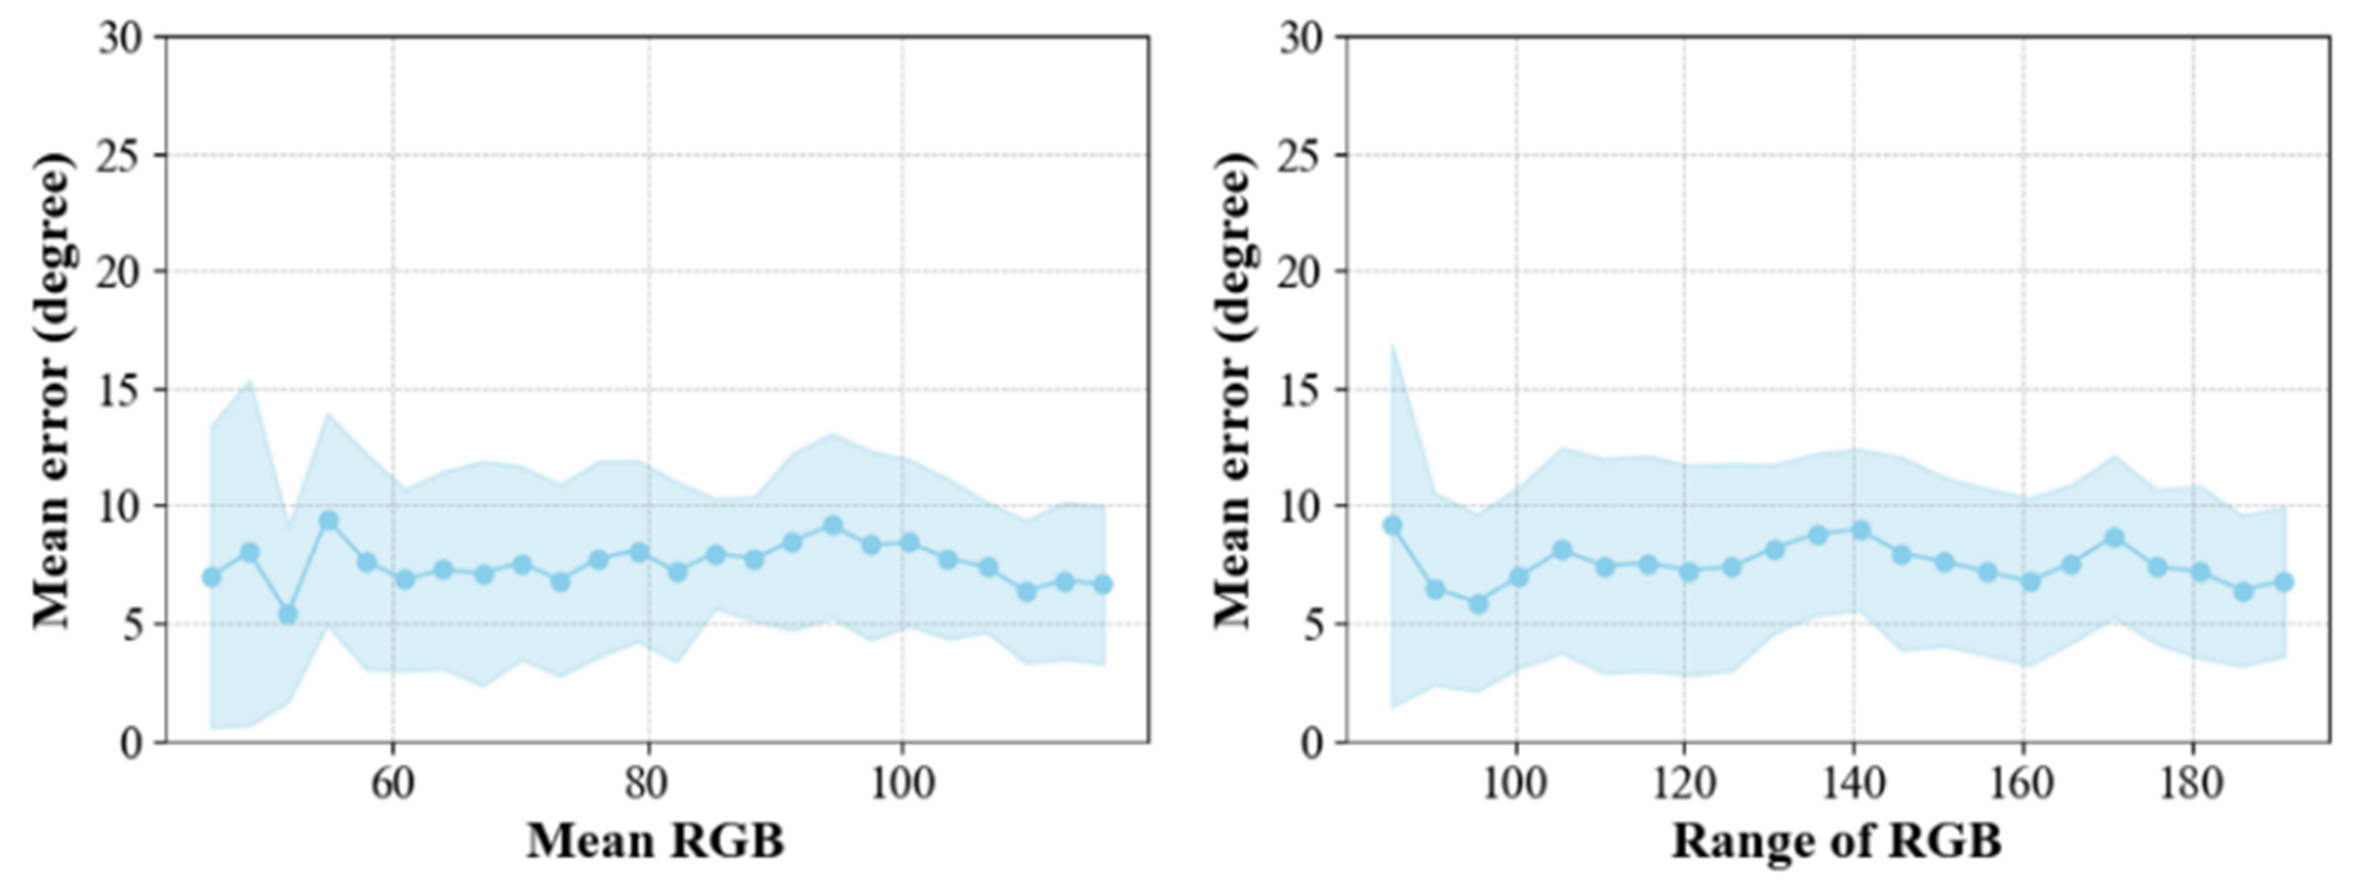
Figure 6. Performance analysis of GPN with different light conditions. The central points indicate the mean values, and the blue shaded regions represent the corresponding variance. GPN: Gaze-Point-Net; RGB: Red, Green, Blue.