
fig5
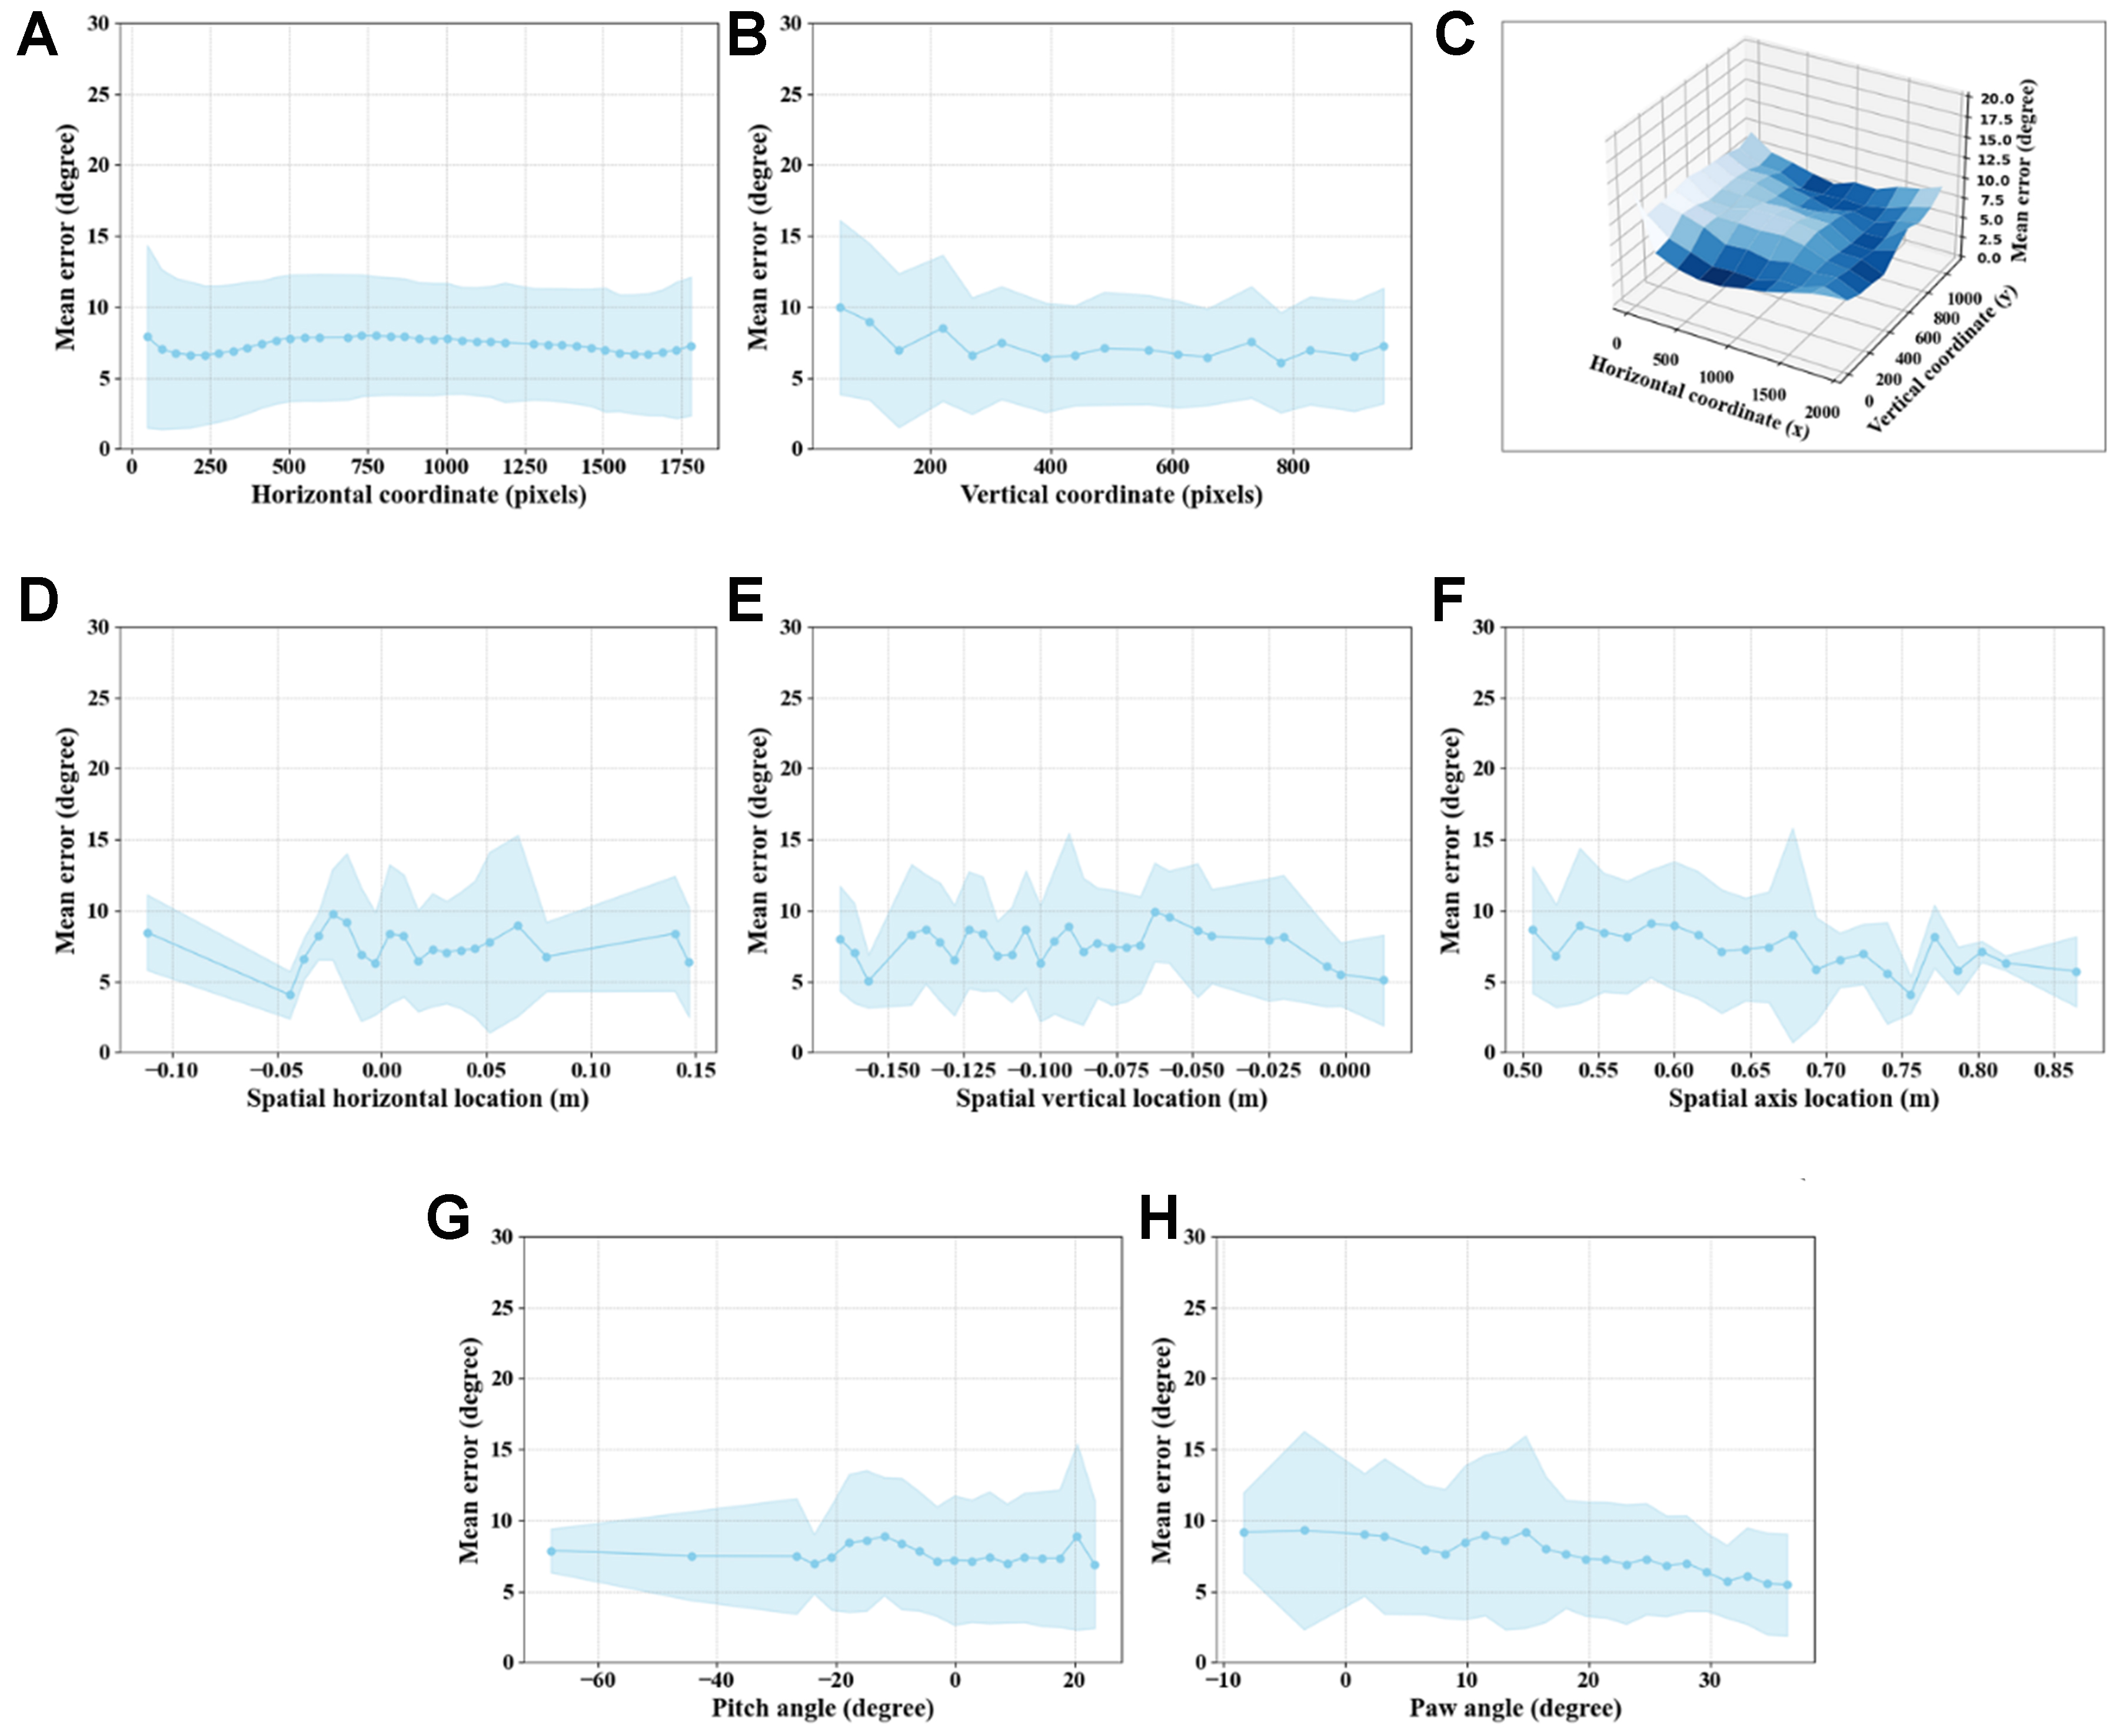
Figure 5. Performance analysis of GPN with different variables. (A) error analysis of the horizontal coordinates of the target points; (B) Error analysis of the vertical coordinates of the target points; (C) Error analysis of the horizontal and vertical coordinates of the target points; (D) Error analysis of the spatial horizontal location of volunteers’ heads; (E) Error analysis of the spatial vertical location of volunteers’ heads; (F) Error analysis of the spatial axis location of volunteers’ heads; (G) Error analysis of the pitch angle of volunteers’ heads; (H) Error analysis of the paw angle of volunteers’ heads. The central points indicate the mean values, and the blue shaded regions represent the corresponding variance. GPN: Gaze-Point-Net.