
fig9
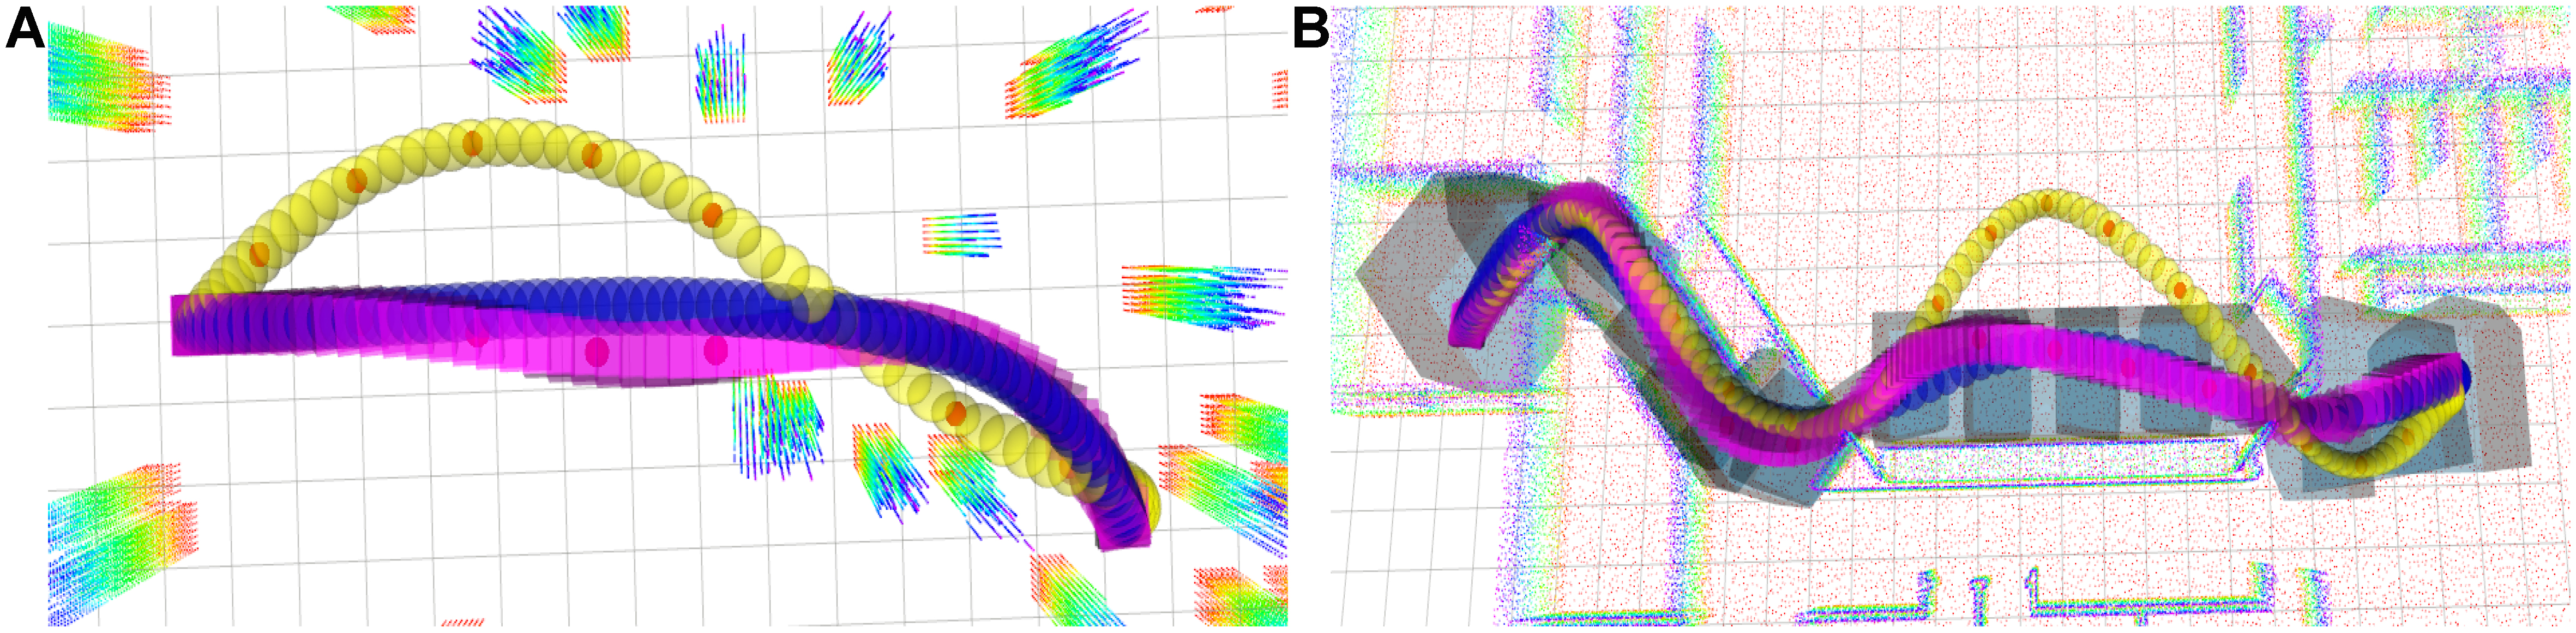
Figure 9. Comparison of the trajectories generated by three methods in two different environments. (A) Trajectories generated by three methods in random forest; (B) Trajectories generated by three methods in Office. The yellow trajectory represents the search-based method (Base-A), the blue trajectory represents the optimization-based method (Base-B), and the purple trajectory represents our proposed method. It can be seen that our method generates trajectories of comparable quality to the optimization-based method and reduces the trajectory calculation time of the search-based method to the millisecond level.