


A hierarchical positioning model for WiFi-based indoor localization in large-scale complex environments
 0
0 Abstract
In developing Wi-Fi indoor positioning systems for large-scale complex environments, the fundamental challenge lies in the significant impact of signal noise on high-frequency data volatility, which substantially degrades positioning accuracy. To address this limitation, we propose an improved hierarchical positioning model combining a Gaussian mixture model (GMM) regional classifier with random forest secondary classifiers. During the offline phase, recognizing that Wi-Fi signal strength typically follows Gaussian distributions, we employed GMM to partition the target area into non-overlapping sub-regions with similar signal strength characteristics. For each sub-region, we then trained dedicated random forest classifiers. In the online phase, the system first identifies the probable sub-region using the GMM classifier before applying the corresponding random forest classifier for precise location estimation. We evaluated our approach in an indoor parking lot featuring an irregular layout, numerous solid walls, scattered access point distribution, and intermittent electromagnetic interference. Experimental results demonstrated that our hierarchical model delivers satisfactory performance for indoor location-based services in such challenging large-scale environments.
Keywords
1. INTRODUCTION
With the rapid development and widespread popularization of mobile Internet, location-based services (LBS) are gaining interest among a wide range of academia and industry[1,2]. The key issue is how to improve the accuracy of Wi-Fi positioning in large-Scale complex environments. According to the circumstances of the target, positioning technology can be divided into outdoor positioning and indoor positioning. Outdoor positioning technologies such as the global satellite positioning system (GPS), the most well-known outdoor LBS, have been successfully applied in real-world settings[3]. Most smart phones are integrated with GPS module, which can be directly utilized for positioning and essentially meets the public needs for outdoor LBS. However, due to the microwave signal’s inability to enter the room via a thick wall, it is difficult for smartphones to capture satellite signals with sufficient strength, leading to the failure of GPS in indoor circumstances[4]. The existence of the defects in GPS is the sheer causation that gives birth to indoor positioning technology.
Indoor positioning has been a long-awaited technology[5]. Many research approaches, such as infrared[6], ultrasonic[7], Wi-Fi[8,9], radio frequency identification (RFID)[10], Bluetooth[11], and so on, have been used in indoor positioning, but these approaches have not gained unified acceptance[12]. In recent years, due to great changes in customer demand and technological evolution, a great number of Wi-Fi access points have been distributed indoors in modern buildings. In addition, most smartphones are integrated with a Wi-Fi wireless network card, which can be used directly for Wi-Fi indoor positioning. Because of these advantages, Wi-Fi indoor positioning bears a high probability of being utilized in indoor LBS extensively. So, how to improve the accuracy of Wi-Fi positioning in large-scale complex environments is still considered a problem worth researching.
In the existing Wi-Fi indoor positioning methods, the fingerprint matching method provides better precision in the complex multi-path environment, and has advantageous features such as convenience, effectiveness and adaptability[13], so it has become the most mainstream Wi-Fi indoor positioning method. The matching method consists of two phases: the offline phase and the online phase. In the offline phase, the main task is to create a radio map, which is composed of the signal strength of the access points collected at each reference point and the corresponding physical location. In the online phase, the main work is to find an effective classifier to estimate the physical location of the point to be located according to the signal strength of the access point collected at the point to be located. The classifier generally adopts deterministic algorithm, which selects the location information with the minimum distance from the fingerprint database through Euclidean geometric distance or Mahalanobis distance.
However, with the rapid expansion of indoor buildings and the large-scale deployment of Wi-Fi infrastructure[14], the impact of signal noise on the volatility of high-frequency data will become increasingly obvious, resulting in a substantial decline in positioning accuracy. The problem we are facing now is how to improve the accuracy of Wi-Fi positioning in large-scale complex environments, such as irregular indoor layouts, numerous solid walls, scattered distribution of access points, intermittent electromagnetic interference, and other interference factors. To resolve the aforementioned problems, researchers have introduced some advanced machine learning algorithms, such as support vector machines (SVM), decision trees (DT), Gaussian Naive Bayes (GNB), adaptive boosting (Adaboost), Bagging, random forest (RF) and multi-layer perceptron (MLP)[15,16]. Besides, some of the researchers have also introduced some statistical analysis methods, such as K-means cluster algorithms[17]. However, when these methods are applied to a large-scale and complex indoor environment, they still cannot obtain satisfactory positioning accuracy.
Recently, the hierarchical positioning strategy has aroused the interest of researchers. Jun et al. firstly employed the K-means cluster algorithm for initial positioning, and then applied random forest to perform secondary classification on the results acquired by initial classification[18]. Through the real implementation, it is found that the approach has achieved favorable results. Biswas et al. firstly employed compressed sensing for coarse localization, and then applied machine learning algorithms for fine localization[19]. Through the experimental verification, satisfactory experimental results have been obtained. Ahmad et al. proposed an approach that integrates fuzzy classifier and hierarchical positioning strategy set to obtain the location of mobile terminals, which has also achieved favorable results[20]. However, the aforementioned hierarchical positioning performance still needs to be further optimized, as they do not take into account the distribution characteristics of Wi-Fi signal strength in a large-scale and complex environment, which is an important optimization factor to improve the accuracy of Wi-Fi positioning in large-scale complex environments.
To address this limitation, we proposed an improved hierarchical positioning model based on a Gaussian mixture model (GMM) regional classifier and a random forest secondary classifier, and the distribution features of Wi-Fi signal strength have been introduced before the establishment of the model of reality scenes. In the offline phase, considering that the distribution characteristics of Wi-Fi signal strength follow a Gaussian distribution, the GMM regional classifier was introduced to partition the to-be-located region into several non-overlapping sub-regions, where the Wi-Fi signal strength distributions are similar to each other. For those sub-regions obtained by the GMM regional classifier, we utilize data samples of sub-regions to construct random forest secondly classifiers respectively. In the online phase, the GMM region classifier is used to obtain region estimation and the corresponding random forest classifier is used to obtain location estimation. To more comprehensively reflect the performance of improved hierarchical positioning model in a large-scale and complex environment, the experiments were conducted in a large-scale indoor parking lot of shopping mall. The experimental results show that the improved hierarchical positioning model can provide satisfactory indoor LBS in a large-scale and complex environment, and effectively improve the accuracy of Wi-Fi positioning in large-scale complex environments.
The remaining content of this paper is arranged into sections as follows: Section 2 introduces the related work of this paper, which includes the construction of a fingerprint data acquisition system and a real-time positioning system. Section 3 gives the mathematical descriptions and mathematical models of the improved hierarchical positioning model. Section 4 shows the experimental design and result analysis. Section 5 summarizes the whole paper, in which recommendations on research in the future are also proposed.
2. RELATED WORK
2.1. The development of fingerprint data acquisition system
The fingerprint data acquisition system mainly completes the location fingerprint map establishment task in the offline stage. To ensure data availability, a fingerprint data acquisition system with good performance is very necessary. According to the characteristics of mobile and continuous operation, mobile devices were chosen to collect the received signal strength indicator. Meanwhile, the Android platform was chosen to develop localized application software as it opens an application programming interface that scans information related to Wi-Fi. The acquisition of localized Android application software can be divided into three tiers, including the presentation tier, business logic tier and data access tier, as shown in Figure 1.
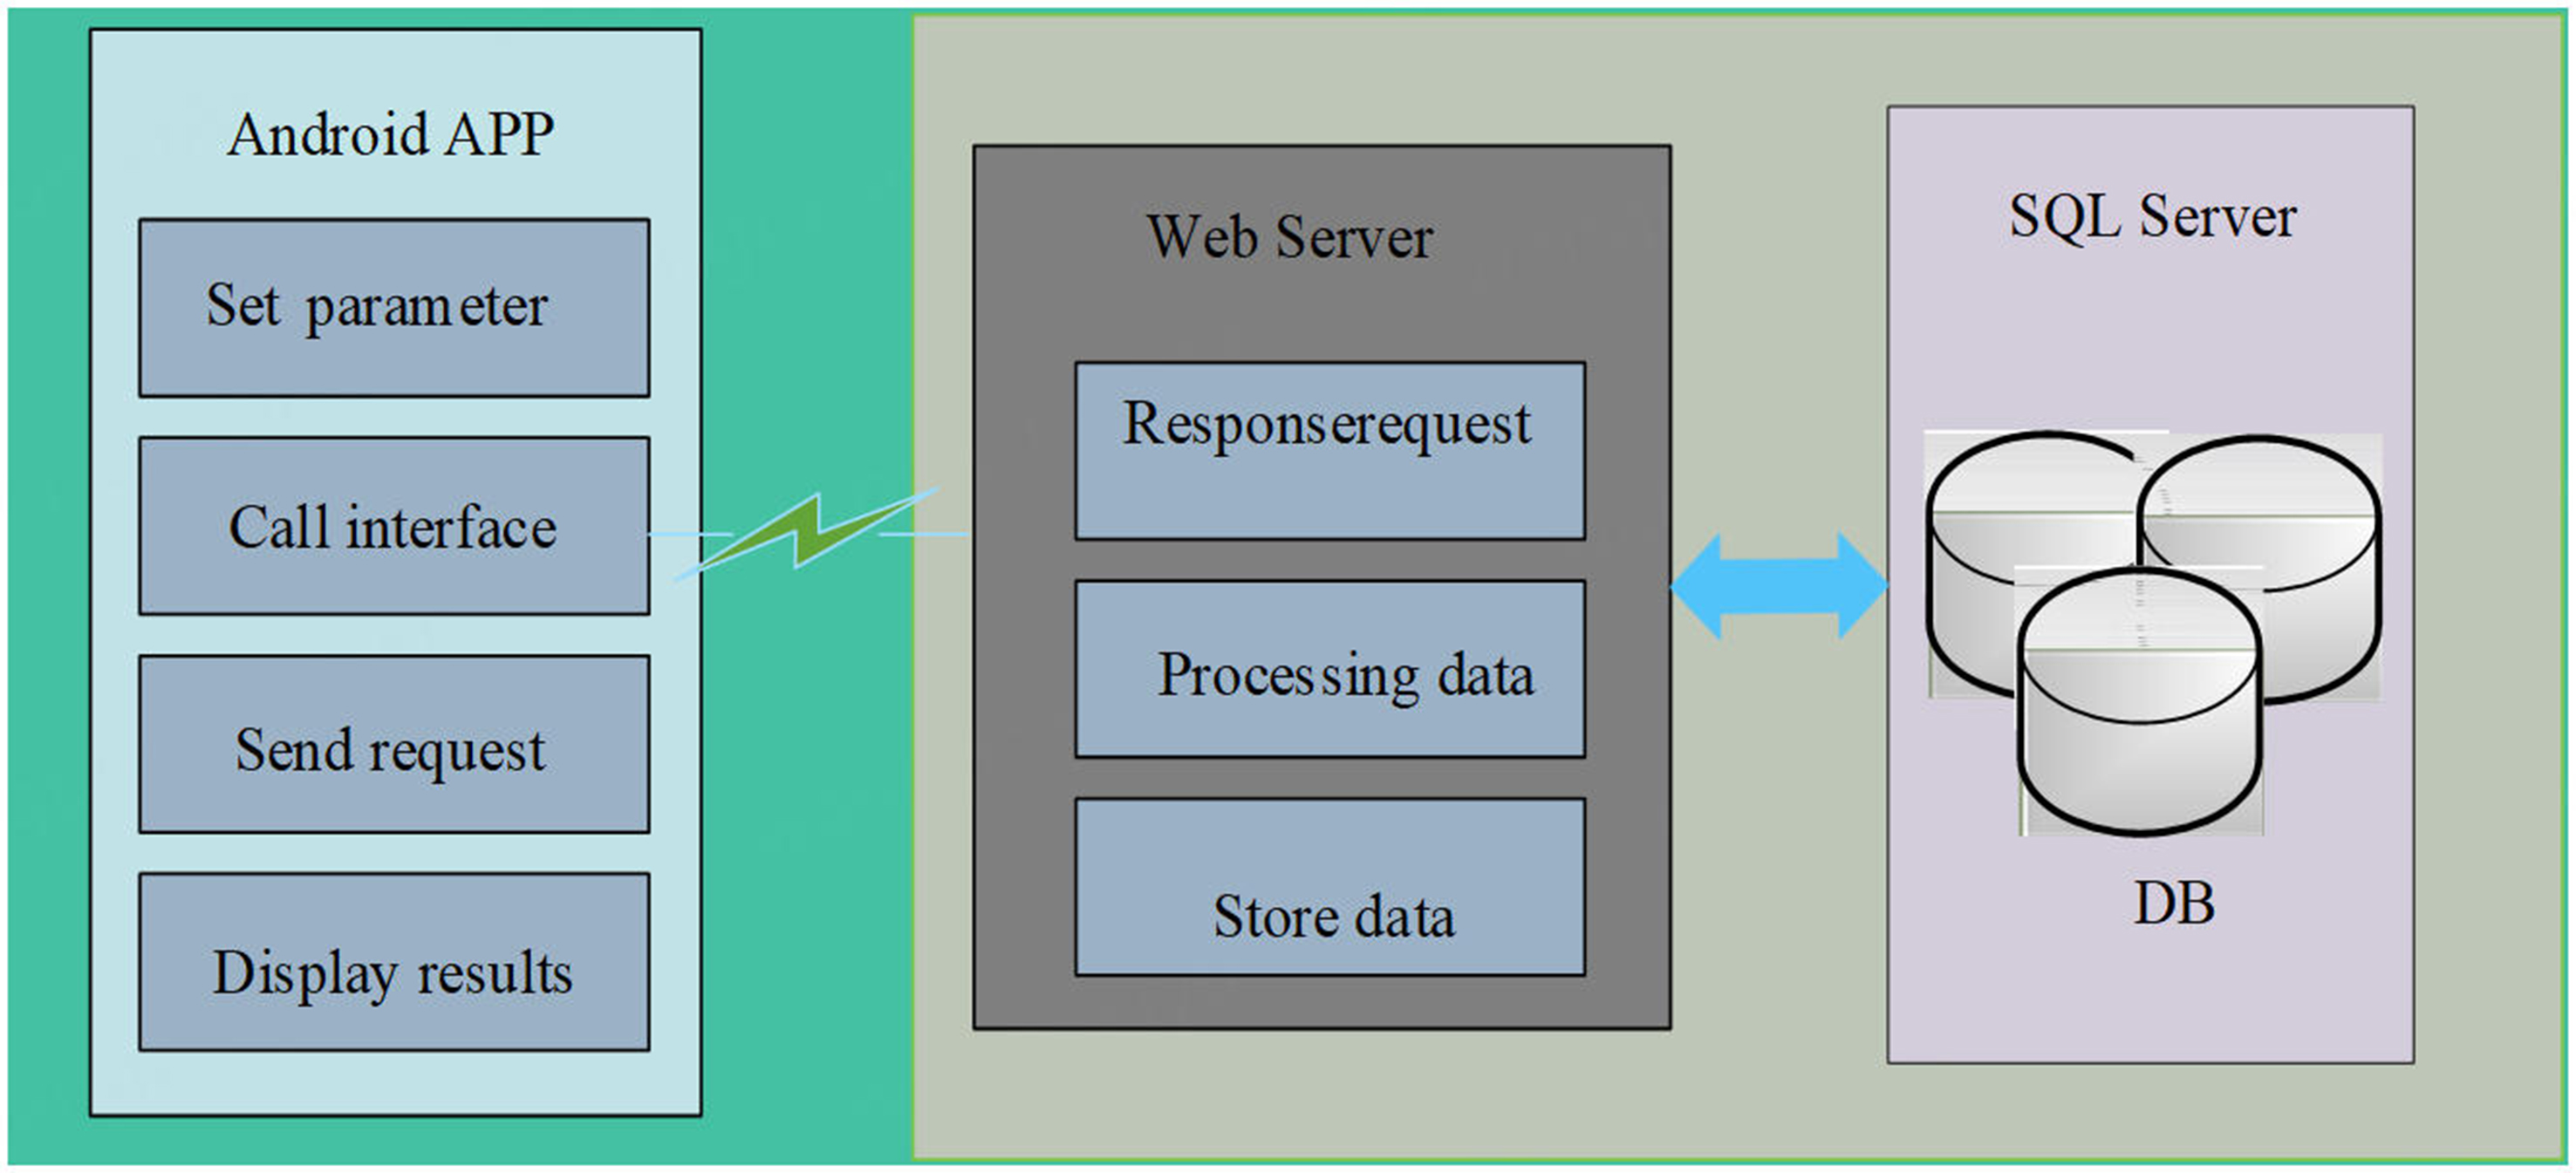
Figure 1. The structure of acquisition of localized Android application software.
The presentation tier mainly presents specific business data to users, such as tips for preparing or completing the collection, and collects user input information and operations, such as each reference point’s physical location information. The business logic tier mainly provides related business logic for the client layer, such as calling interface to scan information related to Wi-Fi, uploading collection data, releasing collection result, and other related business services. The data service tier mainly provides the data support for the operation of the system, such as the storage of data resources, processing of collected data, generation of location fingerprint map files, and other related data services.
2.2. The development of real-time positioning system
The real-time positioning system mainly completes the positioning task by estimating the physical location of the point to be located. To ensure the stability of the system, the real-time positioning system adopts the Android platform to develop client application software and adopts Java programming language to develop service application software. Besides, the positioning model is built by the integrated development environment of Anaconda software, including Python 3.6, numpy, pandas and Scikit-learn. The real-time positioning system can be divided into two parts: client and server, as shown in Figure 2.
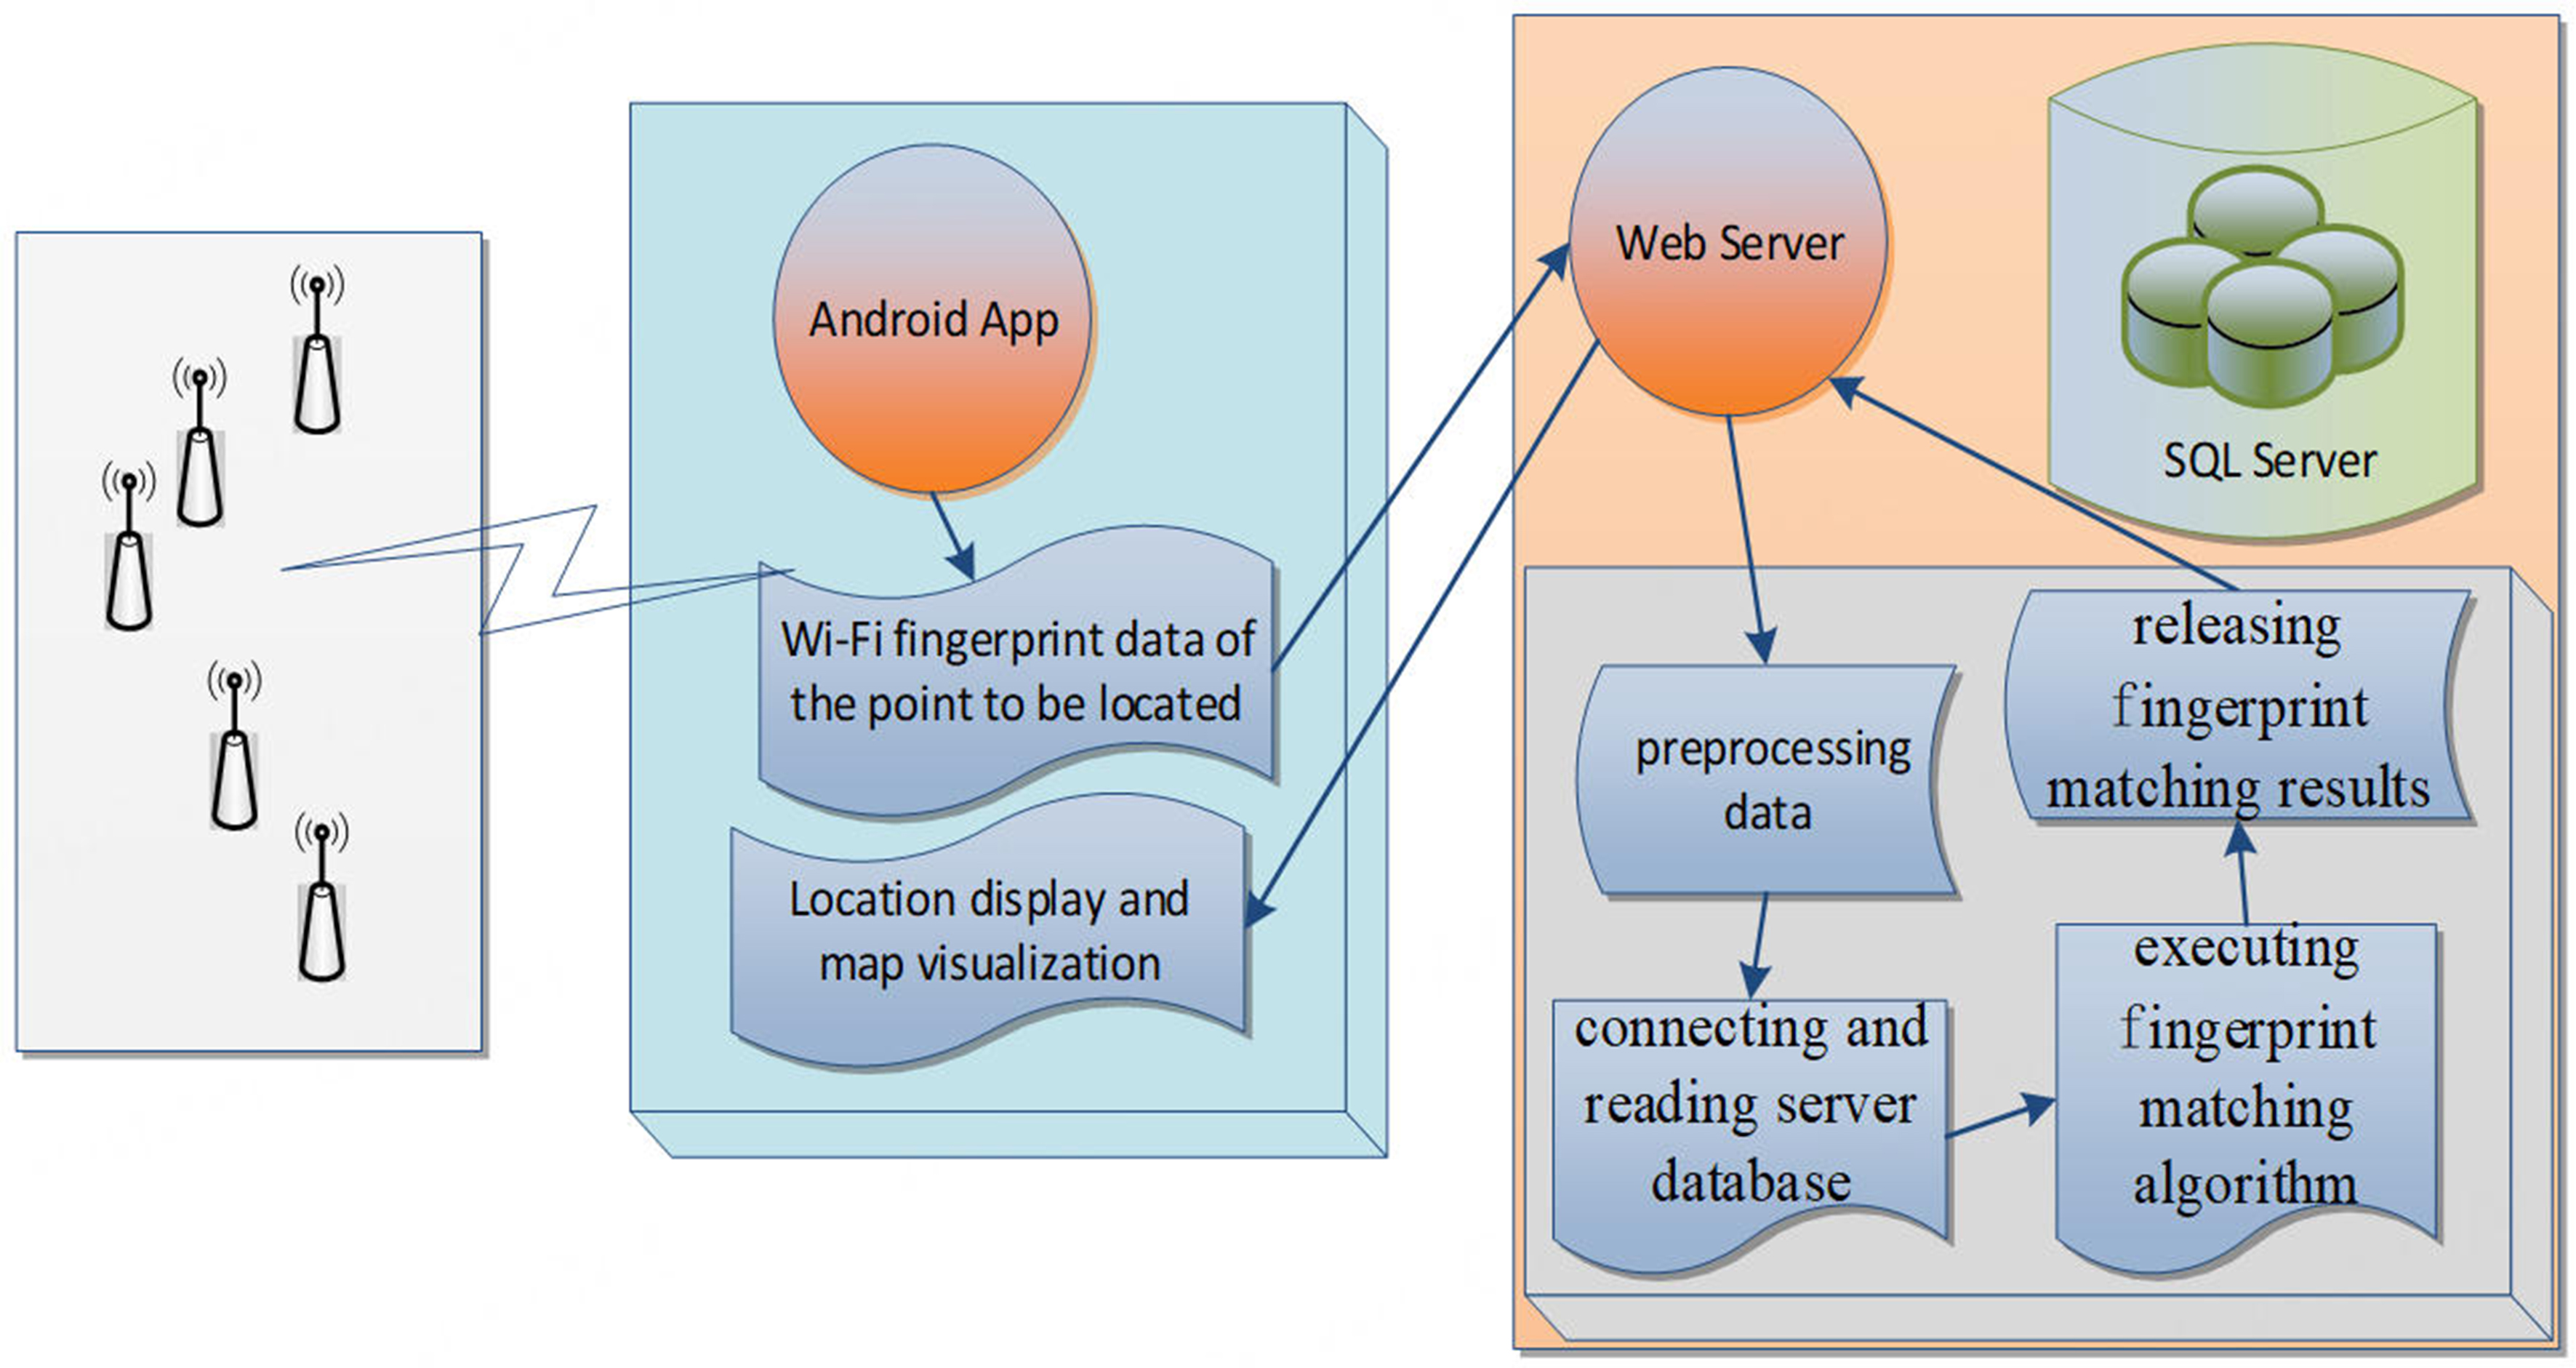
Figure 2. The structure of real-time positioning system.
The client mainly collects Wi-Fi fingerprint data at the point to be located and uploads it to the server. After the server processing is completed, the client presents the estimated location result at the point to be located and shows it on the map. The server mainly provides the functions of receiving Wi-Fi fingerprint data from client, processing Wi-Fi fingerprint data, connecting and reading server database, executing fingerprint matching algorithm and releasing fingerprint matching results to client. Besides, the server database provides the data support for the operation of the system, including the location fingerprint map file established by the aforementioned acquisition localized android application software, and other related data source.
3. PROPOSED METHODS
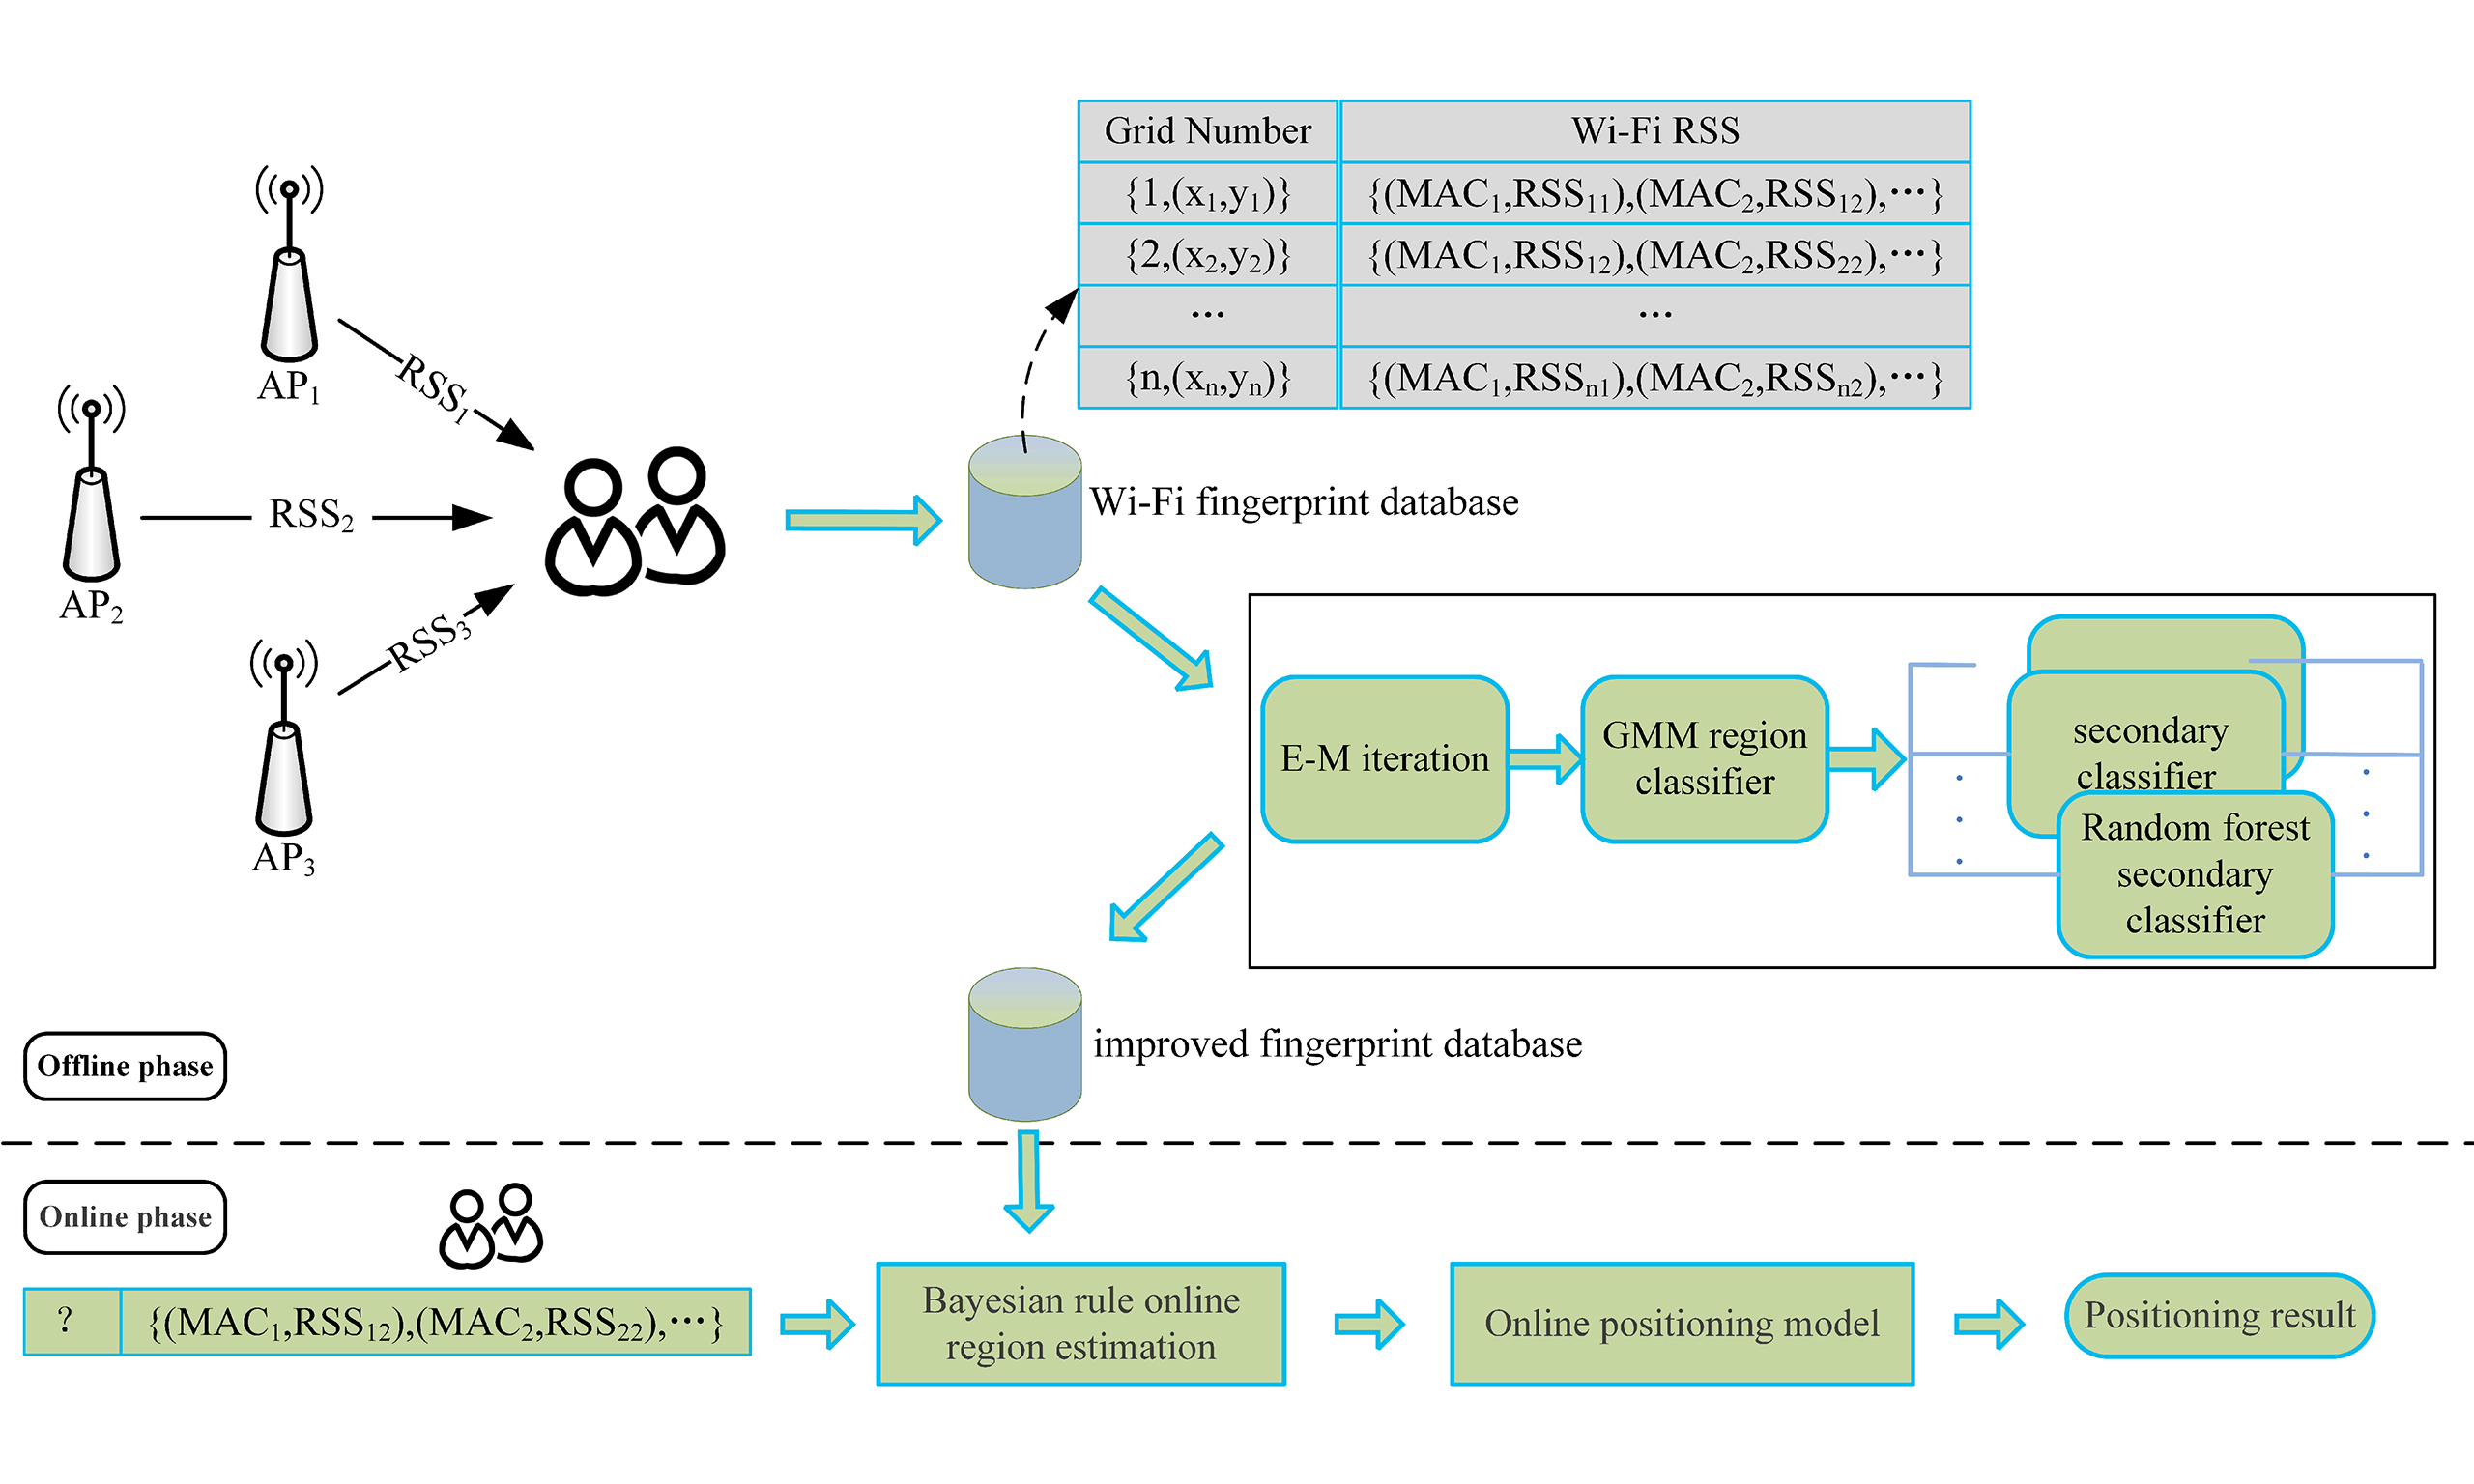
With the impact of signal noise on the volatility of high-frequency data becoming more and more obvious, an improved hierarchical positioning model based on GMM regional classifier and random forest secondary classifier is proposed. Figure 3 shows the algorithm process of the improved hierarchical positioning model. The process is mainly comprised of two procedures: offline training phase and online positioning phase.
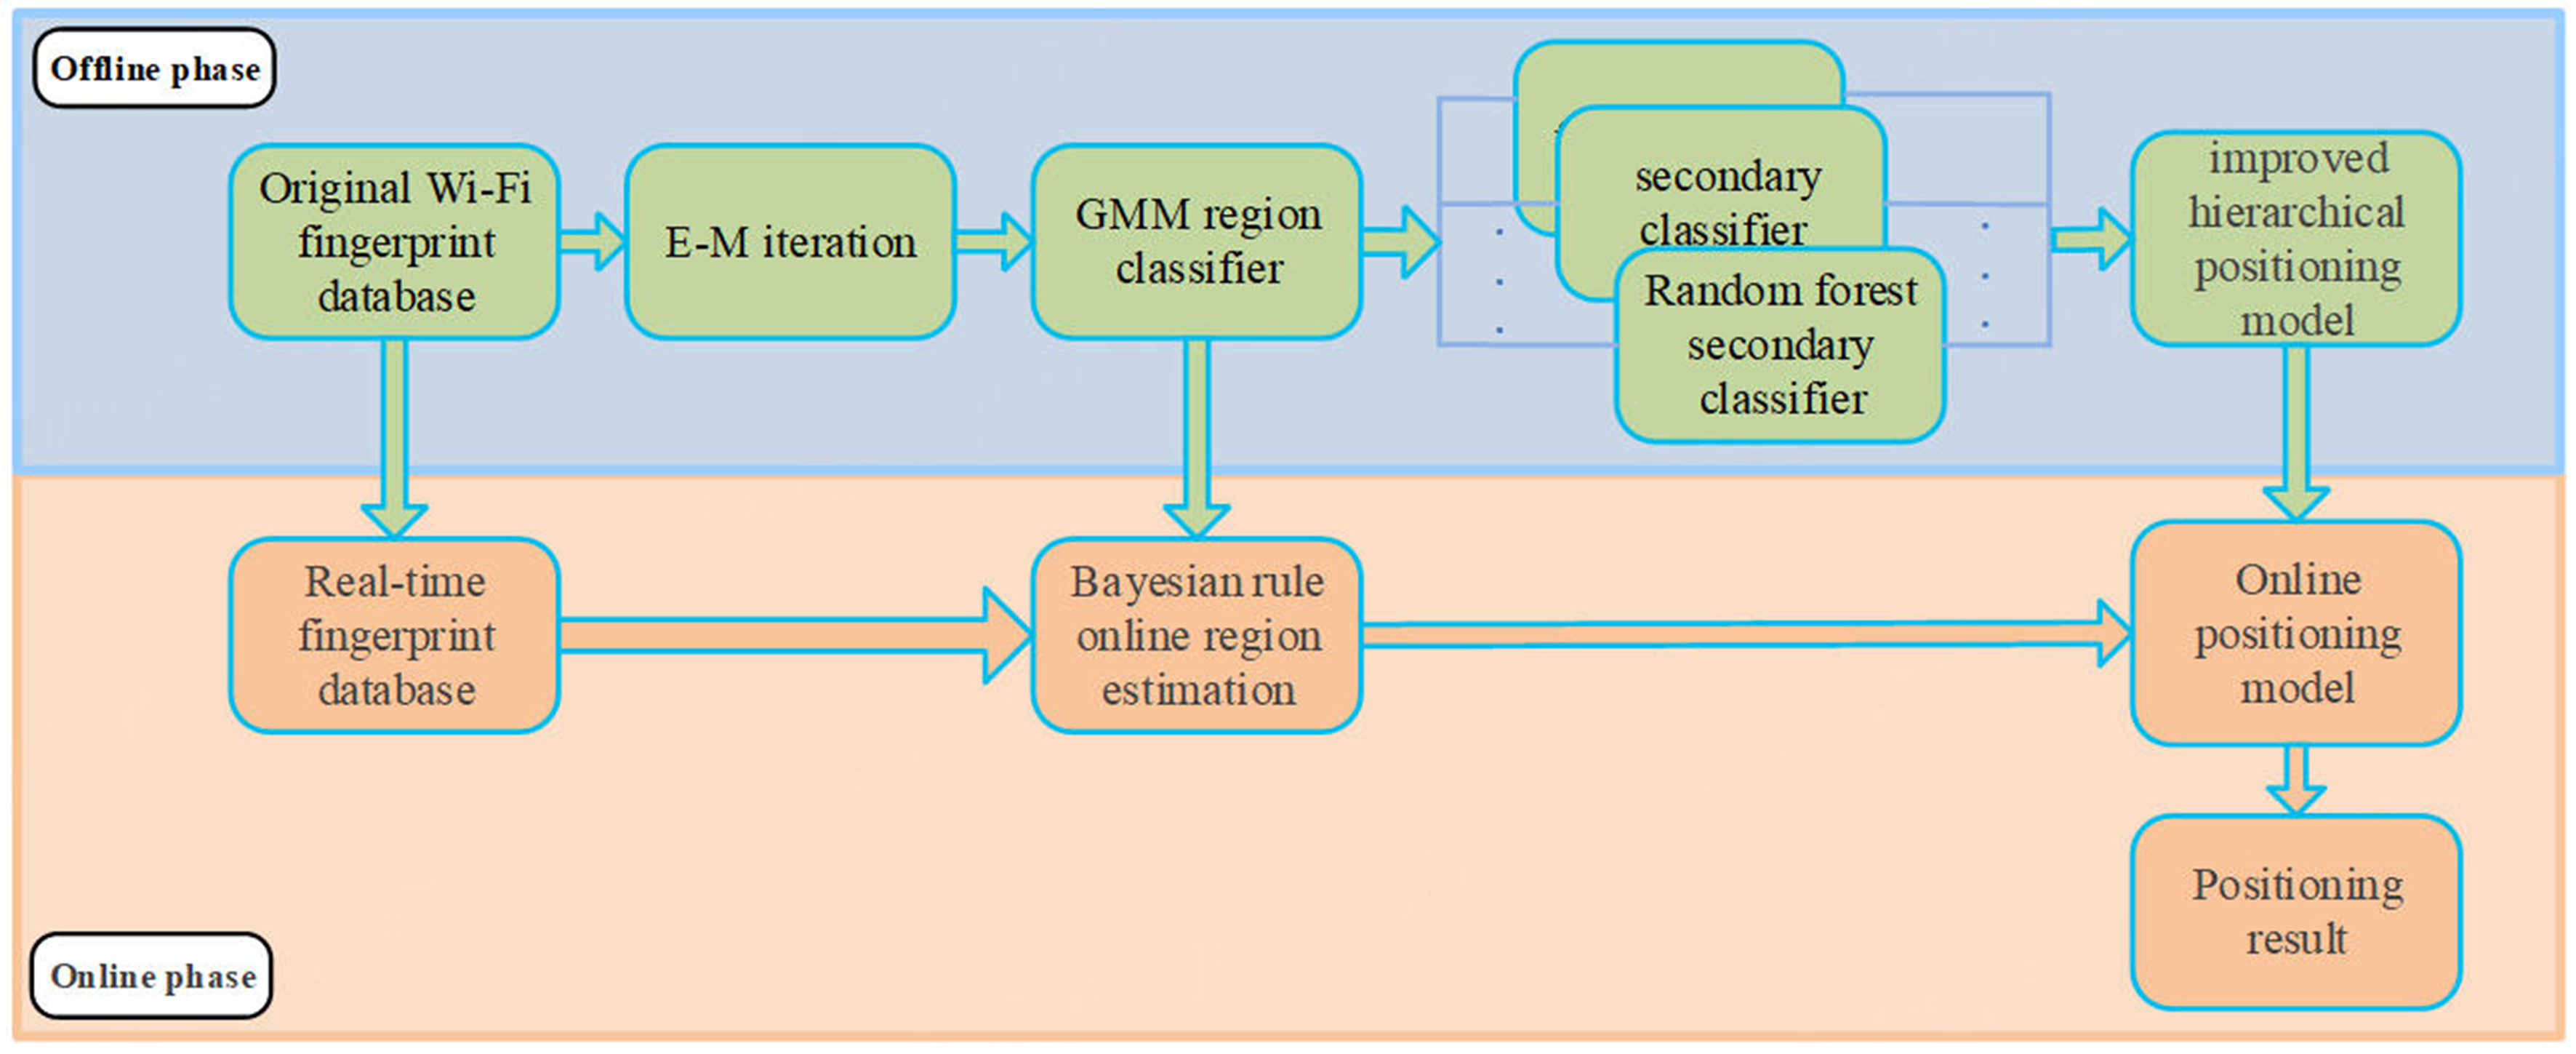
Figure 3. The algorithm process of the improved hierarchical positioning model.
3.1. Offline training phase
The offline training phase comprises two procedures: the construction of regional classifier and the construction of secondary classifier. Firstly, the GMM regional classifier is introduced to partition the to-be-located region into several non-overlapping sub-regions, where the Wi-Fi signal strength distributions are similar to each other. For those sub-regions obtained by the GMM regional classifier, we utilize data samples belonging to same sub-regions to train random forest classifiers, thus achieving specific random forest Classifiers for different sub-regions.
3.1.1. The construction of regional classifier
Theoretical research and experimental results show that, the received signal and the propagation distance are logarithmic[21] and the path loss conforms to the logarithmic distance path loss model[22]. After observing the received signal strength vectors obtained at multiple sampling points, it can be found that the spatial distribution model of wireless signals transmitted by each access point (AP) is approximately a two-dimensional Gaussian distribution model, as shown in Figure 4. In addition, Wi-Fi location fingerprint is mainly composed of received signal strength from multiple APs, which can be regarded as a multi-dimensional vector. As a result, the location fingerprint can be assumed to be a mixture of several multi-dimensional Gaussian distributions, each of which describes the distribution characteristics of the received signal strength of a group of sampling points.
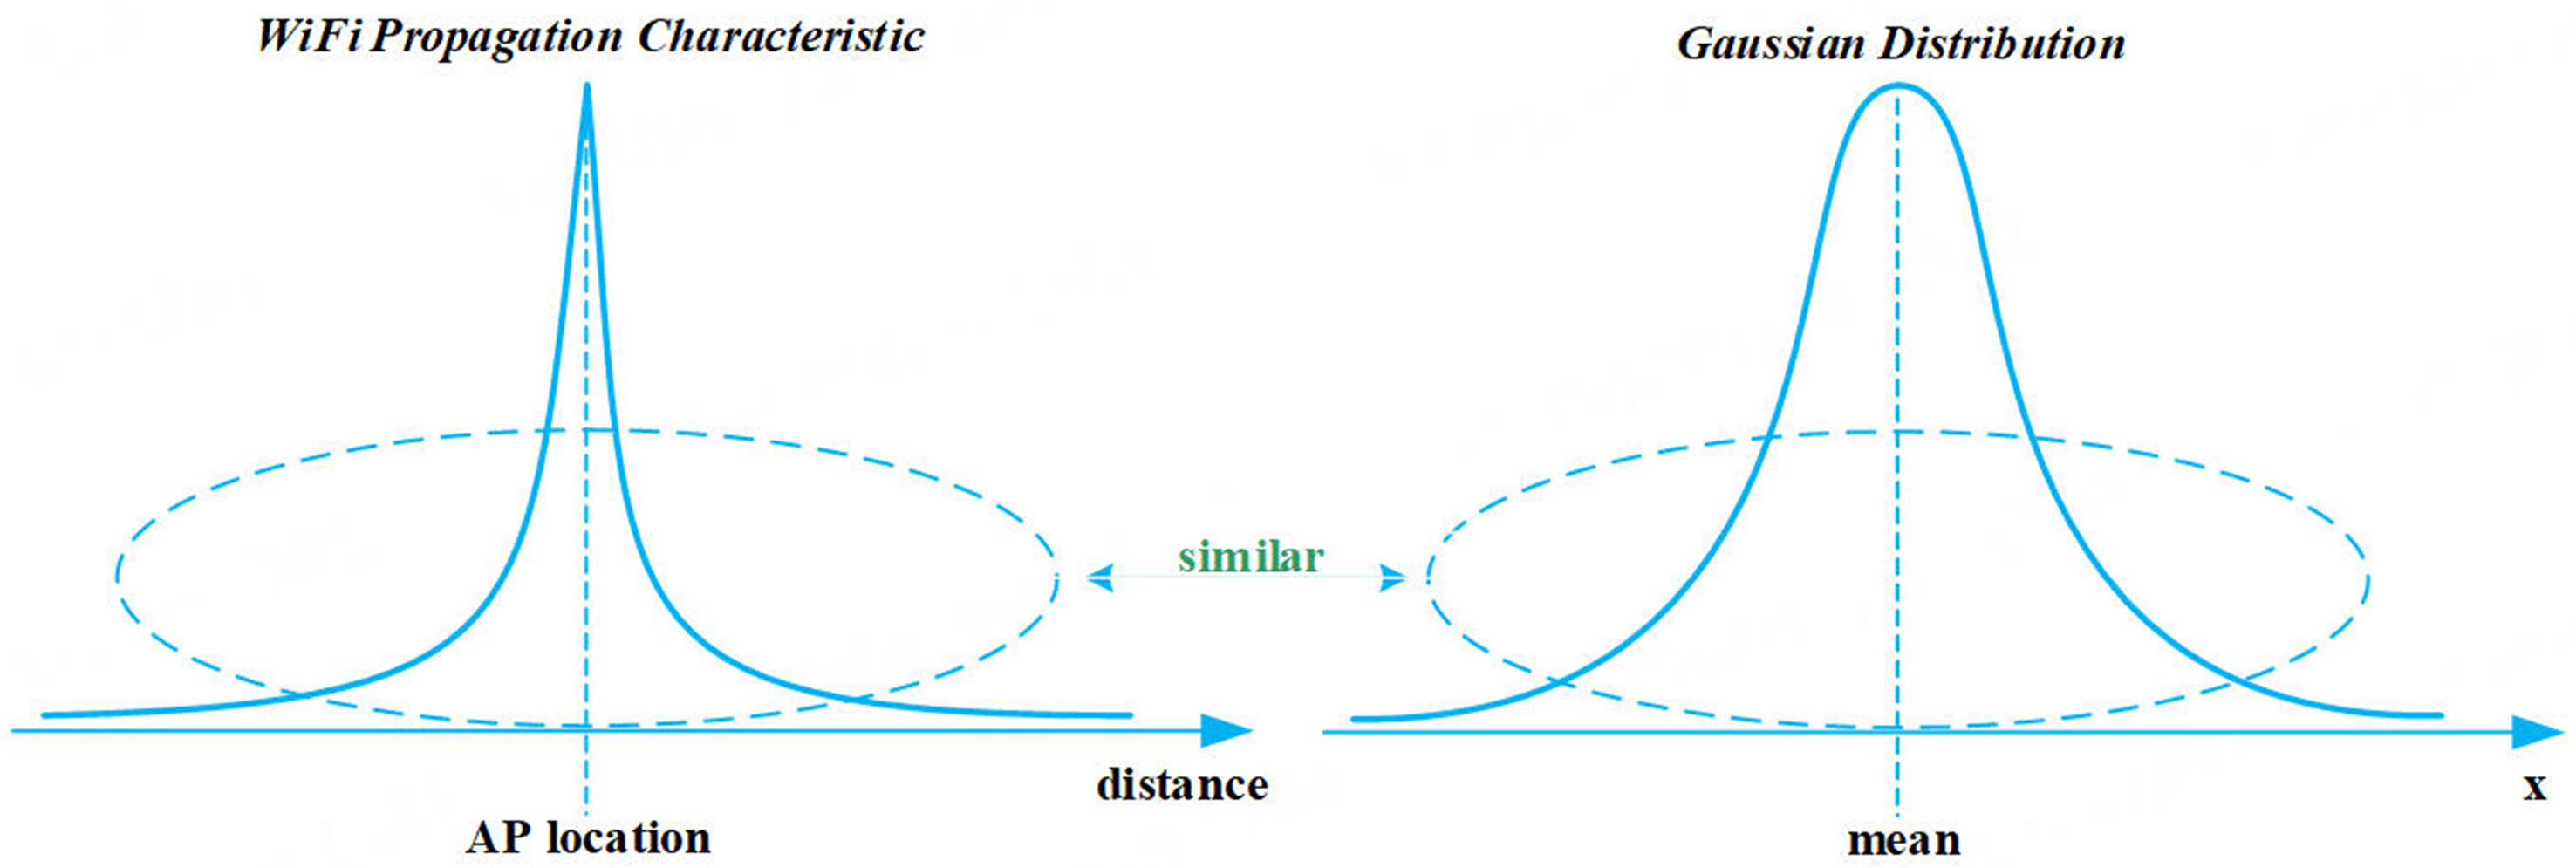
Figure 4. Wi-Fi propagation characteristic and Gaussian distribution.
In this paper, the GMM regional classifier is adopted to acquire several non-overlapping sub-regions in the to-be-located region. GMM is a probabilistic model used to represent the distribution of data composed of multiple Gaussian (normal) distributions. This approach is particularly effective for capturing multi-modal data characteristics and is well-suited for clustering analysis of heterogeneous datasets or probability density estimation tasks. Assuming that the data point in the space of received signal strength is a sample that submits to k Gaussian probability density mixture distributions[23], and then its combined probability distribution can be expressed in
in which αk is the weight, satisfying
in which d is the dimension of the received signal strength vector, μk is the mean value and Σk is the covariance function.
To sweep out the GMM region classifier, the E-M algorithm is adopted as it has been proven to be an effective approach for estimating weight of GMM αk, mean value μk and covariance functions Σk, which is partitioned into steps of Expectation and Maximum[24,25].
Expectation-step: the purpose of this step is to obtain hidden variables, which can be expressed as the posterior probability p(k|xi, Φ(t)) of xi in class k. Given the optimal numbers of GMM component X = {x1, x2, …, xn} and initial parameter Φ(0) or estimated parameter Φ(t) = (α(t), β(t)) in step t, among which β(t) = (μ(t), Σ(t)), the hidden variable p(k|xi, Φ(t)) can be expressed as:
Maximum-step: the purpose of this step is to obtain MLE estimator parameters of the (t + 1) iteration, the hidden variable obtained in the previous step is substituted into MLE estimator of αk, μk and Σk. Therefore, MLE estimator parameters of the (t + 1) iteration can be expressed as:
Then it is about to judge the termination condition ||Φk(t+1) - Φk(t)||
3.1.2. The construction of secondary classifier
On the basis of the several non-overlapping sub-regions is established in the previous step, secondary classifier can be selected and applied in each sub-regions. Considering that the data set at the same sub-region have similar characteristics, we choose random forest algorithm to perform as the algorithm of secondary classifier as it has better robustness and fault tolerance for the similar dataset[26]. The random forest algorithm is an integrated classifier composed of a set of decision tree classifiers, and each generated decision tree is conducted in a random manner. Specifically, each decision tree acquires the classification results respectively, and then vote on these classification results, the category having the greatest Number of Votes shall be the prediction results of random forest[27]. The construction process of random forest secondary classifier is shown in Figure 5.
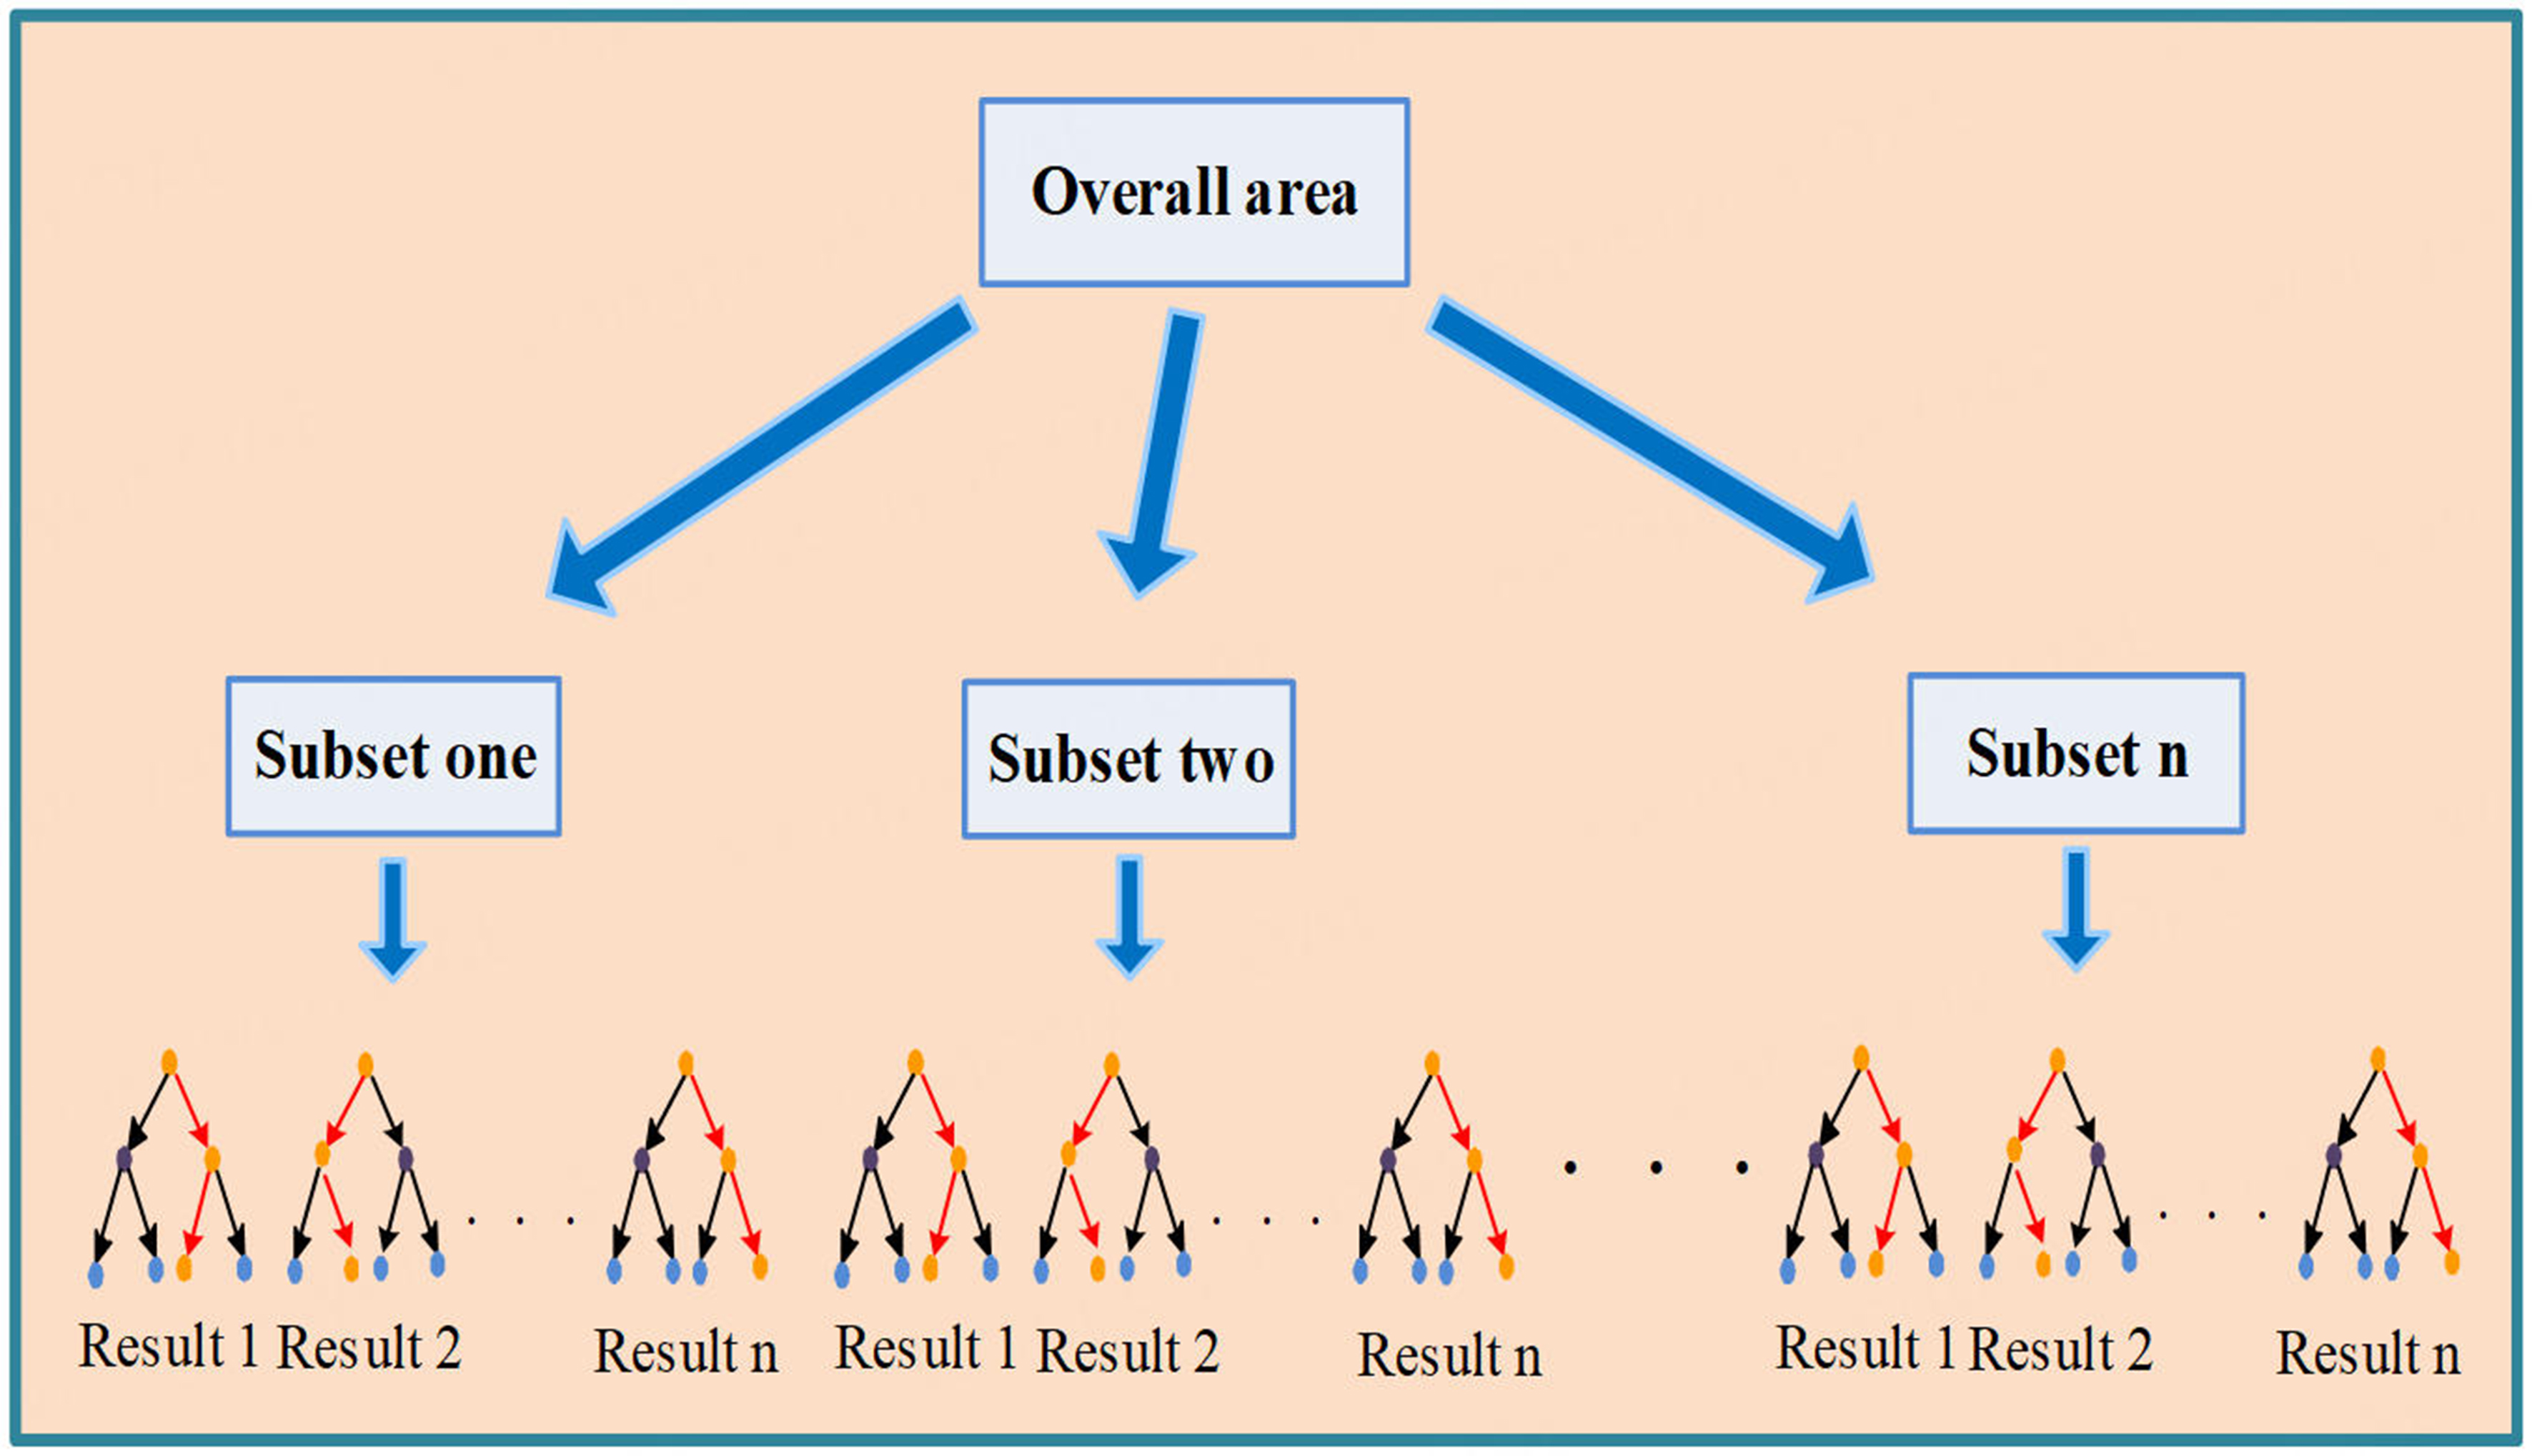
Figure 5. The construction process of random forest secondary classifier.
The construction method of random forest secondary classifier in each sub-regions adopts a special bagging method, which uses decision tree as the model in bagging. Firstly, the bootstrap sampling method is used for random sampling of N groups of sample data, M samples are extracted to construct M basic decision trees and the remaining N-M samples are used as out of bag data to verify the accuracy of M decision trees. Secondly, in the construction process of the M basic decision tree, the sub attribute set is randomly generated from the attribute set of the node, and the optimal sub attribute is selected to construct the decision tree[28]. After that, each decision tree begins to branch recursively from top to bottom, and the minimum size of leaf node is set as the termination condition of decision tree growth, which ensures the accuracy of model construction. In the end, M decision tree is used as the basic classifier set, and the voting method is combined with strategy to make the final decision.
3.2. Online positioning phase
The online positioning phase comprises two procedures: online regional identification and online secondary classification. For the signal strength of the access points at the point to be located comes from, the GMM region classifier is used to obtain online region estimation and the corresponding random forest classifier is employed to obtain online location estimation.
3.2.1. Online region estimation
After the establishment of the GMM model, the received signal strength indication (RSSI) observations obtained at an unknown position in the online phase are introduced into the GMM, and the criteria of Bayes maximum posterior probability are adopted to achieve the online estimation of the region that the reference point locations[29]. The principle is presented as follows:
Assuming that there is a set of RSSI observations obtained from unknown positions, in order to confirm the divided region where the unknown positions are located, a formula can be introduced as follows:
The GMM obtained through the training phase is adopted to represent the probability distribution in different divided location regions. The RSSI observations obtained at the unknown positions are acknowledged as X = (x1, x2, …, xn). The posterior probability of each point to be located from Gaussian distribution of the k-th class is:
where αk represents the prior probability of the Gaussian distribution density of the k-th class; p(xi, βk) indicates the probability density of the feature vector xi that belongs to the k-th class. The sample that complies with the criteria of posterior probability proposed by a certain class can be expressed as:
where k* represents the final result of online region estimation. Its forward result can be equivalent to knowing which divided region the signal strength of the access points at the point to be located comes from.
3.2.2. Online location estimation
After knowing which divided region the signal strength of the access points at the point to be located comes from, the corresponding random forest secondly classifier is used to online obtain location estimation. Assuming that the GMM classifier divides the signal strength of the access points at the point to be located X = (x1, x2, …, xn) into sub-region k*, and the corresponding random forest secondly classifier RFk is employed to perform secondary classification on X = (x1, x2, …, xn). The result of the classification is given by a set of confidence values as follows:
4. EXPERIMENT AND DISCUSSION
4.1. Description of experimental environment
To evaluate the proposed hierarchical positioning model effectively in a large-scale and complex indoor environment, we specially selected an indoor parking lot of large shopping center to carry out the experiment, as it has the characteristics of irregular indoor layout, numerous solid walls, scattered distribution of access points and intermittent electromagnetic interference. The indoor parking lot selected covers a total region of 2,000 square meters and included 150 parking spaces. Meanwhile, we detected that there were 16 access points installed in the indoor parking lot intending to provide customers with Internet access. The real indoor parking lot and AP device are shown in Figure 6. In order to make the interior plan more concise and obvious, the top view of the indoor parking lot employed for the experiment is shown in Figure 7, in which the small rectangular grid represents a real parking space with a size of 2.0 m × 5.0 m and the sign of signal source represents an access point.
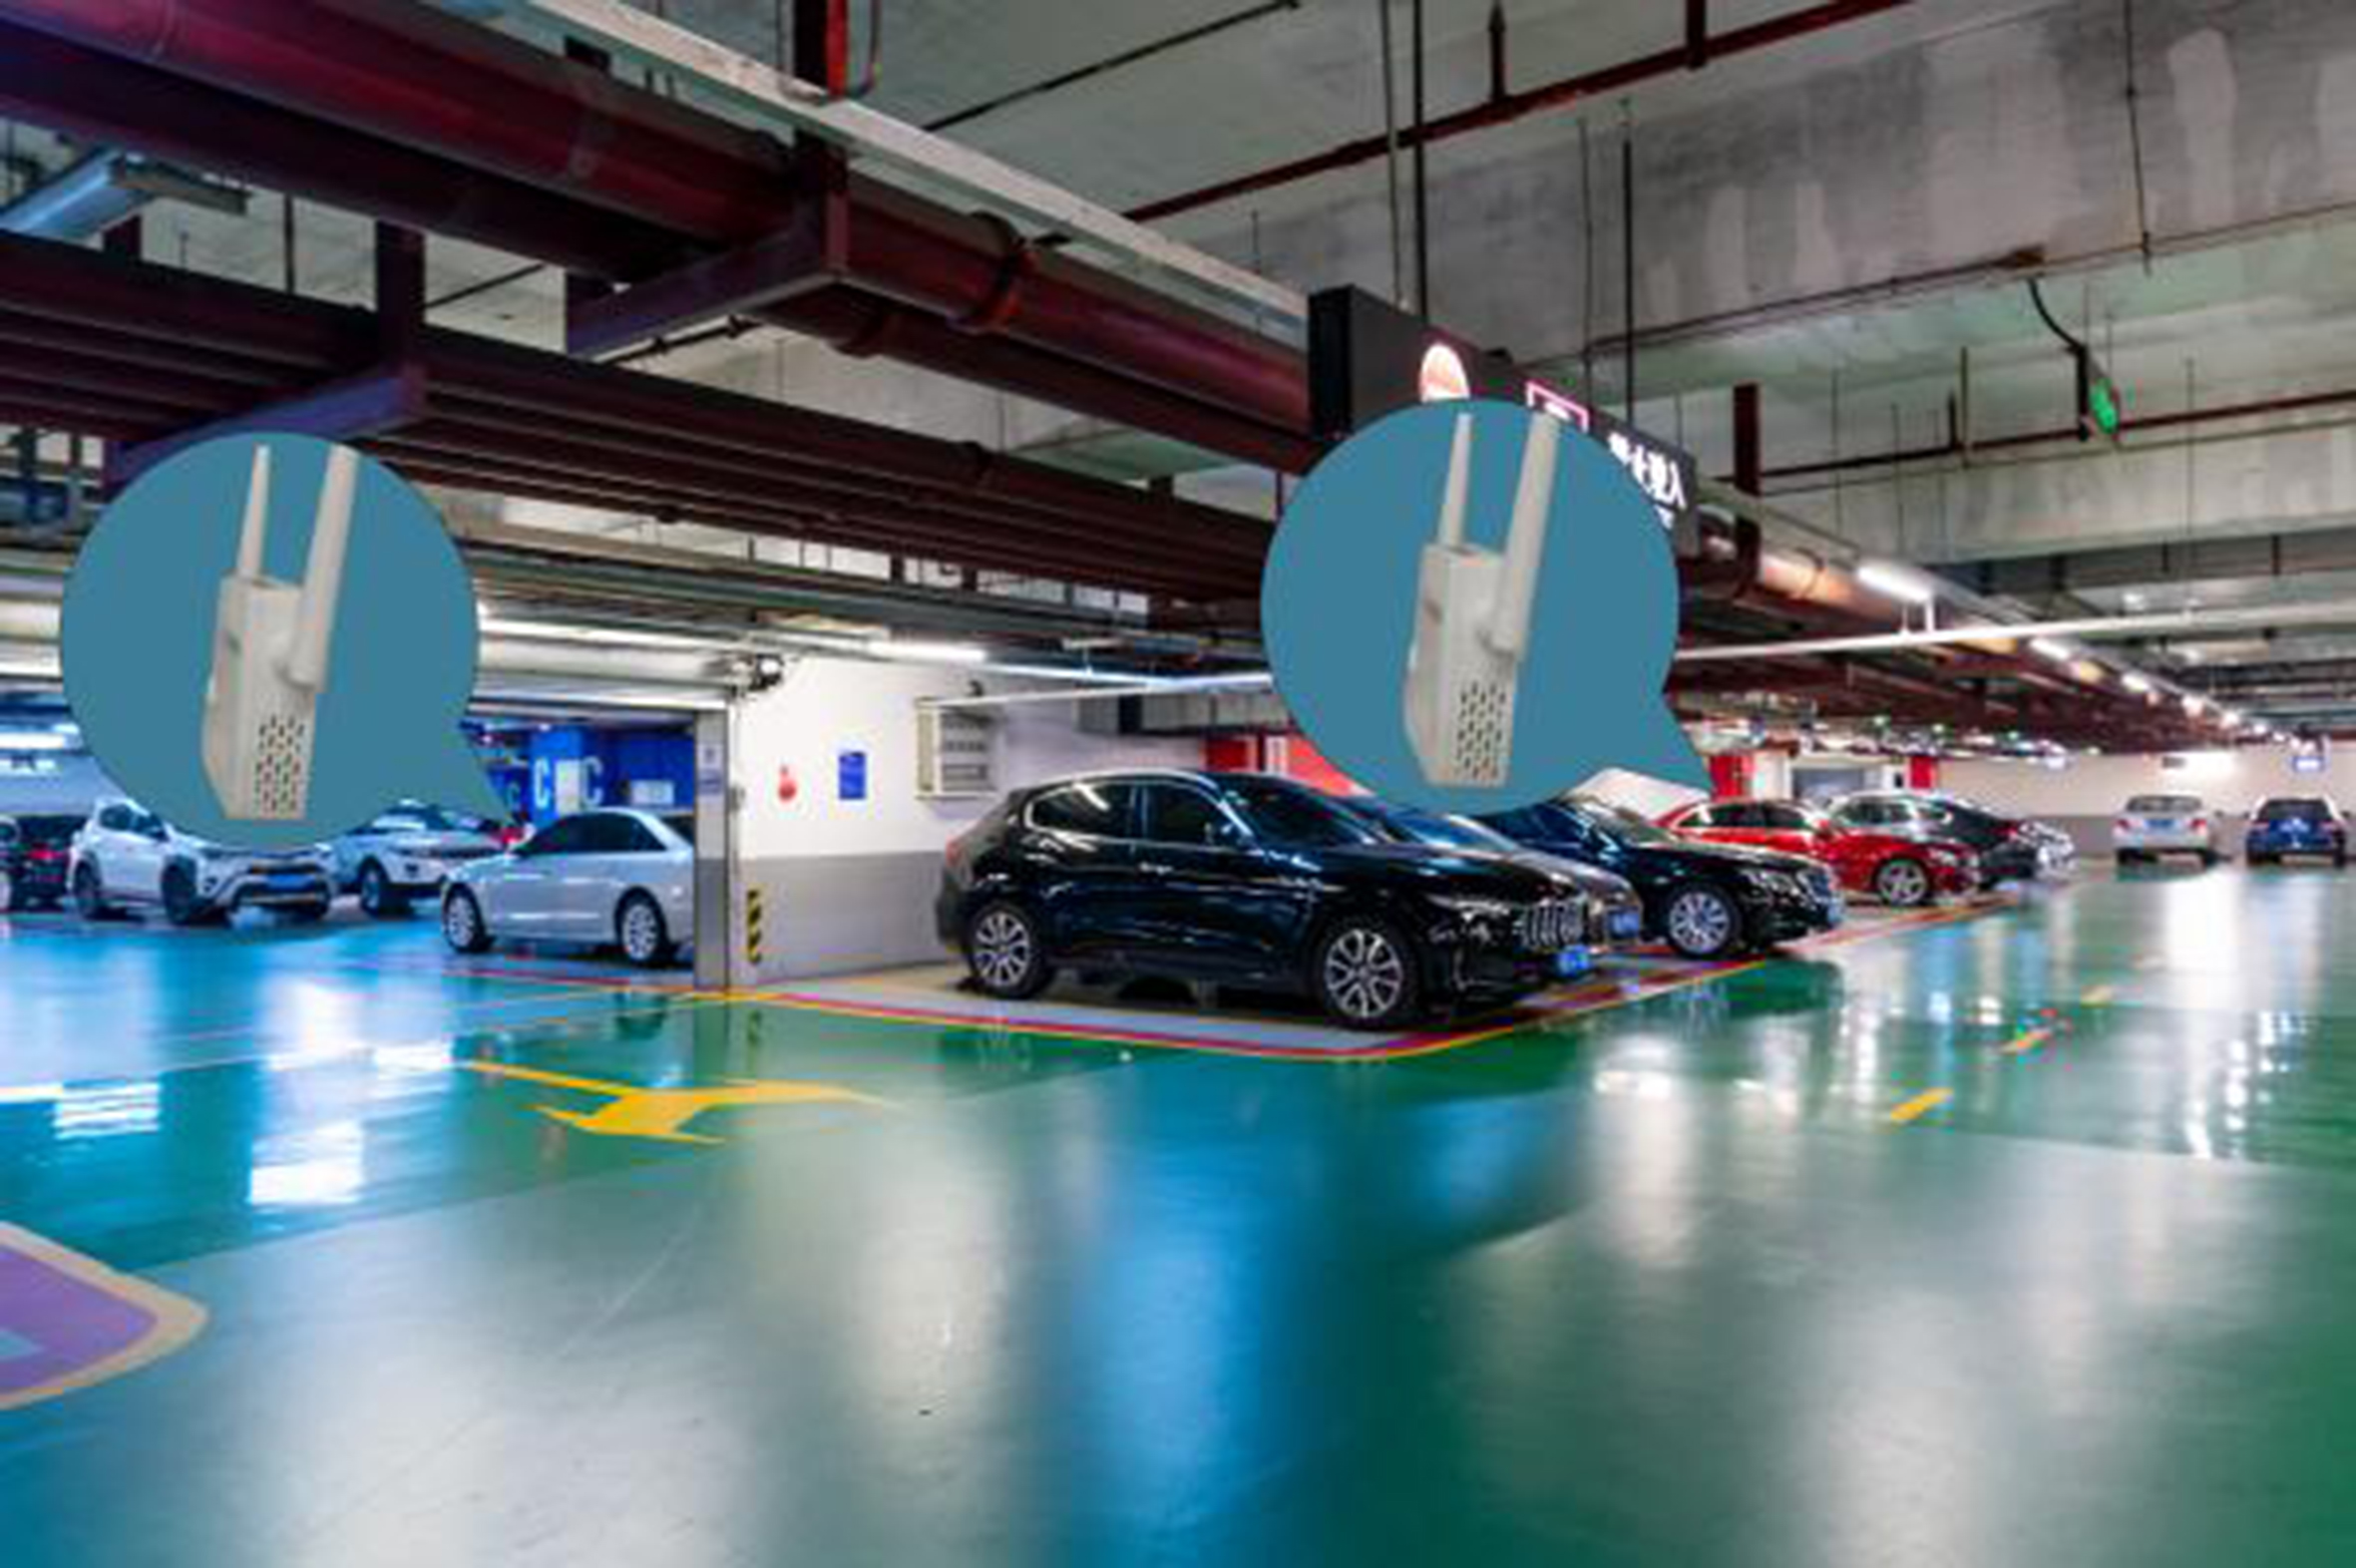
Figure 6. The real indoor parking lot and AP device (photograph taken by the authors).
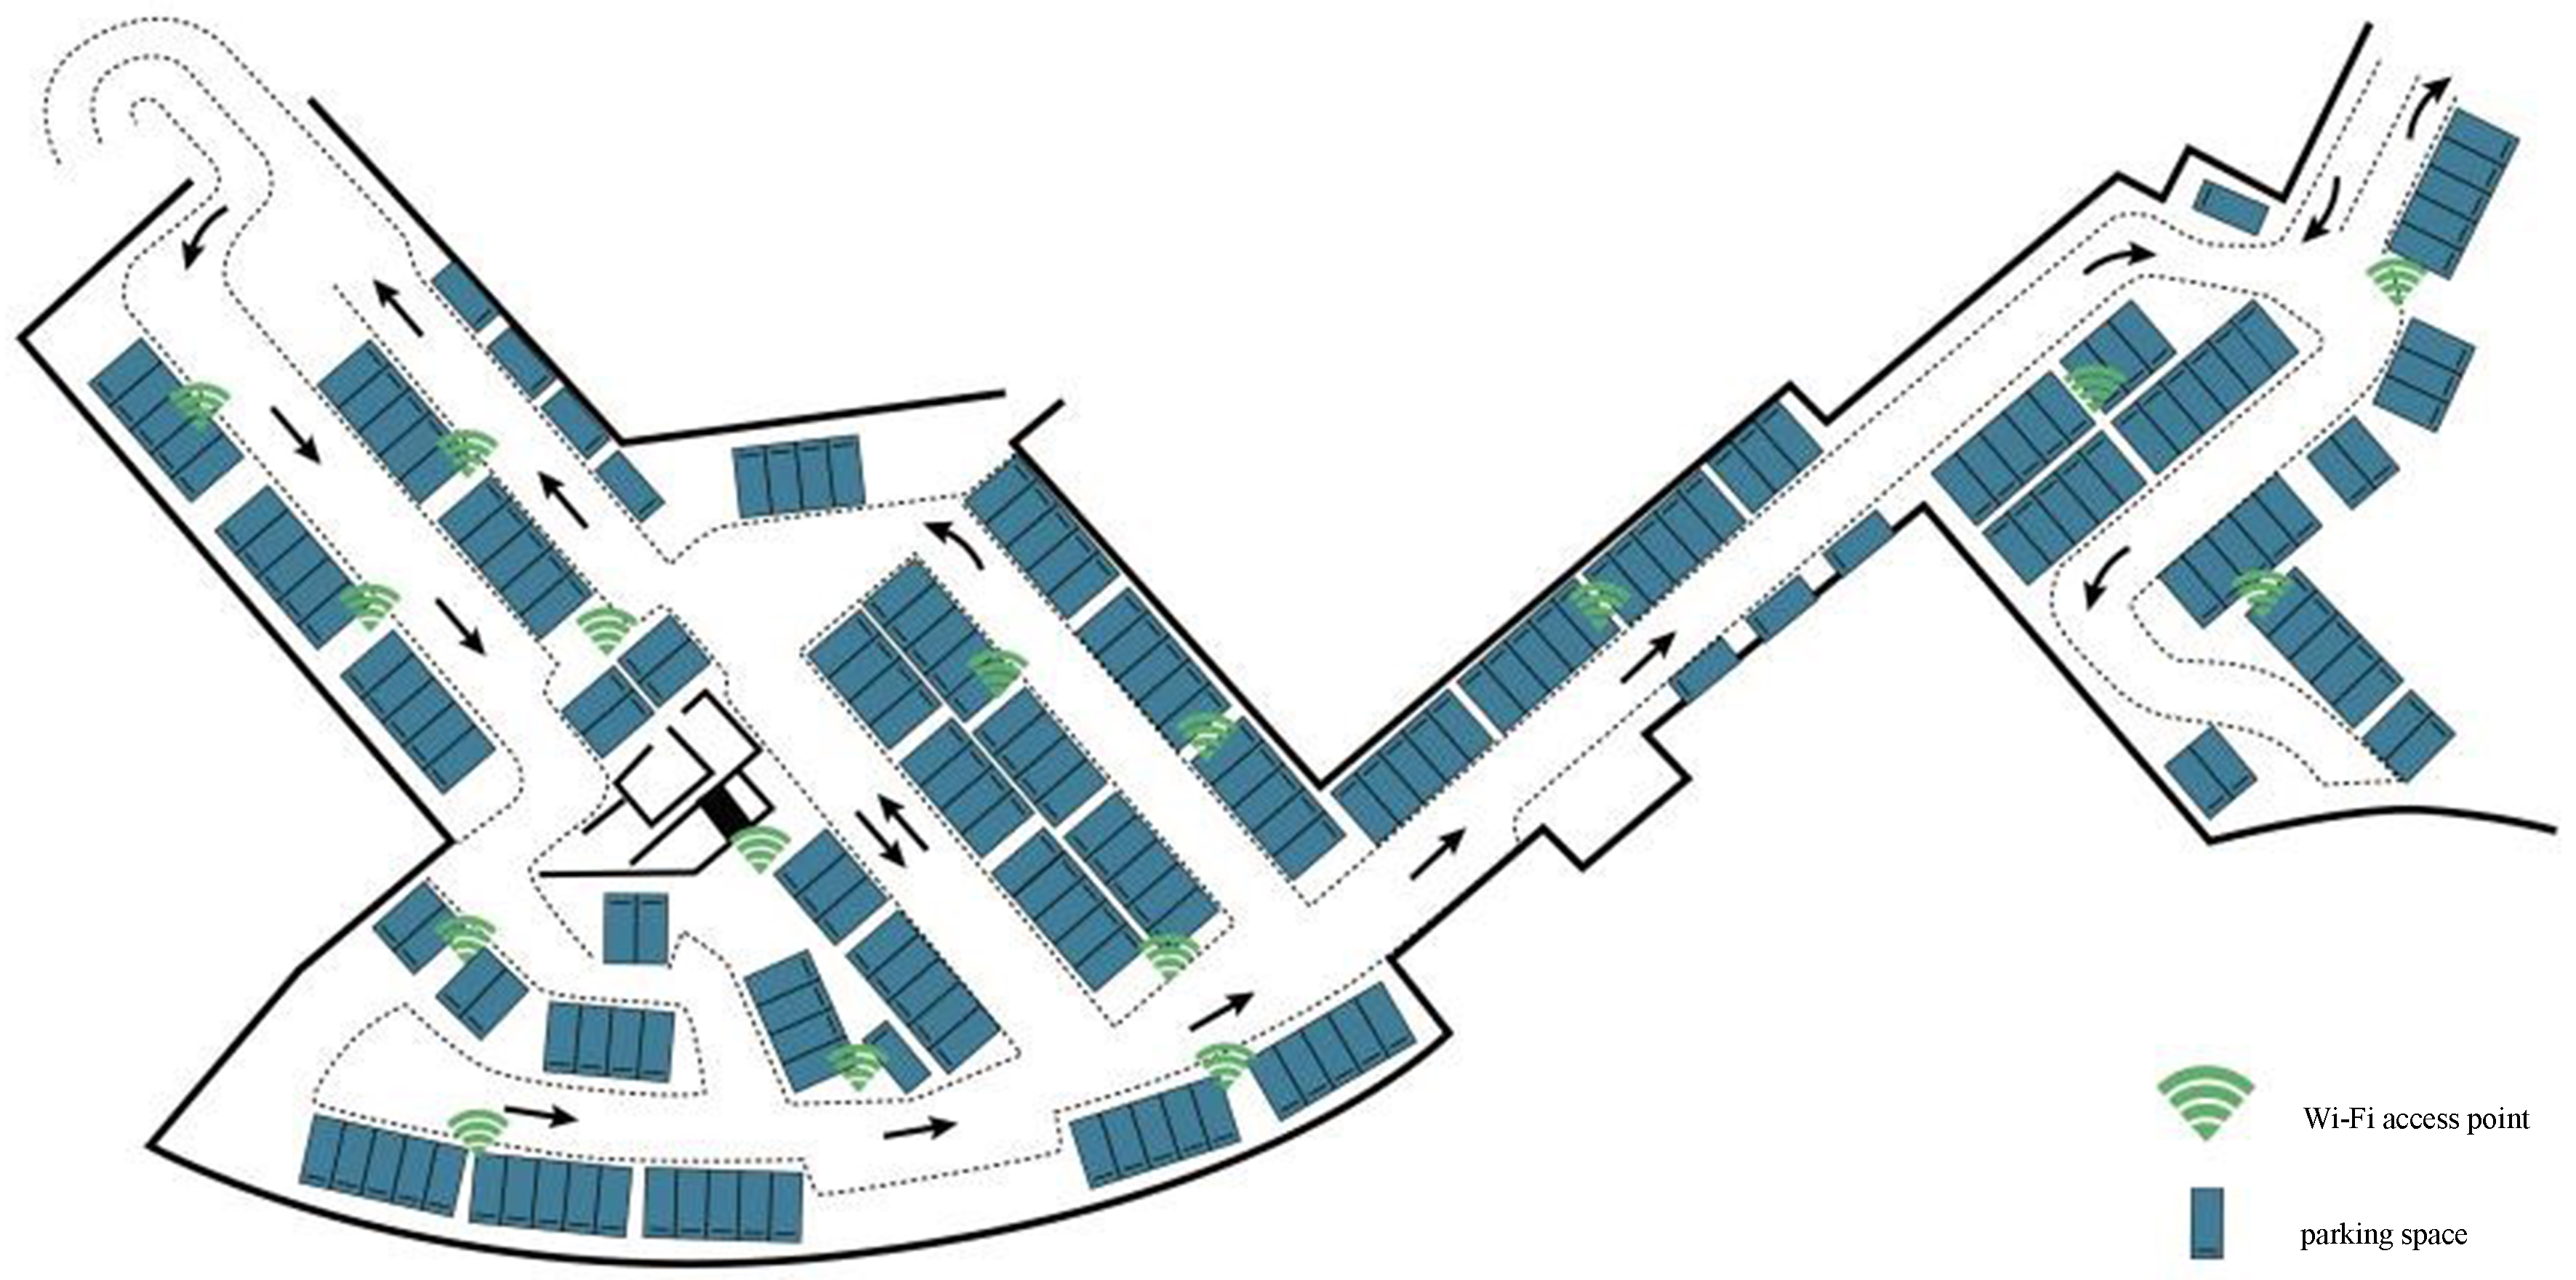
Figure 7. The top view of the indoor parking lot employed for the experiment.
4.2. Preparation for the experimental samples
Considering that the Wi-Fi signal is particularly sensitive to the surrounding body, scene change and mobile phone types[30,31], some sample collection strategy must be considered when we prepare the experimental samples. Firstly, in order to alleviate the influence of the human body orientation on the Wi-Fi signals, the observer with the smartphone should face east, south, west and north in turn to collect samples in each direction. Secondly, in order to solve the problem of scene change, as it takes too long to create an RSSI fingerprint map in practical applications, we collect the training samples and test samples in different periods, which avoids the high similarity of samples in the same period and improves the practical application effect of the algorithm. Finally, in order to abate the impact of the mobile phones of various models on the Wi-Fi signals, the Wi-Fi data from multiple mobile phones of different models ought to be collected in each direction at each reference point.
On the basis of the above collection strategy, in this paper, three different mobile phones of Huawei Honor 3C, Xiaomi MIX2, and 360N5 were chosen to collect samples in the experiment. Then we used each mobile phone to collect 400 training samples in each parking space, with 100 training samples in each direction multiplied by four directions. A week later, we used each mobile phone to collect 40 test samples in each parking space using this method, with 10 test samples in each direction multiplied by four directions. The data storage structure is shown in Figure 8.
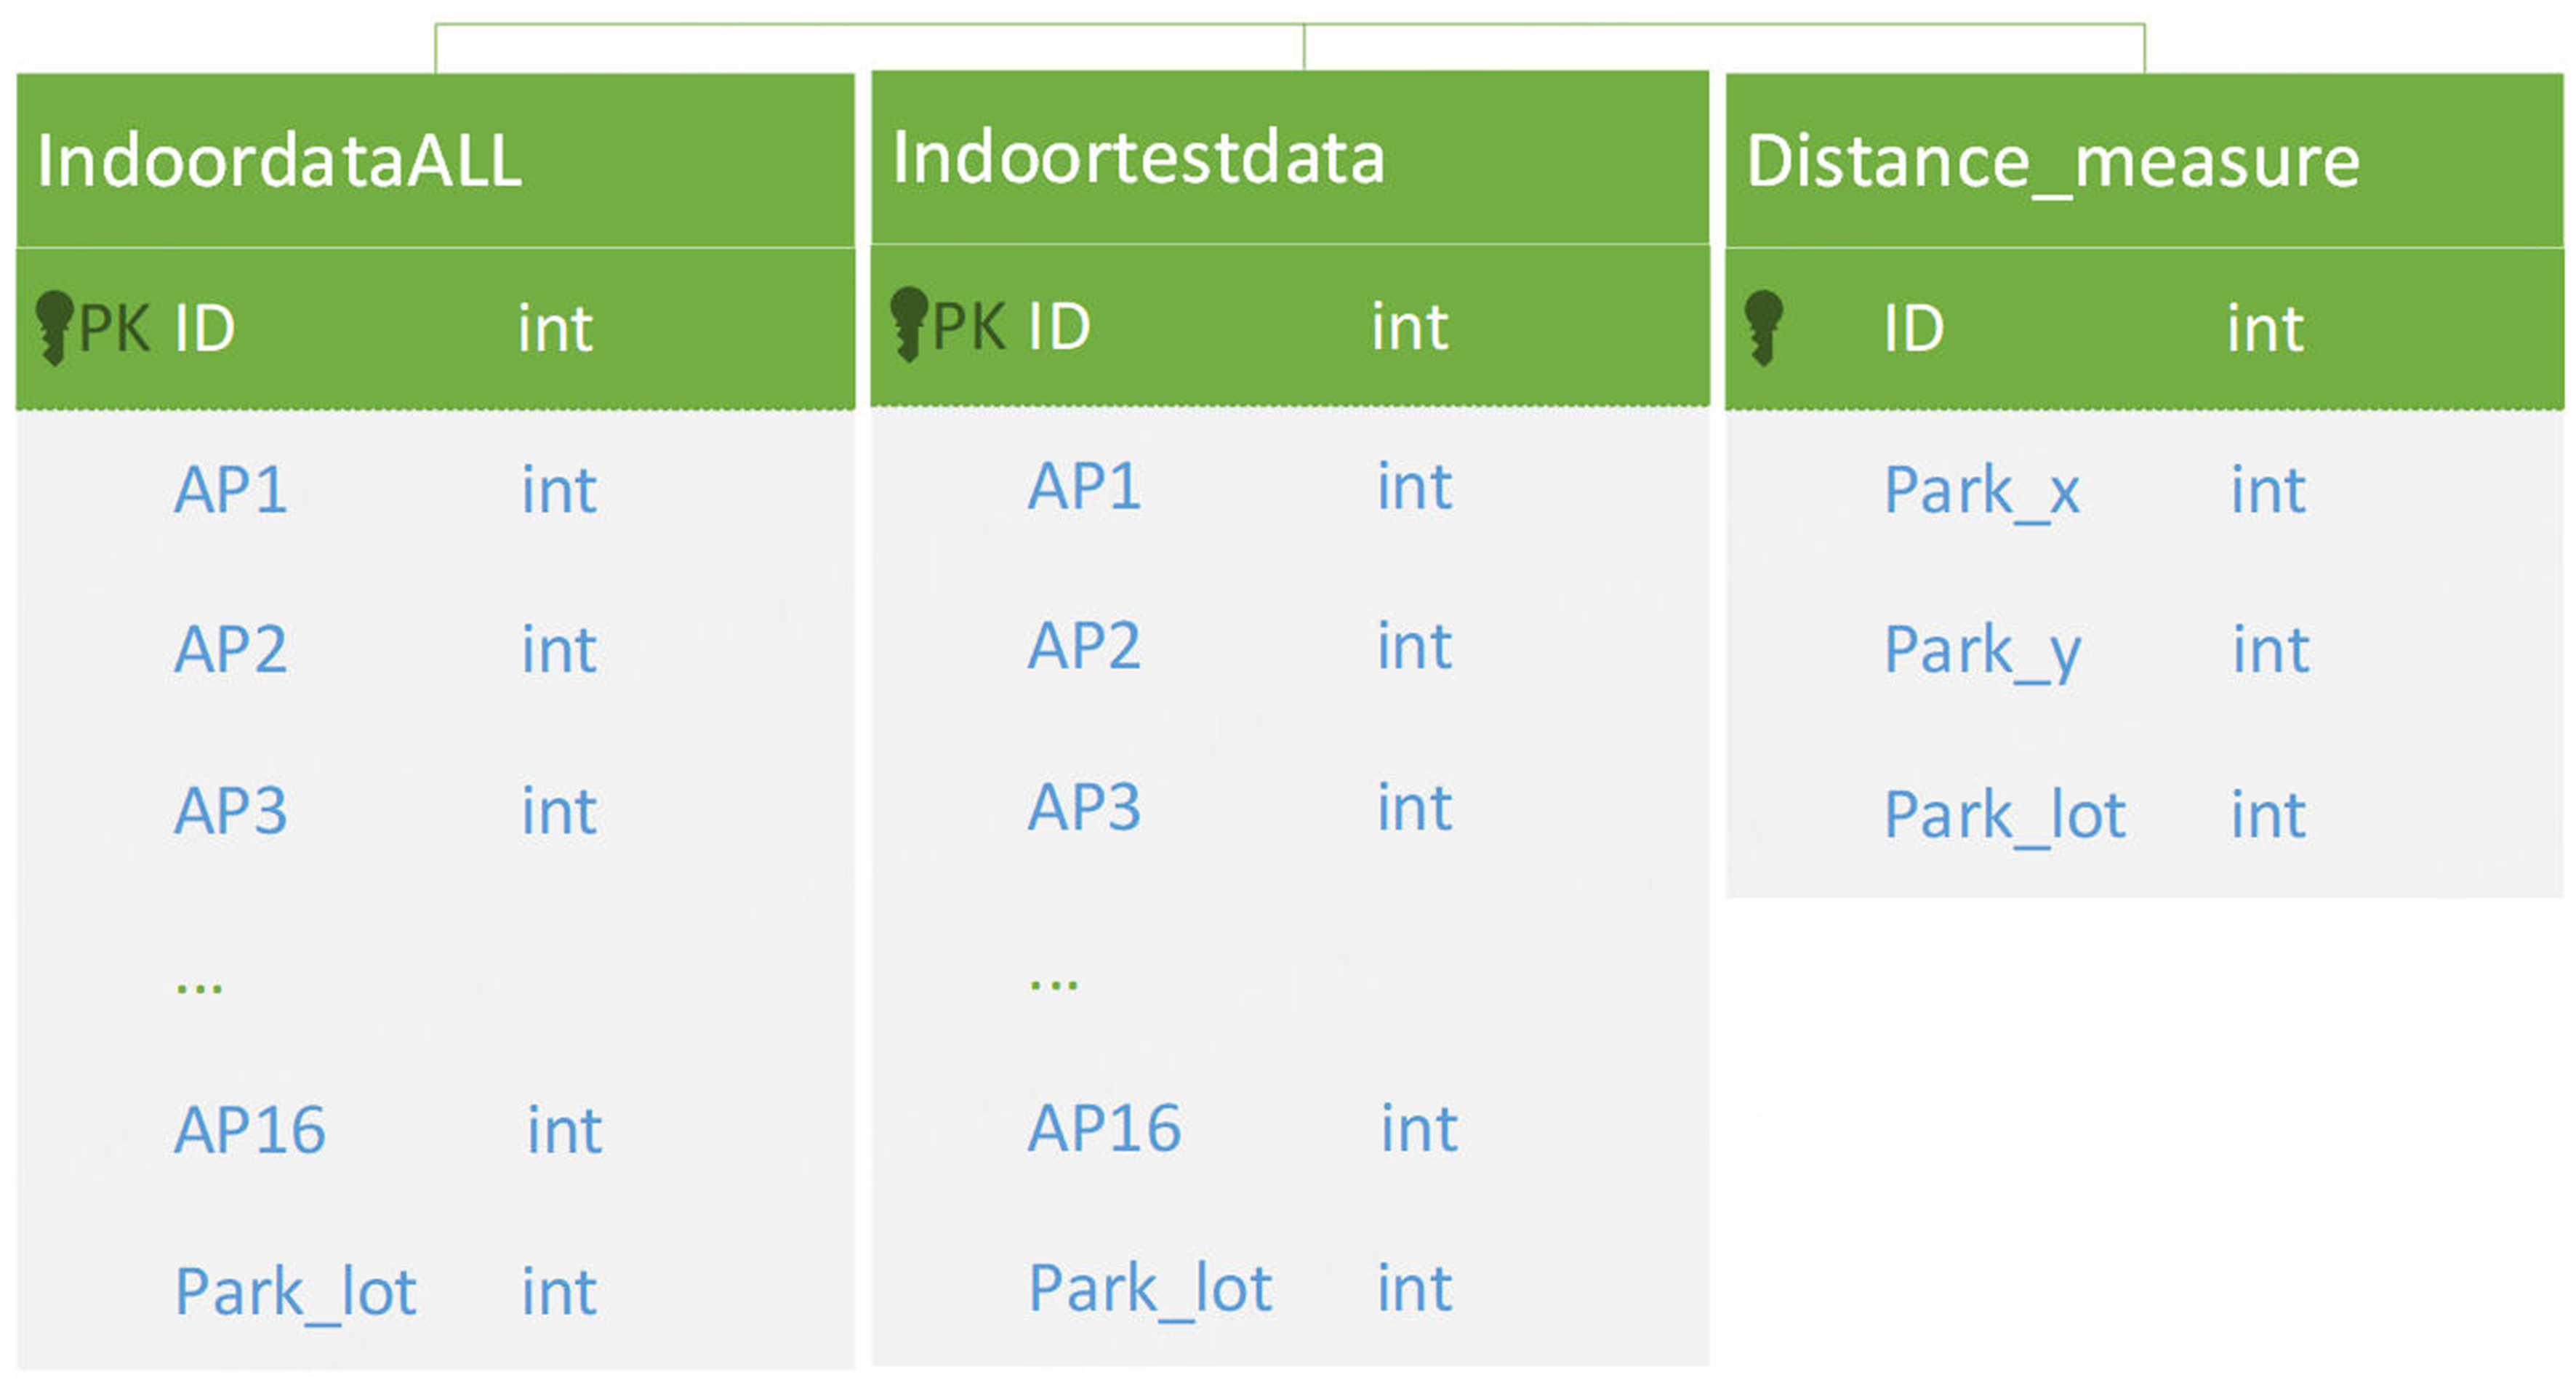
Figure 8. The data storage structure.
4.3. Discussion on the experimental evaluation method
To more comprehensively reflect the performances of various positioning algorithms in a large-scale and complex environment, the experimental evaluation method has great significance, and two evaluation standards of accuracy and average error distance are introduced.
As described above, the selected indoor parking lot covers a total region of 2,000 square meters and included 150 parking spaces. The Accuracy represents the correct rate between the estimated parking space number and its actual parking space number. For example, ten predictions and nine predictions can get correct parking space number, then its accuracy rate is 90%. The higher the accuracy, the better the positioning effect, and vice versa.
The average error distance represents the real physical distance between the estimated positioning point and its actual positioning point. To construct the vector map of the indoor parking lot and obtain the two-dimensional vector coordinates of each parking space, the top view of indoor parking lot is divided into
4.4. Discussion on the experimental process
To better reflect the advantages of hierarchical positioning model in a large-scale and complex indoor environment, the classification results from a single classifier such as SVM, DT, GNB, Adaboost, Bagging, MLP, and RF, etc., are employed as the baseline of classification result indicator. We have used the implementations of SVM, DT, GNB, Adaboost, Bagging and RF provided by the Scikit-learn tool and the MLP implementation provided by Keras. Figures 9 and 10 show the positioning results obtained by the aforementioned single classifiers to cover all the indoor parking lot, including the accuracy and average error distance.
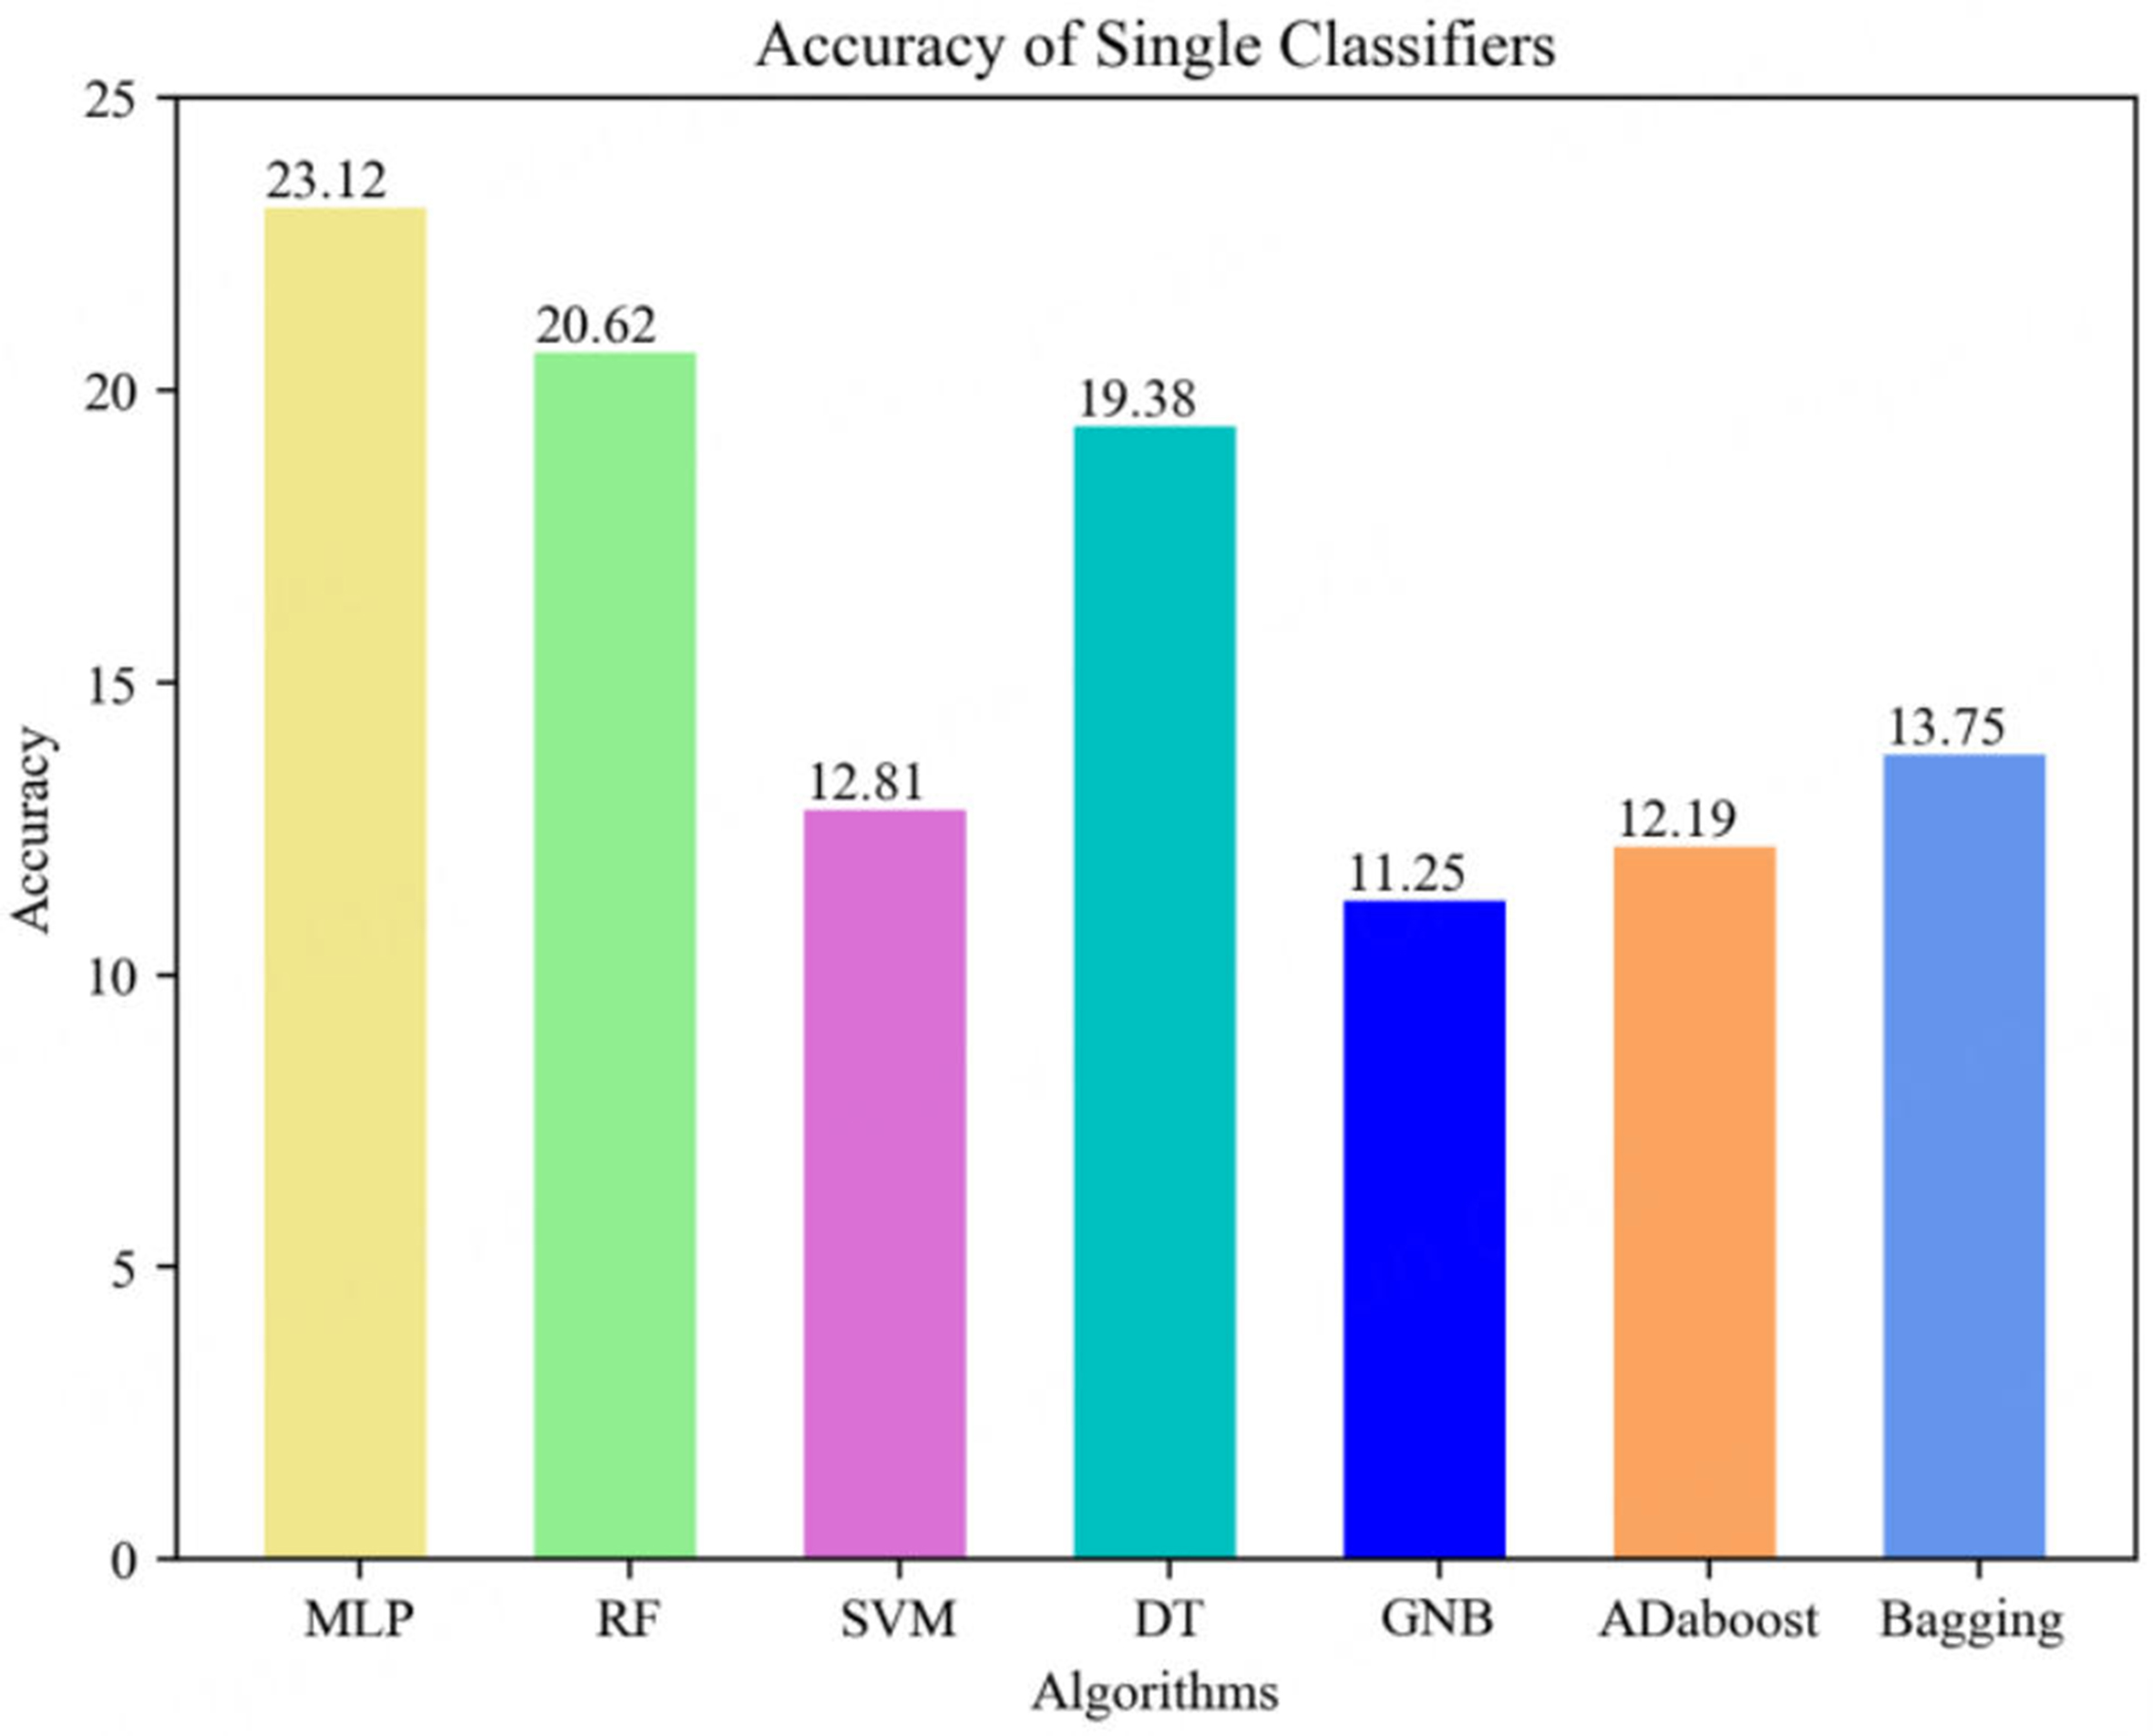
Figure 9. Comparison of accuracy of single classifiers.
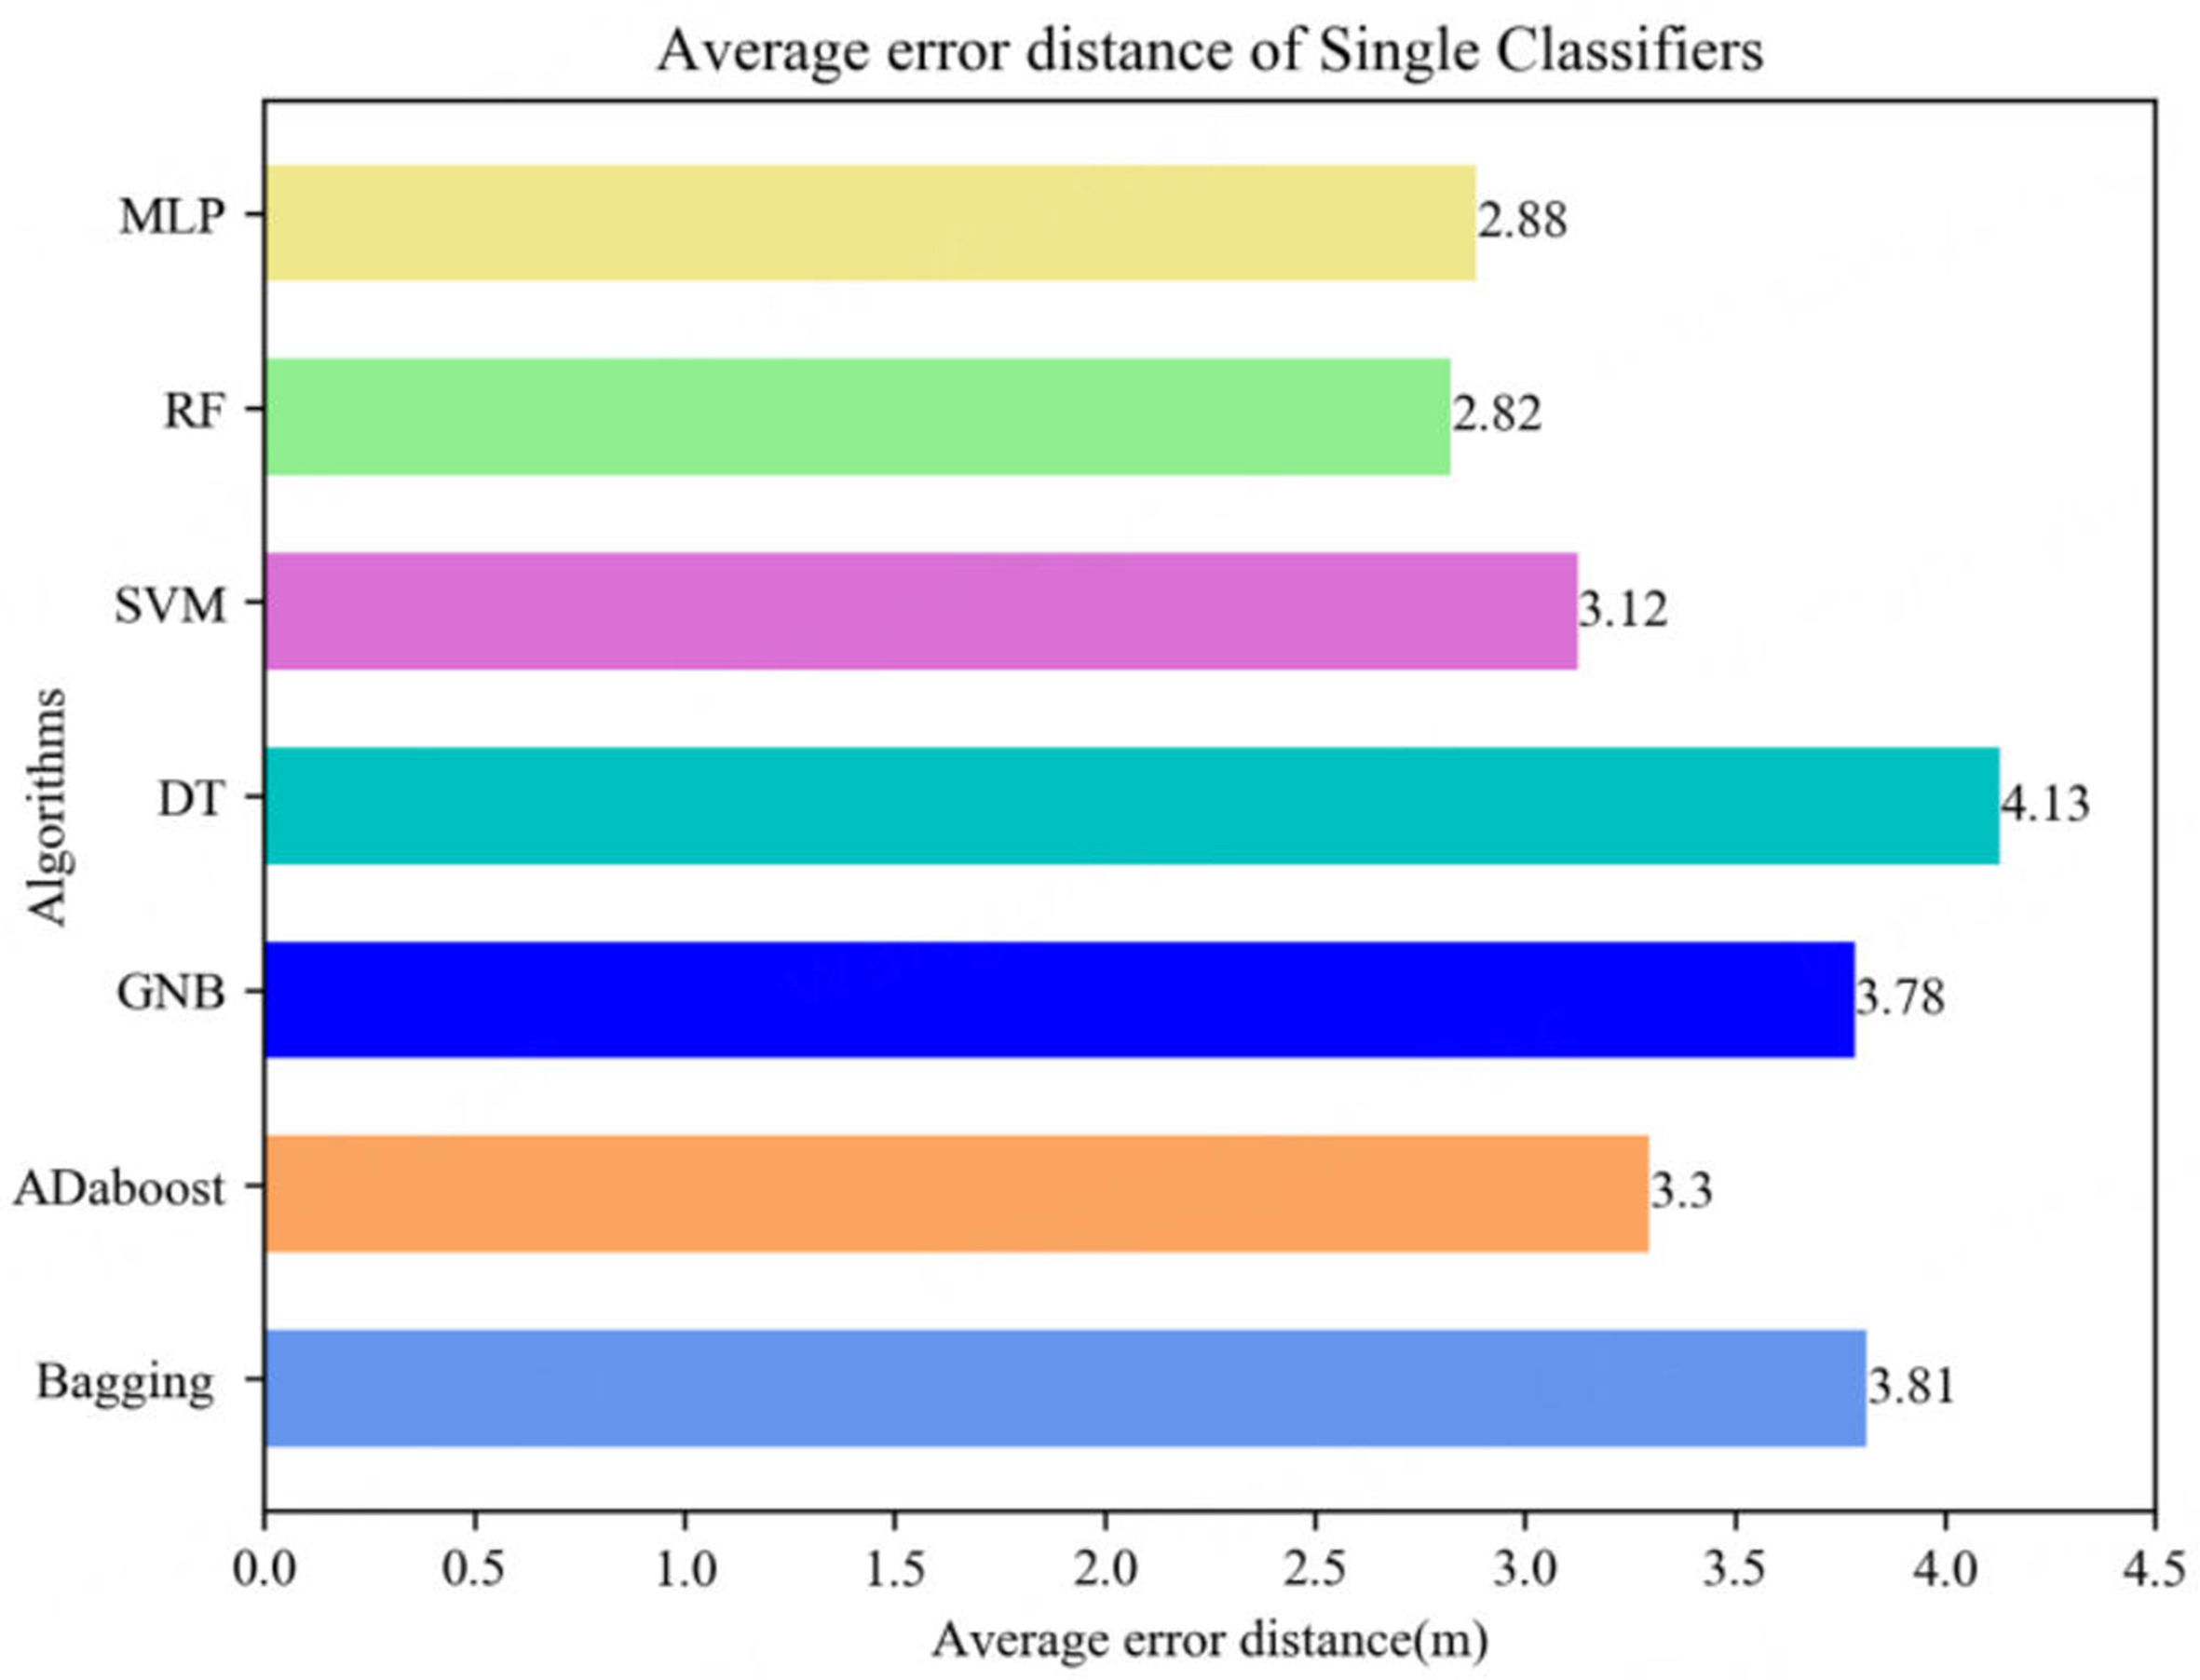
Figure 10. Comparison of average error distance of single classifiers.
As we can see intuitively from Figure 9, the accuracy of the MLP classifier is the highest among the seven algorithms about 23.12%, while the accuracy of the RF classifier is the secondly among the seven algorithms about 20.62%. As for another indicator from Figure 10, the average error distance of the RF classifier has a best performance among the seven algorithms about 2.82 m; at the same time, the accuracy of the RF classifier has a secondly performance among the seven algorithms about 2.88 m. The conclusion we can draw from our experimental data set is that the accuracy and average error distance achieved by RF and MLP outperform those of other classifiers. So, only RF and MLP will be discussed as secondly classifier when the hierarchical positioning model is applied.
Firstly, the GMM regional classifier is introduced to partition the to-be-located region into several non-overlapping sub-regions, where the Wi-Fi signal strength distributions in all are similar to each other. The K-means regional classifier is adopted to conduct a comparative experiment. The effects of regional classification of the GMM regional classifier and the K-means regional classifier both depend on the clustering index CH and Silhouette. Ch index represents the ratio of separation degree and compactness degree, where compactness degree is the sum of square distances between each point in the region and the center of the region, and separation degree is the sum of square distances between the center of the region and the center of the data set. The larger the CH index become, the closer the region itself is, and the more dispersed the regions are, which means the better regional classification effect. Silhouette index represents the contour coefficient, which can be used to measure the similarity between a point and its region compared with other regions. The value range of Silhouette index is -1 to 1. The larger the value becomes, the better regional classification effect is. Figure 11 shows comparison of the clustering index CH and Silhouette through the GMM regional classifier and the K-means regional classifier under different number of regions.
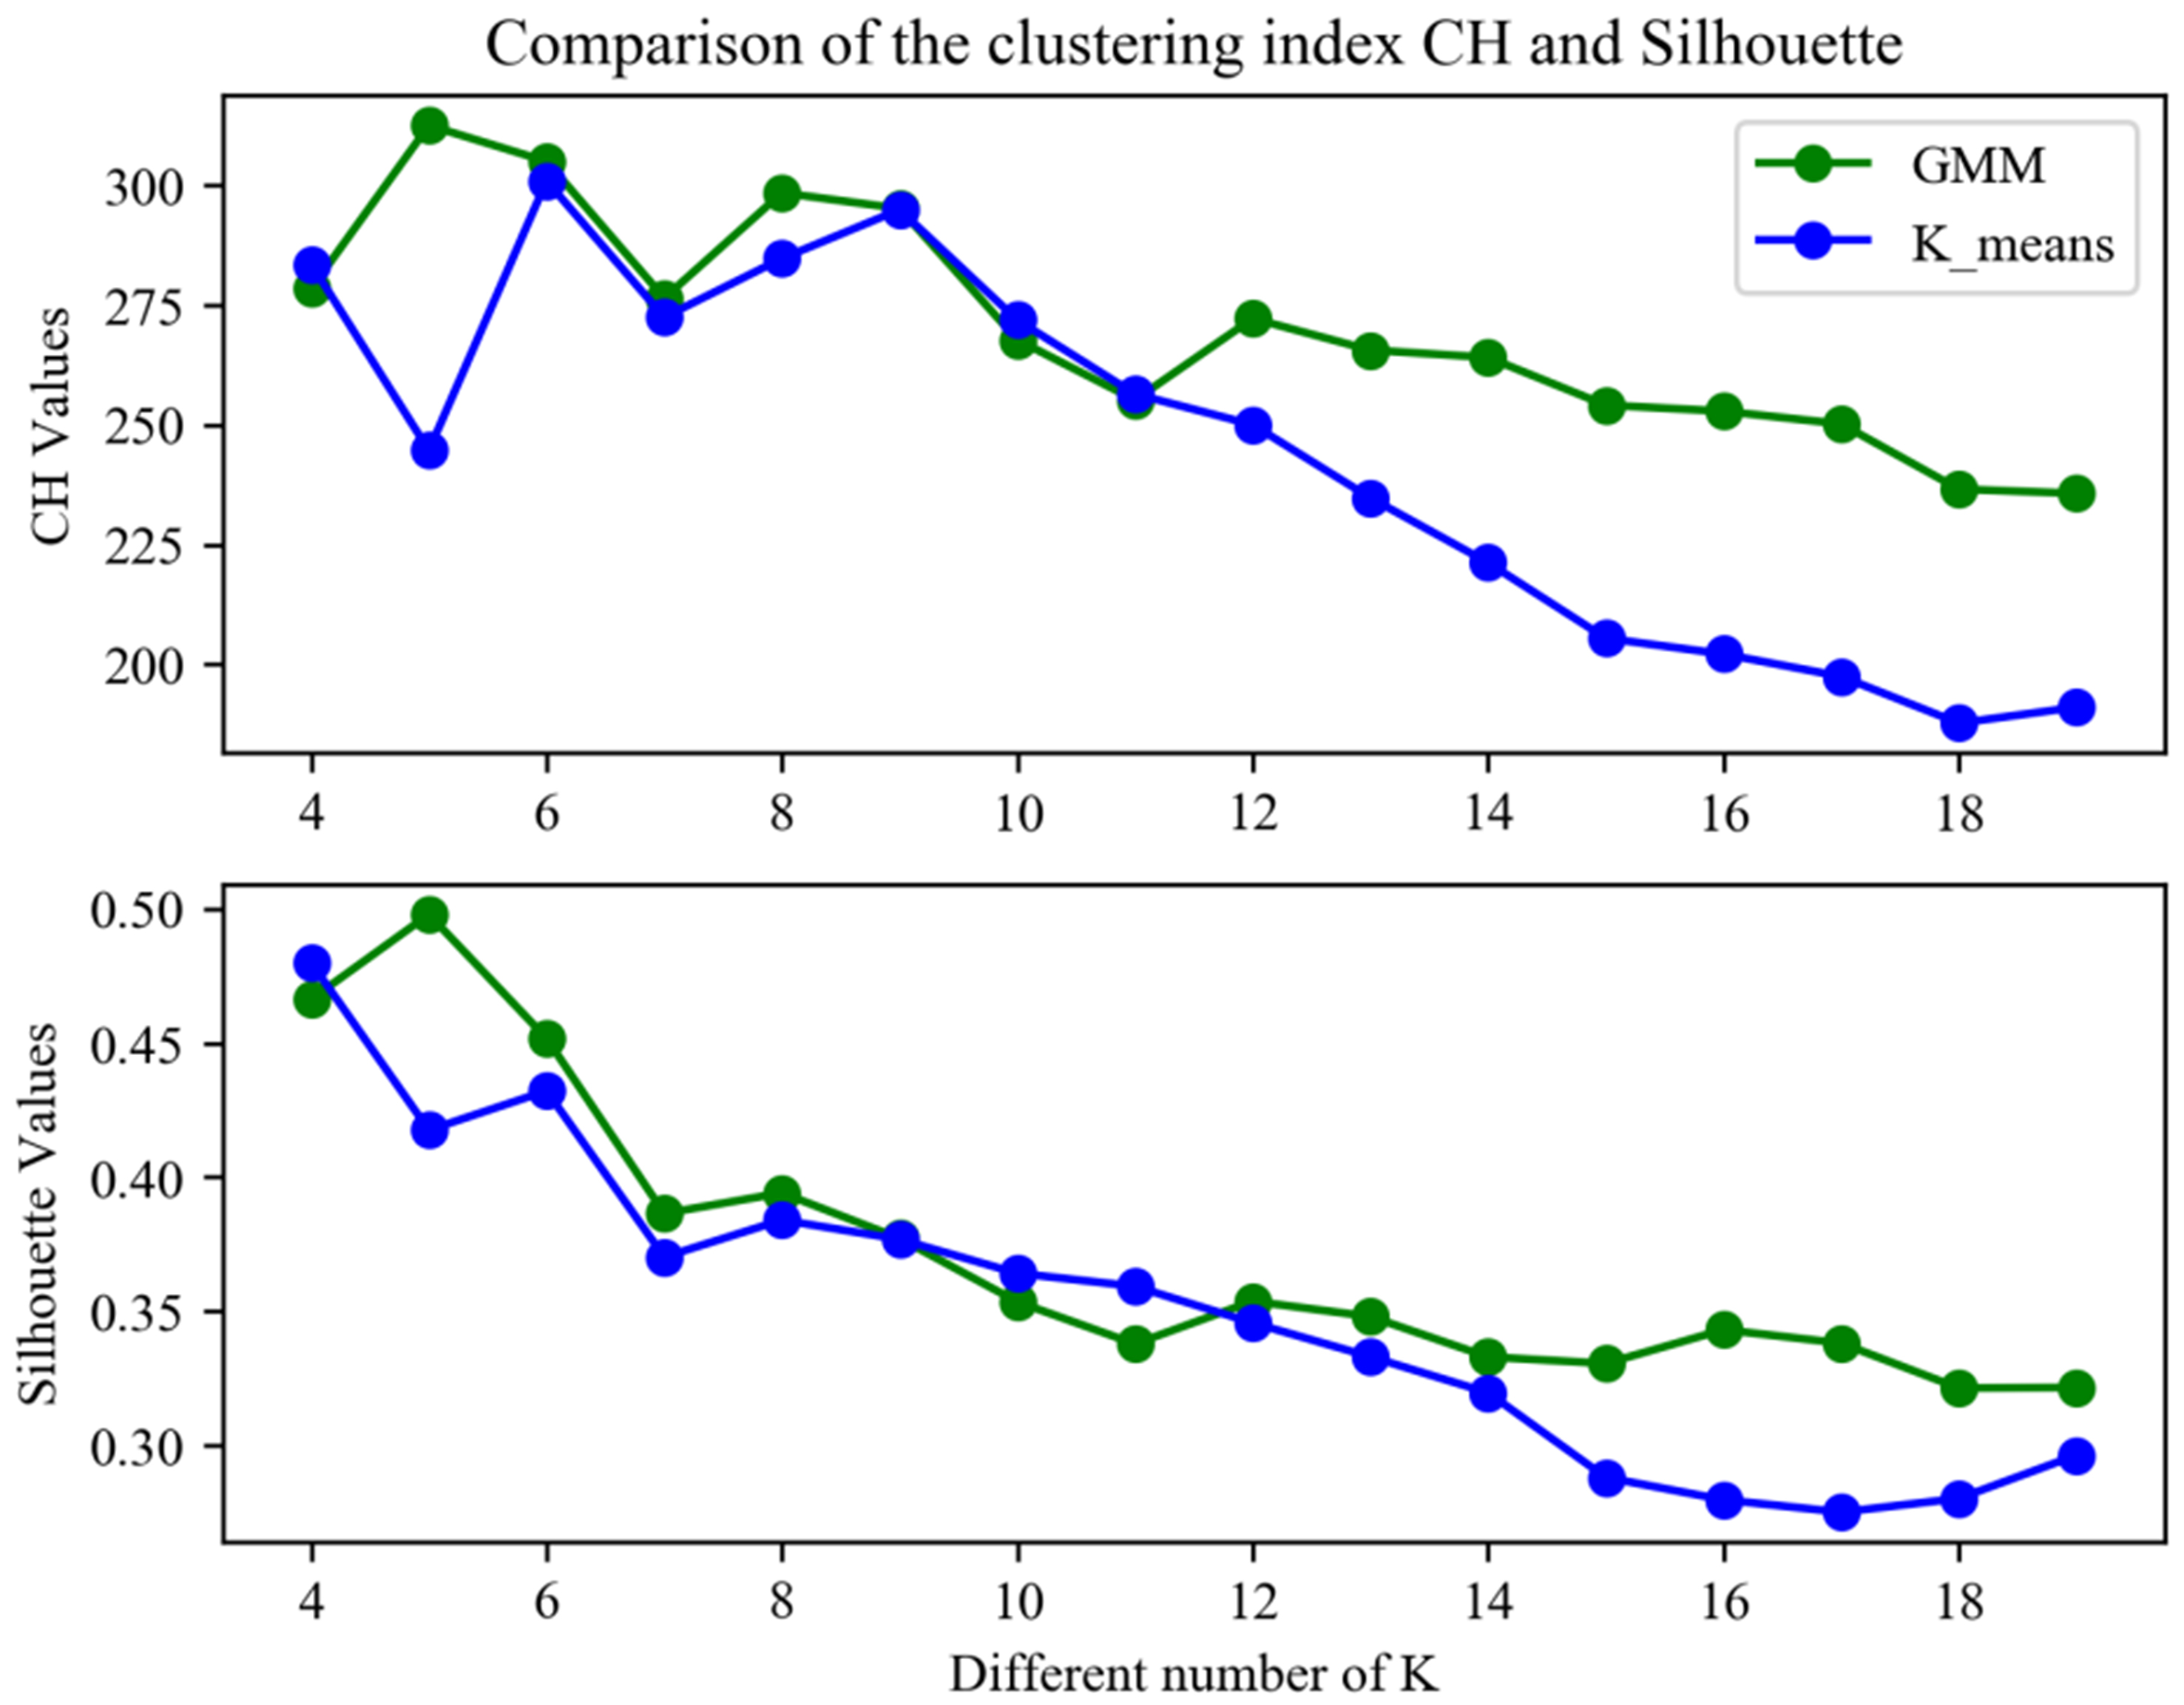
Figure 11. Comparison of the clustering index CH and Silhouette.
As we can see from Figure 11, with the continuous increase of the number of sub-regions, the clustering index CH and Silhouette of the GMM regional classifier and the K-means regional classifier both first gradually decrease and then slowly increase. Meanwhile, under the same number of regions, the clustering index CH and Silhouette of the GMM region classifier are larger than those of the K-means regional classifier. It is pointed out that the clustering index CH and Silhouette of the GMM region classifier get the maximum value when K equals five, where the CH value is 320 and the Silhouette value is 0.5. The conclusion we can draw from our experimental data set is that the GMM regional classifier has the better performance rather than the K-means regional classifier, and when the number of regions is five, the GMM regional classifier has the optimum performance. So, only GMM regional classifier will be discussed as in depth in the next experiment when the hierarchical positioning model is applied.
For those sub-regions obtained by the GMM regional classifier, we utilize data samples belonging to the same regions to train a second classifier. As mentioned above, only RF and MLP will be selected as the second classifier. Figures 12 and 13 show the accuracy and average error distance obtained by the hierarchical positioning model in different sub-regions, including GMM + RF and GMM + MLP.
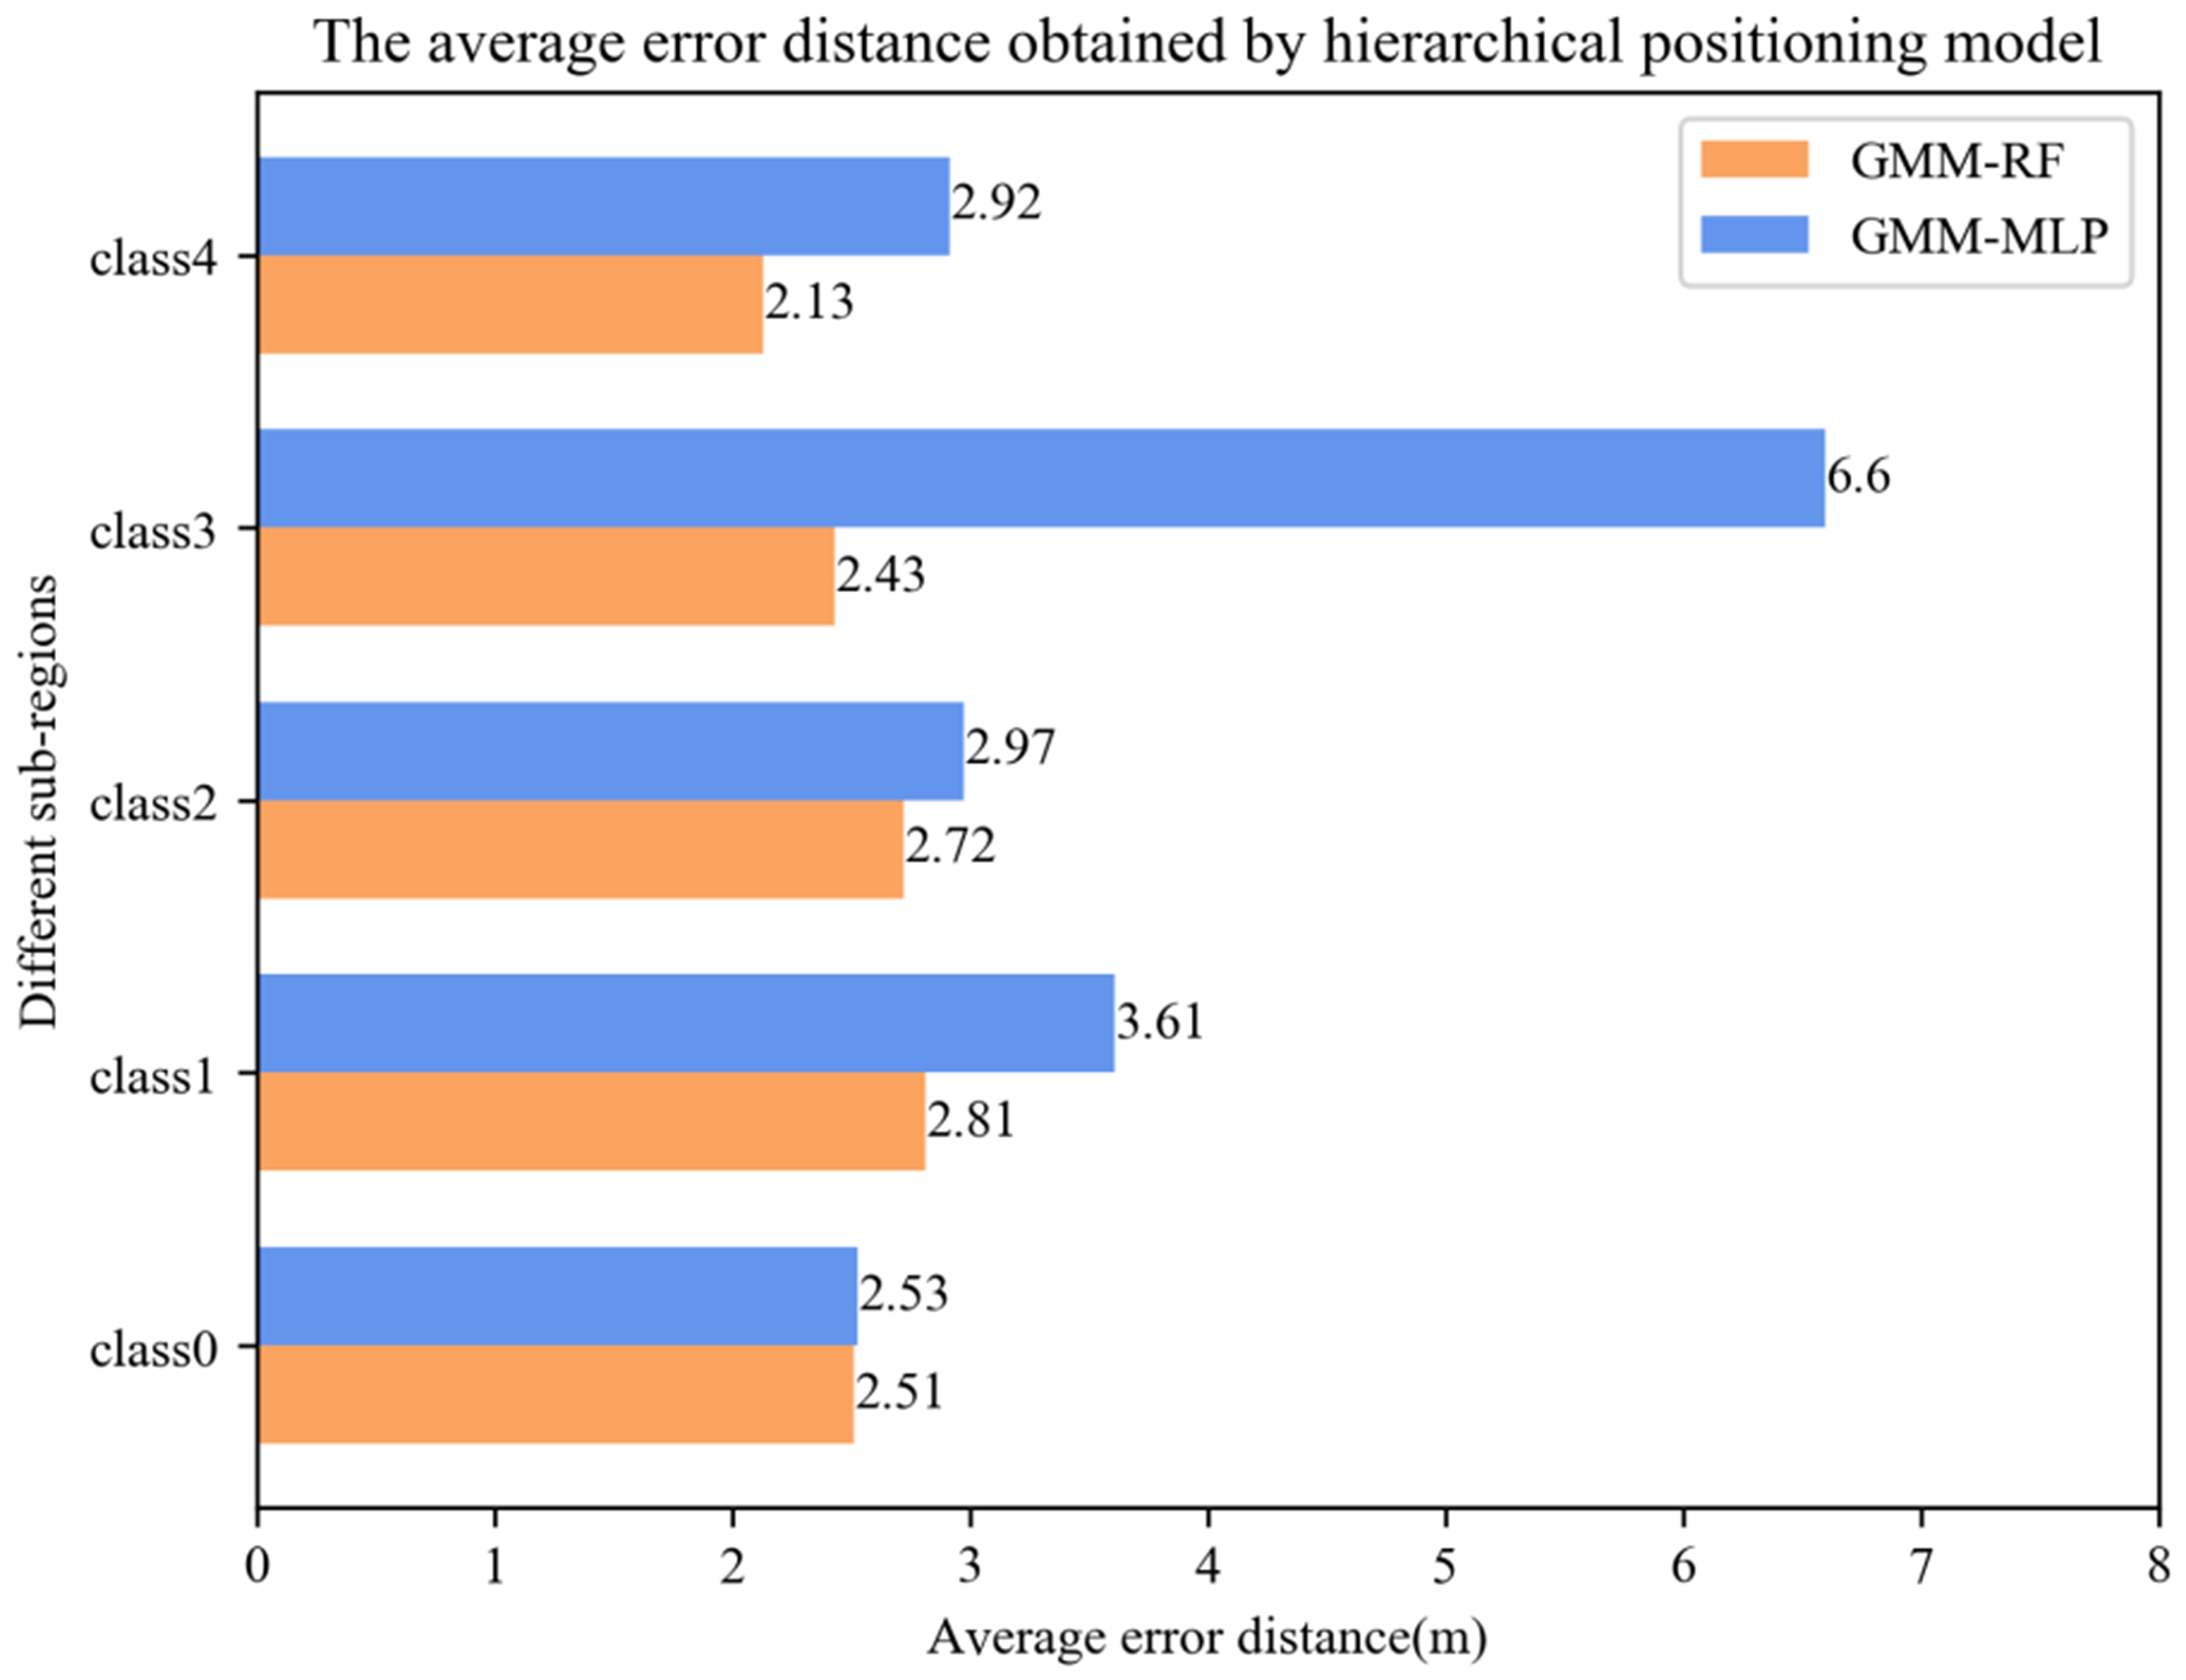
Figure 12. The accuracy obtained by hierarchical positioning model in different sub-regions.
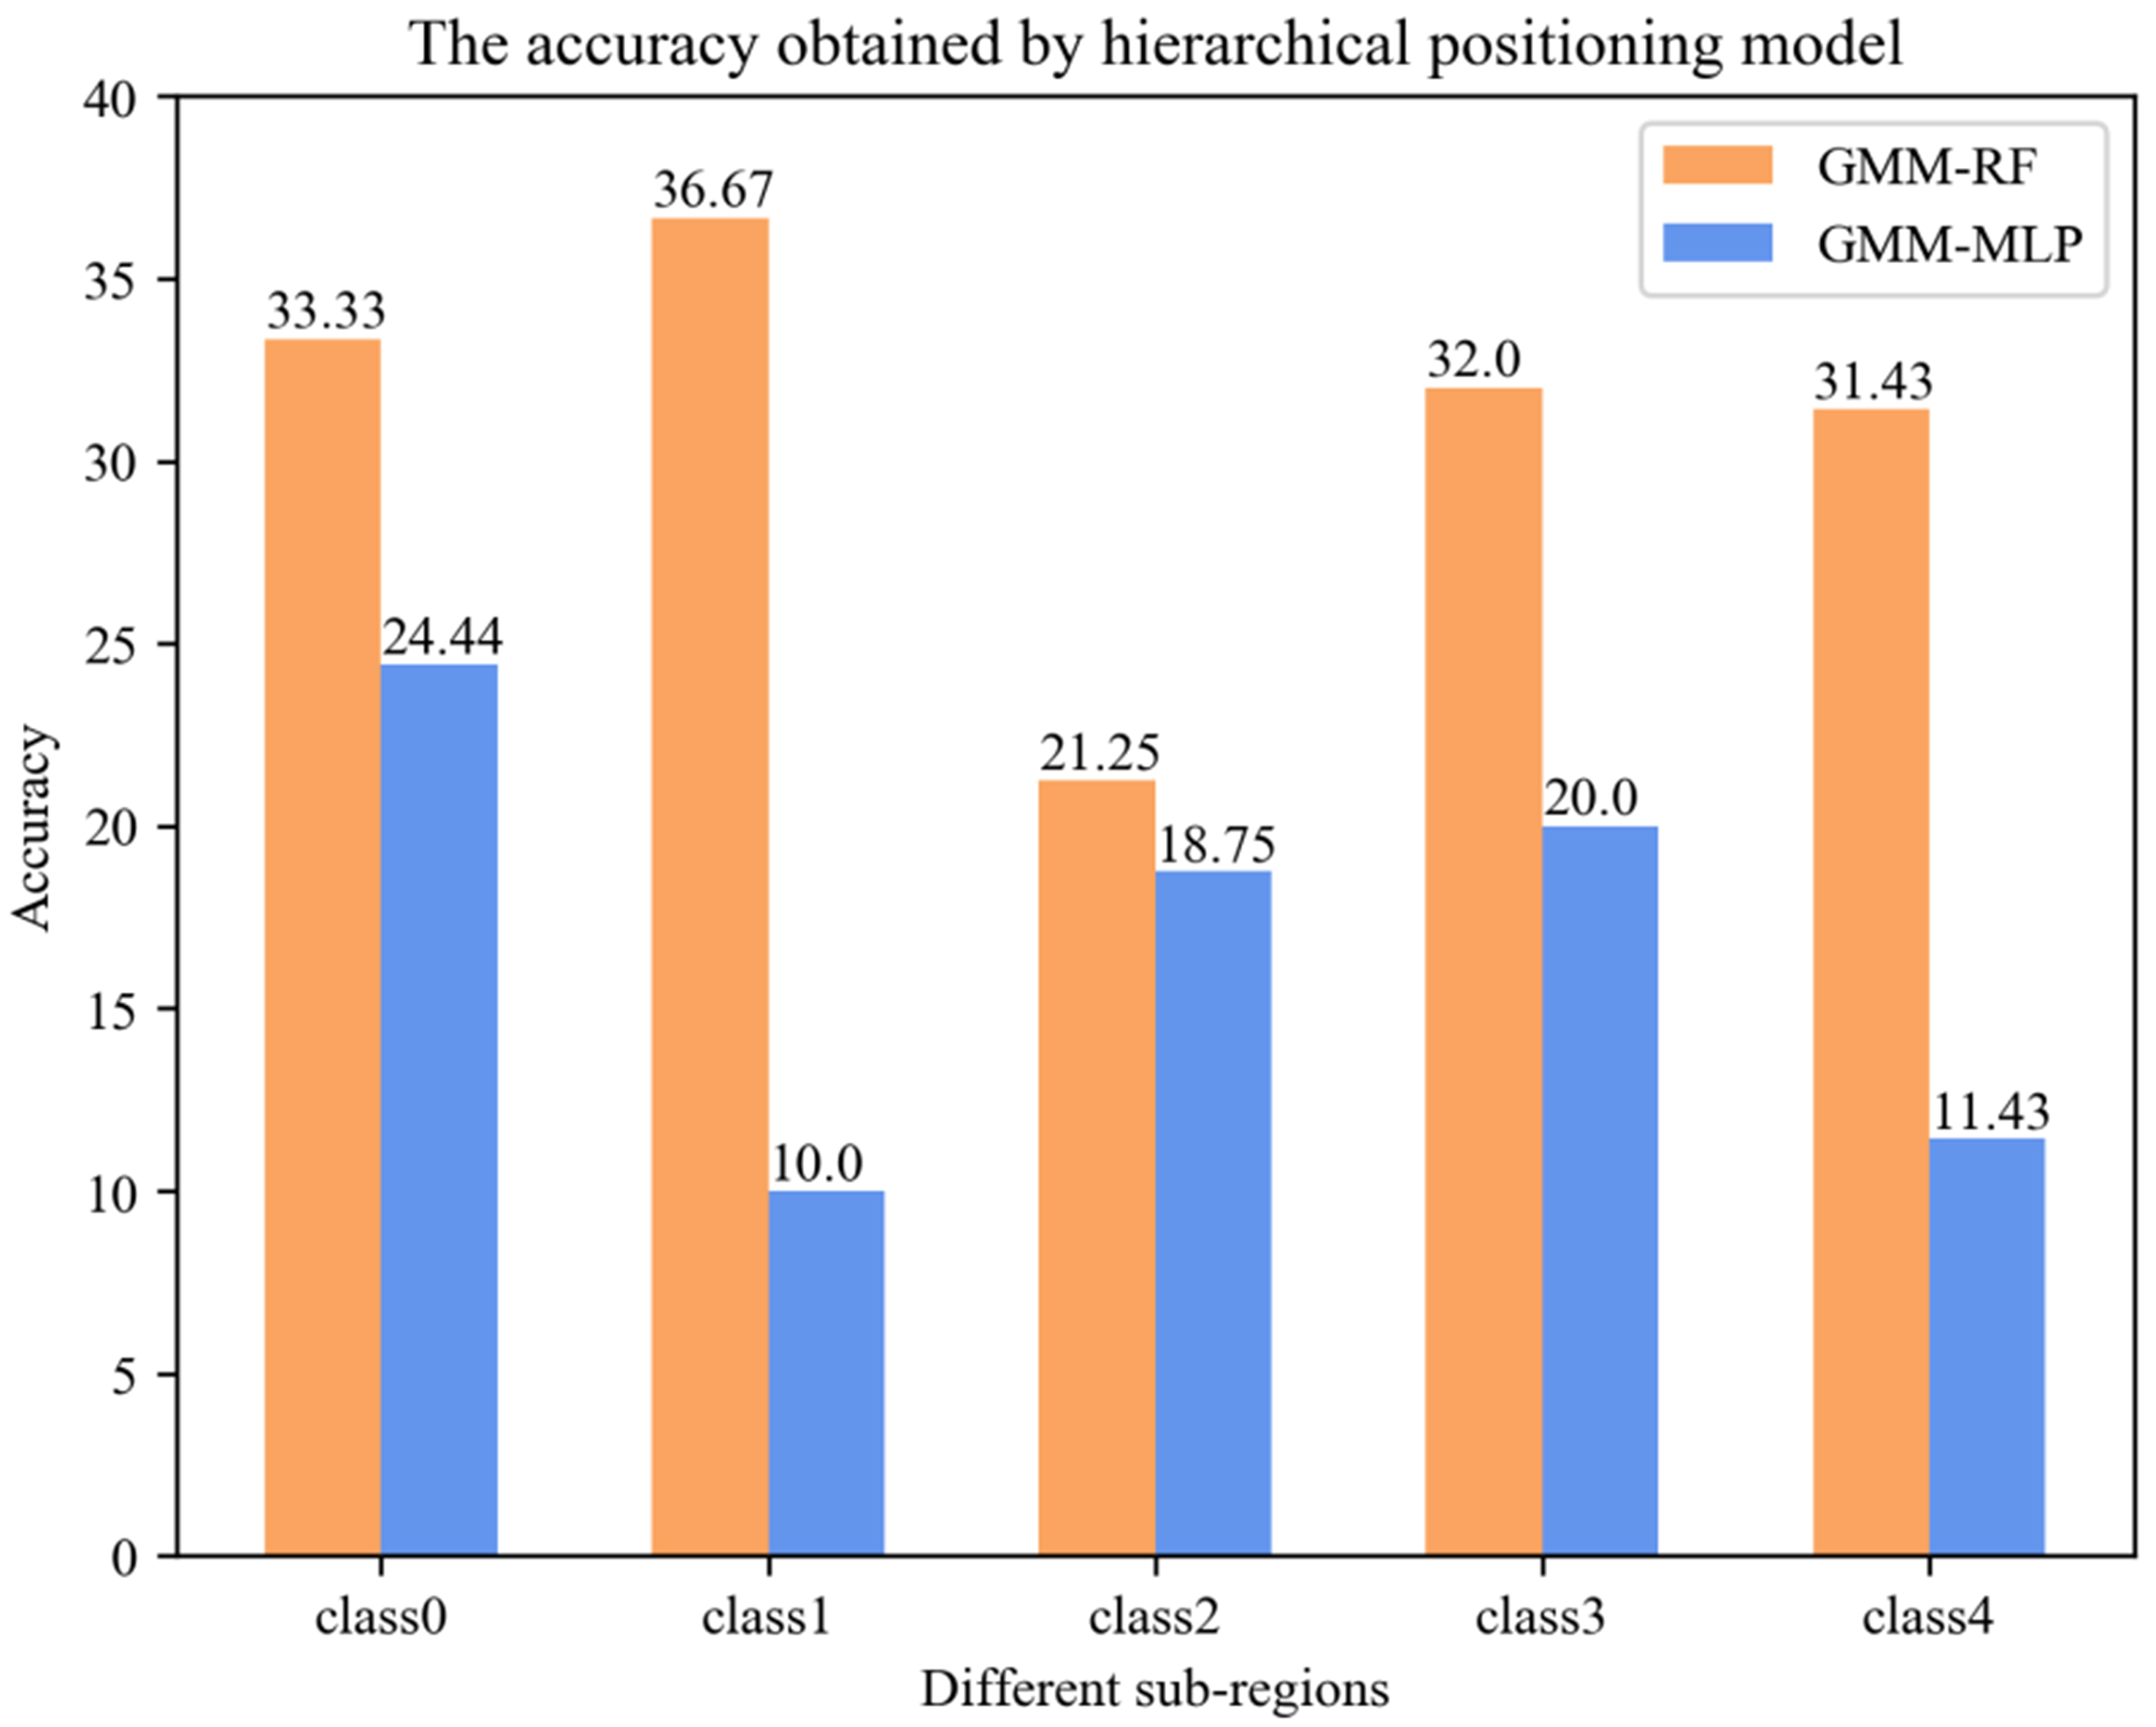
Figure 13. The average error distance obtained by hierarchical positioning model in different sub-regions.
As we can see from Figures 12 and 13, under the different sub-regions, the accuracy and average error distance of GMM + RF hierarchical positioning model or GMM + MLP hierarchical positioning model can be very different from each other. Taking GMM + RF hierarchical positioning model for example, the accuracy from lowest 21.25% achieved by region 2 to highest 36.67% achieved by region 1. It can be shown that the sub-region itself is very close, and different sub-regions are very dispersed. And it is also proved that GMM regional classifier can partition the to-be-located region into several non-overlapping sub-regions effectively.
Furthermore, under the same sub-region, the accuracy and average error distance of the GMM + RF hierarchical positioning model are better than the GMM + MLP hierarchical positioning model. The reason is that the sub-region itself is very close and data set itself is similar, MLP will get stuck at local optima easily and learning is not enough. On the other side, by introducing two randomness strategies, RF is not easy to fall into over fitting, and has a certain anti-noise ability. The conclusion we can draw from our experimental data set is that the data set at the same sub-region have similar characteristics, RF has better robustness and fault tolerance for the same sub-region of data set. To summarize, our proposed GMM + RF hierarchical positioning model has the better performance rather than the GMM + MLP hierarchical positioning model.
To verify the effectiveness of the proposed hierarchical positioning model in improving the average error and reducing the average error distance, the classification results from a single classifier such as SVM, DT, GNB, Adaboost, Bagging, MLP, RF, etc., are also employed as the baseline of classification result indicator. We have used the implementations of hierarchical positioning model GMM + RF and GMM + MLP provided by the above methods. Figures 14 and 15 show the positioning results obtained by the aforementioned single classifiers and hierarchical positioning model to cover all the indoor parking lot, including the accuracy and average error distance.
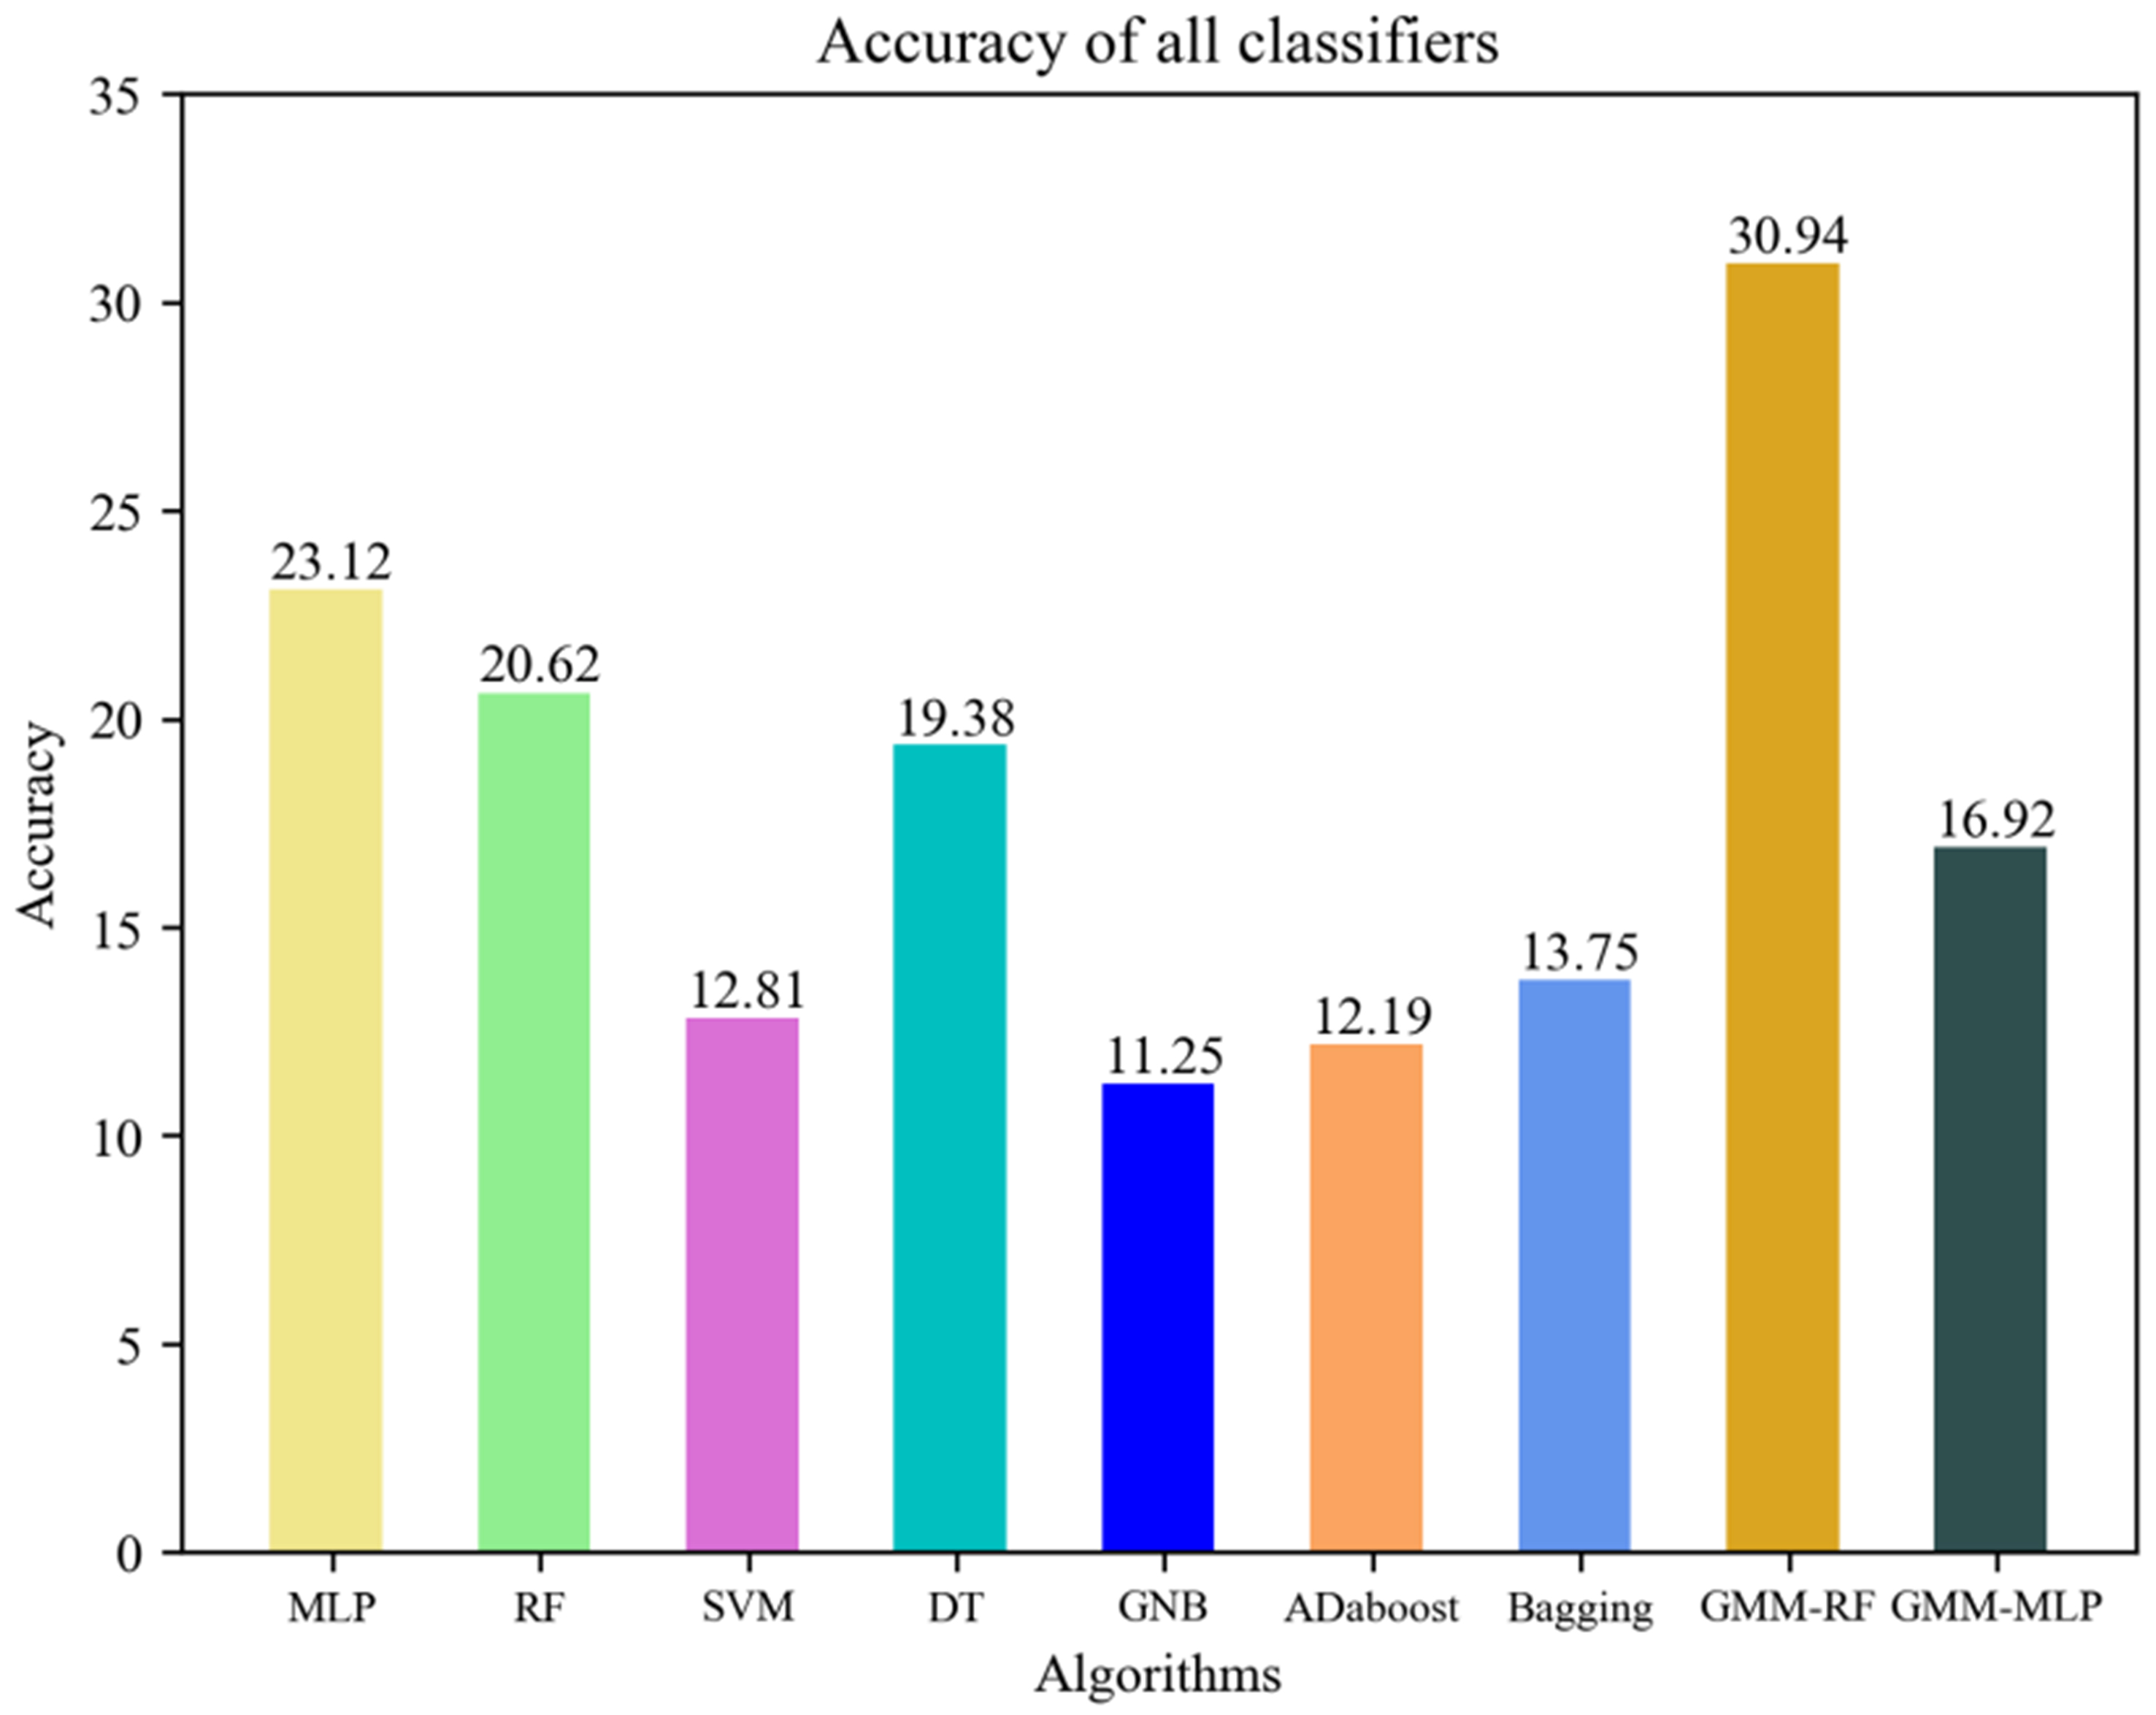
Figure 14. Comparison of the accuracy between the proposed hierarchical positioning model and the other existing classifiers.
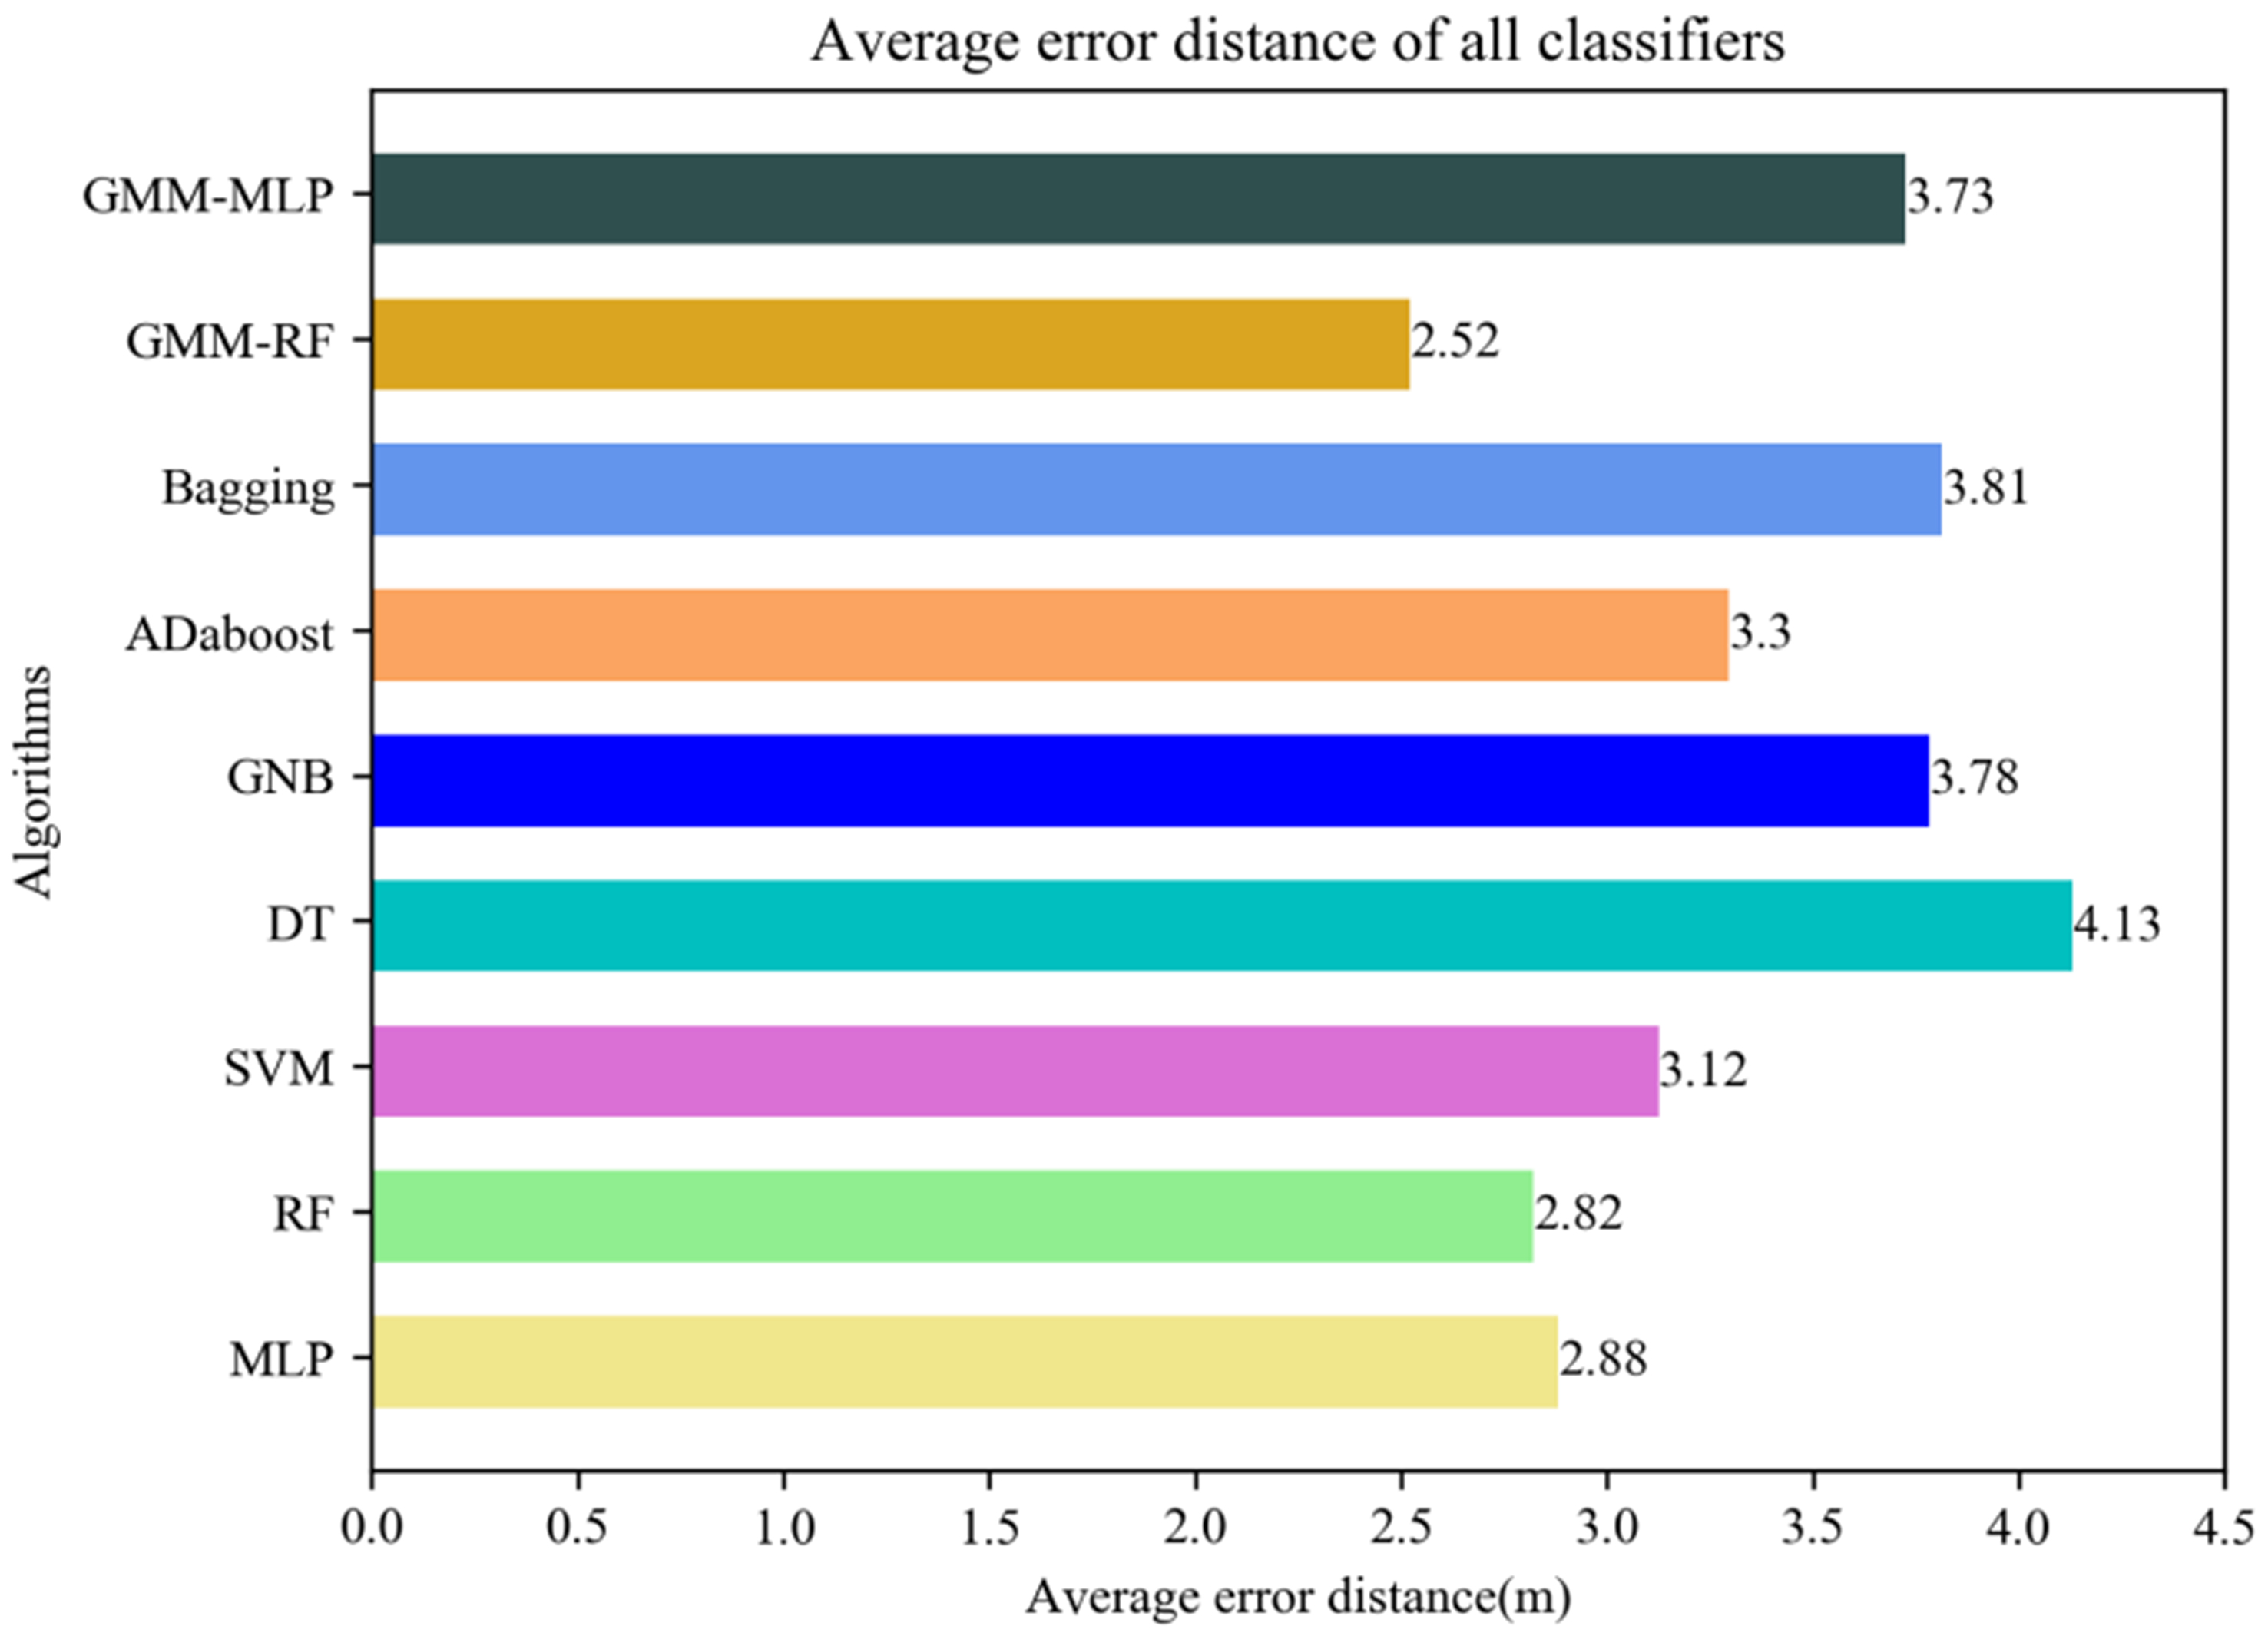
Figure 15. Comparison of the average error distance between the proposed hierarchical positioning model and the other existing classifiers.
It can be sighted that in terms of two proposed measurement standards, the proposed hierarchical positioning model GMM + RF is superior to other existing classifiers. As mentioned above, the accuracy of the MLP classifier is the highest among the seven single classifiers about 23.12%, and the average error distance of the RF classifier has a best performance among the seven single classifiers about 2.82 m. Taking GMM + RF hierarchical positioning model for a comparison, the accuracy increases from 23.12% to 30.94% while compared with MLP, and the mean error distance decreases from 2.82 to 2.52 m while compared with RF. These specific experiment results show that in terms of two proposed measurement standards, the proposed GMM + RF hierarchical positioning model is superior to other existing classifiers.
5. CONCLUSION AND FUTURE RESEARCH
In this paper, we propose a hierarchical positioning model composed of GMM regional classifier and random forest secondary classifier for a Wi-Fi positioning system in a large-scale and complex indoor parking lot. To carry out the experiment in an indoor parking lot with irregular indoor layout, numerous solid walls, scattered distribution of access points and intermittent electromagnetic interference, the conclusion we can draw from our experimental result is that the GMM regional classifier can partition the to-be-positioned region into several non-overlapping sub-regions effectively as it is proven that the sub-region is very close, and different sub-regions are very dispersed. Meanwhile, for these sub-regions with the similar characteristics, random forest classifier has better robustness and fault tolerance as its accuracy increases from 23.12% to 30.94% while compared with MLP, and the mean error distance decreases from 2.82 to 2.52 m while compared with RF. To summarize, for large-scale and complex indoor environments, the GMM regional classifier can firstly be introduced to partition the to-be-located region into several non-overlapping sub-regions, where the Wi-Fi signal strength distributions in all are similar to each other. For those sub-regions obtained by the GMM regional classifier, we can utilize data samples belonging to same regions to construct random forest secondly classifier. The proposed hierarchical positioning model can effectively provide satisfactory indoor LBS in a large-scale and complex environment, and effectively improve the accuracy of Wi-Fi positioning in large-scale complex environments.
In the near future, we plan to utilize mobile robots to collect the signal strength of the access points at each reference point automatically, and then adopt an improved generation antagonism network model to expand the fingerprint database and complete the classification task, expecting to further improve the accuracy of Wi-Fi positioning in large-scale complex environments. Moreover, we would like to concentrate on adopting path planning strategy based on improved reinforcement learning model in mobile edge computing to achieve more real applications of Wi-Fi indoor positioning.
DECLARATIONS
Authors’ contributions
Conceptualization: Zhu, Q.
Data curation: Yao, Z.
Investigation: Yao, Z.
Writing - original draft: Yao, Z.
Writing - review and editing: Chang, P.; Sun, W.
All authors have read and agreed to the published version of the manuscript.
Availability of data and materials
The data supporting this study are available from the corresponding author upon reasonable request.
Financial support and sponsorship
This work was supported by the Youth Talent Project of Scientific Research Program of Hubei Provincial Department of Education under Grant 020241809, and Doctoral Scientific Research Foundation of Hubei University of Automotive Technology under Grant BK202404.
Conflicts of interest
All authors declared that there are no conflicts of interest.
Ethical approval and consent to participate
Not applicable.
Consent for publication
Not applicable.
Copyright
© The Author(s) 2025.
REFERENCES
1. Wang, Y.; Cao, Z.; Gong, W.; Chen, M. Survey of deep learning applications in WiFi localization. In 2024 IEEE 7th Advanced Information Technology, Electronic and Automation Control Conference (IAEAC), Chongqing, China. Mar 15-17, 2024. IEEE; 2024. pp. 517-22.
2. Aziz, T.; Koo, I. A comprehensive review of indoor localization techniques and applications in various sectors. Appl. Sci. 2025, 15, 1544.
3. Bock, Y.; Melgar, D. Physical applications of GPS geodesy: a review. Rep. Prog. Phys. 2016, 79, 106801.
4. Qi, H.; Song, X.; Zhang, Y.; Xu, S.; Liu, X. Multi-scale sensing network for WIFI indoor localization. In 2023 IEEE 23rd International Conference on Communication Technology (ICCT), Wuxi, China. Oct 20-22, 2023. IEEE; 2023. pp. 1087-92.
5. Rizk, H.; Sakr, A.; Ghazal, A.; et al. Indoor localization system for seamless tracking across buildings and network configurations. In GLOBECOM 2023 - 2023 IEEE Global Communications Conference, Kuala Lumpur, Malaysia. Dec 04-08, 2023. IEEE; 2023. pp. 776-82.
6. Li, Y.; Yu, L.; Zheng, C.; et al. Development and field deployment of a mid-infrared CO and CO2 dual-gas sensor system for early fire detection and location. Spectrochim. Acta. A. Mol. Biomol. Spectrosc. 2022, 270, 120834.
7. García Marquez, F. P.; Gómez Muñoz, C. Q. A new approach for fault detection, location and diagnosis by ultrasonic testing. Energies 2020, 13, 1192.
8. Hao, L.; Huang, B.; Jia, B.; Xu, G.; Mao, G. Toward accurate crowd counting in large surveillance areas based on passive WiFi sensing. IEEE. Trans. Intell. Transport. Syst. 2023, 24, 14086-96.
9. Shi, F.; Li, W.; Tang, C.; Fang, Y.; Brennan, P. V.; Chetty, K. Decimeter-level indoor localization using WiFi round-trip phase and factor graph optimization. IEEE. J. Select. Areas. Commun. 2024, 42, 177-91.
10. Bandini, G.; Marracci, M.; Tellini, B.; Buffi, A. ORBITER: phase-based localization of RFID tags via circular antenna trajectory. IEEE. Trans. Instrum. Meas. 2024, 73, 1-10.
11. Kandula, H.; Chidurala, V.; Cao, Y.; Li, X. Localization of a BLE device based on single-device RSSI and DOA measurements. Network 2024, 4, 196-216.
12. Yao, Z.; Zhu, Q.; Zhang, Y.; Huang, H.; Luo, M. Minimizing long-term energy consumption in RIS-assisted AAV-enabled MEC network. IEEE. Internet. Things. J. 2025, 12, 20942-58.
13. Wang, Z.; Xu, Y.; Yan, Y.; Ouyang, X.; Zhang, B. Privacy-preserving WiFi localization based on inner product encryption in a cloud environment. IEEE. Internet. Things. J. 2024, 11, 17264-82.
14. Zekavat, S.; Buehrer, R. M.; Durgin, G. D.; et al. An overview on position location: past, present, future. Int. J. Wireless. Inf. Networks. 2021, 28, 45-76.
15. Zhang, S.; Guo, J.; Wang, W.; Hu, J. Floor recognition based on SVM for WiFi indoor positioning. In China Satellite Navigation Conference (CSNC) 2018 Proceedings; Sun, J.; Yang, C.; Guo, S.; Eds.; Springer; 2018; Vol. 499, pp. 725-35.
16. Lukito, Y.; Chrismanto, A. R. Recurrent neural networks model for WiFi-based indoor positioning system. In 2017 International Conference on Smart Cities, Automation & Intelligent Computing Systems (ICON-SONICS), Yogyakarta, Indonesia. Nov 08-10, 2017. IEEE; 2017. pp. 121-5.
17. Zhang, W.; Hua, X.; Yu, K.; Qiu, W.; Zhang, S.; He, X. A novel WiFi indoor positioning strategy based on weighted squared Euclidean distance and local principal gradient direction. Sens. Rev. 2019, 39, 99-106.
18. Li, J.; He, X.; Cai, Y. Z.; Xu, Q.; Automation, D. O. Method of WiFi indoor location based on K-means and random forest. Control. Eng. China. 2017.
19. Biswas J, Veloso M. WiFi localization and navigation for autonomous indoor mobile robots. In 2010 IEEE International Conference on Robotics and Automation, Anchorage, USA. May 03-07, 2010. IEEE; 2010. pp. 4379-84.
20. Ahmad, U.; Gavrilov, A. V.; Lee, Y.; Lee, S. Context-aware, self-scaling Fuzzy ArtMap for received signal strength based location systems. Soft. Comput. 2008, 12, 699-713.
21. Wu, H.; Zhang, L.; Miao, Y. The propagation characteristics of radio frequency signals for wireless sensor networks in large-scale farmland. Wireless. Pers. Commun. 2017, 95, 3653-70.
22. Katircioğlu, O.; Isel, H.; Ceylan, O.; Taraktas, F.; Yagci, H. B. Comparing ray tracing, free space path loss and logarithmic distance path loss models in success of indoor localization with RSSI. In 2011 19thTelecommunications Forum (TELFOR) Proceedings of Papers, Belgrade, Serbia. Nov 22-24, 2011. IEEE; 2011. pp. 313-6.
23. Kim, S. M.; Do, T. T.; Oechtering, T. J.; Peters, G. On the entropy computation of large complex gaussian mixture distributions. IEEE. Trans. Signal. Process. 2015, 63, 4710-23.
24. Vu, T. K.; Hoang, M. K.; Le, H. L. An EM algorithm for GMM parameter estimation in the presence of censored and dropped data with potential application for indoor positioning. ICT. Express. 2019, 5, 120-3.
25. Lau, H. Y.; Liu, K. P.; Wong, P. L.; Wang, W. A new design of smart journal bearing based on GMM actuators. Ind. Lubr. Tribol. 2012, 64, 147-51.
26. Kulkarni, V. Y.; Sinha, P. K.; Petare, M. C. Weighted hybrid decision tree model for random forest classifier. J. Inst. Eng. India. Ser. B. 2016, 97, 209-17.
27. Tabatabaee Malazi, H.; Davari, M. Combining emerging patterns with random forest for complex activity recognition in smart homes. Appl. Intell. 2018, 48, 315-30.
28. Dong, Y.; Du, B.; Zhang, L. Target detection based on random forest metric learning. IEEE. J. Sel. Top. Appl. Earth. Obs. Remote. Sens. 2015, 8, 1830-8.
29. Lu, C.; Zou, X.; Wang, W.; Chen, X. Making up the shortages of the Bayes classifier by the maximum mutual information classifier. J. Eng. 2020, 2020, 659-63.
30. Gong, W.; Liu, J. SiFi: pushing the limit of time-based WiFi localization using a single commodity access point. Proc. ACM. Interact. Mob. Wearable. Ubiquitous. Technol. 2018, 2, 1-21.
Cite This Article
How to Cite
Download Citation
Export Citation File:
Type of Import
Tips on Downloading Citation
Citation Manager File Format
Type of Import
Direct Import: When the Direct Import option is selected (the default state), a dialogue box will give you the option to Save or Open the downloaded citation data. Choosing Open will either launch your citation manager or give you a choice of applications with which to use the metadata. The Save option saves the file locally for later use.
Indirect Import: When the Indirect Import option is selected, the metadata is displayed and may be copied and pasted as needed.
About This Article
Copyright

Data & Comments
Data
0


Comments
Comments must be written in English. Spam, offensive content, impersonation, and private information will not be permitted. If any comment is reported and identified as inappropriate content by OAE staff, the comment will be removed without notice. If you have any queries or need any help, please contact us at [email protected].