

High-resolution net ecosystem productivity modeling reveals spatiotemporal heterogeneity of urban carbon metabolism
 0
0 
Abstract
Urban ecosystems exhibit complex metabolic dynamics in regional carbon cycles, yet high-resolution quantification of urban carbon metabolism remains challenging in rapidly urbanizing regions. This study addresses this limitation by developing an unprecedented 250 m resolution modeling framework that combines the ecological CASA model with a soil respiration model, applied to the Pearl River Delta region of China. Using remote sensing data and ERA5-Land meteorological inputs, we quantified monthly net ecosystem productivity (NEP) for 2021-2022 across all cities, revealing significant spatiotemporal heterogeneity (-40 to 638 gC·m-2·a-1). Our findings indicate that forest ecosystems contribute 55.1% of regional net carbon absorption, while core cities like Dongguan and Zhongshan become net carbon sources when soil respiration exceeds vegetation productivity. The model outperforms traditional MODIS products in terms of resolution and spatial variability details (R2 = 0.79) and provides valuable insights for urban carbon neutrality strategies. The findings highlight the importance of maintaining green infrastructure and implementing targeted carbon management policies in megacity regions.
Keywords
INTRODUCTION
Urban ecosystems play a complex dual role in regional carbon cycles, with their metabolic processes serving as both significant carbon sources and potential carbon sinks[1]. China has pledged to peak carbon emissions before 2030 and achieve carbon neutrality by 2060, a commitment that aligns with the European Union’s 2050 net-zero target and similar mid-century goals in the United States and Japan[2-4]. Against the backdrop of global carbon neutrality commitments, high-precision quantification of urban carbon metabolism is crucial for developing effective carbon reduction strategies. Current assessment frameworks primarily rely on coarse-resolution datasets (e.g., MODIS annual NPP data[5]) or static inventory methods[6], which have limitations in capturing the fine-scale spatiotemporal dynamics of urban carbon fluxes. This limitation is particularly pronounced in rapidly urbanizing regions such as the Pearl River Delta in China, where complex land cover conditions and intensive human activities create heterogeneous metabolic patterns across urban-rural gradients. Therefore, high-spatiotemporal resolution estimates of urban carbon metabolism are essential for supporting precise urban ecological management and localized carbon neutrality policies. Such an approach can reveal previously overlooked complex carbon sink patterns in megacity clusters.
Urban ecosystem carbon metabolism encompasses the dynamic processes of CO2 absorption through photosynthesis and release via respiration, forming the basis of urban carbon cycling[7]. This metabolic system can be quantified through net primary productivity (NPP), which represents the net carbon assimilation by vegetation after accounting for autotrophic respiration[8]. Remote sensing has emerged as a commonly used method for assessing these metabolic processes, particularly when integrated with ecological modeling frameworks. Current models combine multi-source remote sensing data with meteorological inputs to capture the spatiotemporal dynamics of urban carbon fluxes[9-12]. The existing commonly used models include the CASA model, 3-PG model, CENTURY model, InVEST model, CMIP6 model, etc. Different models have their own applicable conditions and are influenced by the uniqueness and complexity of vegetation in different areas.
Among these ecological models, the CASA (Carnegie-Ames-Stanford Approach) model has been widely used by scholars due to its advantages of fewer parameters involved, simple calculation process, and high accuracy of results[11,13]. The CASA model is a terrestrial vegetation NPP estimation model based on solar energy utilization rate, which is widely used in global carbon cycle analysis and multi-scale vegetation NPP research[14,15]. Liu et al. analyzed the spatiotemporal variations of forest NPP in Yichun City, Heilongjiang Province, China, from 2000 to 2019 based on MODIS data and CASA model, revealing an overall increasing trend in NPP[16]. Potter et al. used the CASA model to analyze changes in vegetation NPP across Western Europe from 2015 to 2022, and found that most Western European countries experienced the lowest NPP in 2022, which was closely associated with the concurrent weakening of precipitation in the region[17]. Overall, most existing studies on NPP estimation focus on annual results and long-term sequence changes, while monthly and seasonal analyses remain lacking. The spatial resolution varies from 8 km to 500 m, and the processing of parameters related to vegetation types is often simplified. Specifically, parameters that vary across vegetation types (such as the maximum solar energy utilization rate) have not been differentially processed using high-resolution vegetation classification data, which limits the ability to accurately reflect the carbon sequestration status in urban areas.
In addition, current research frequently overlooks the role of soil heterotrophic respiration (RH) in shaping carbon sinks within urban ecosystems. For accurate assessment of ecosystem carbon sinks, RH should be incorporated into the calculation of net ecosystem productivity (NEP)[18]. Several studies have developed RH estimation models using remote sensing data and validated their applicability across diverse vegetation conditions[15,19,20]. Nevertheless, existing research often fails to integrate NPP with RH or to examine their relative ratio under varying environmental and urban contexts. This gap limits the utility of current findings for informing carbon neutrality policies. The RH-to-NPP ratio is a critical determinant of NEP, which differs across levels of urban development and land cover types, and thus warrants further investigation.
Here, we developed a 250 m-resolution modeling framework that combines the CASA model with a RH accounting model driven by temperature and precipitation to derive accurate monthly NEP for the urban area. Taking the Pearl River Delta region of China as an example, we systematically analyzed urban carbon metabolism characteristics at the city level and across different land cover types. Our high-resolution method can identify small-scale carbon sink patterns that were previously overlooked in coarse-grained urban area assessments, providing valuable insights for understanding the carbon cycle mechanisms in rapidly developing megacity regions.
METHODS
Study area and workflow
In this study, we selected the Pearl River Delta (PRD) urban agglomeration in Guangdong Province, southern China (21°30′-24°30′ N, 112°40′-115°30′ E), as a representative case study. The PRD is among the world’s most dynamic and densely populated metropolitan regions, encompassing nine major cities - including Guangzhou, Shenzhen, and Zhuhai - across approximately 56,000 km2[21]. The region is characterized by a humid subtropical climate (mean annual temperature 21-23 °C; annual precipitation
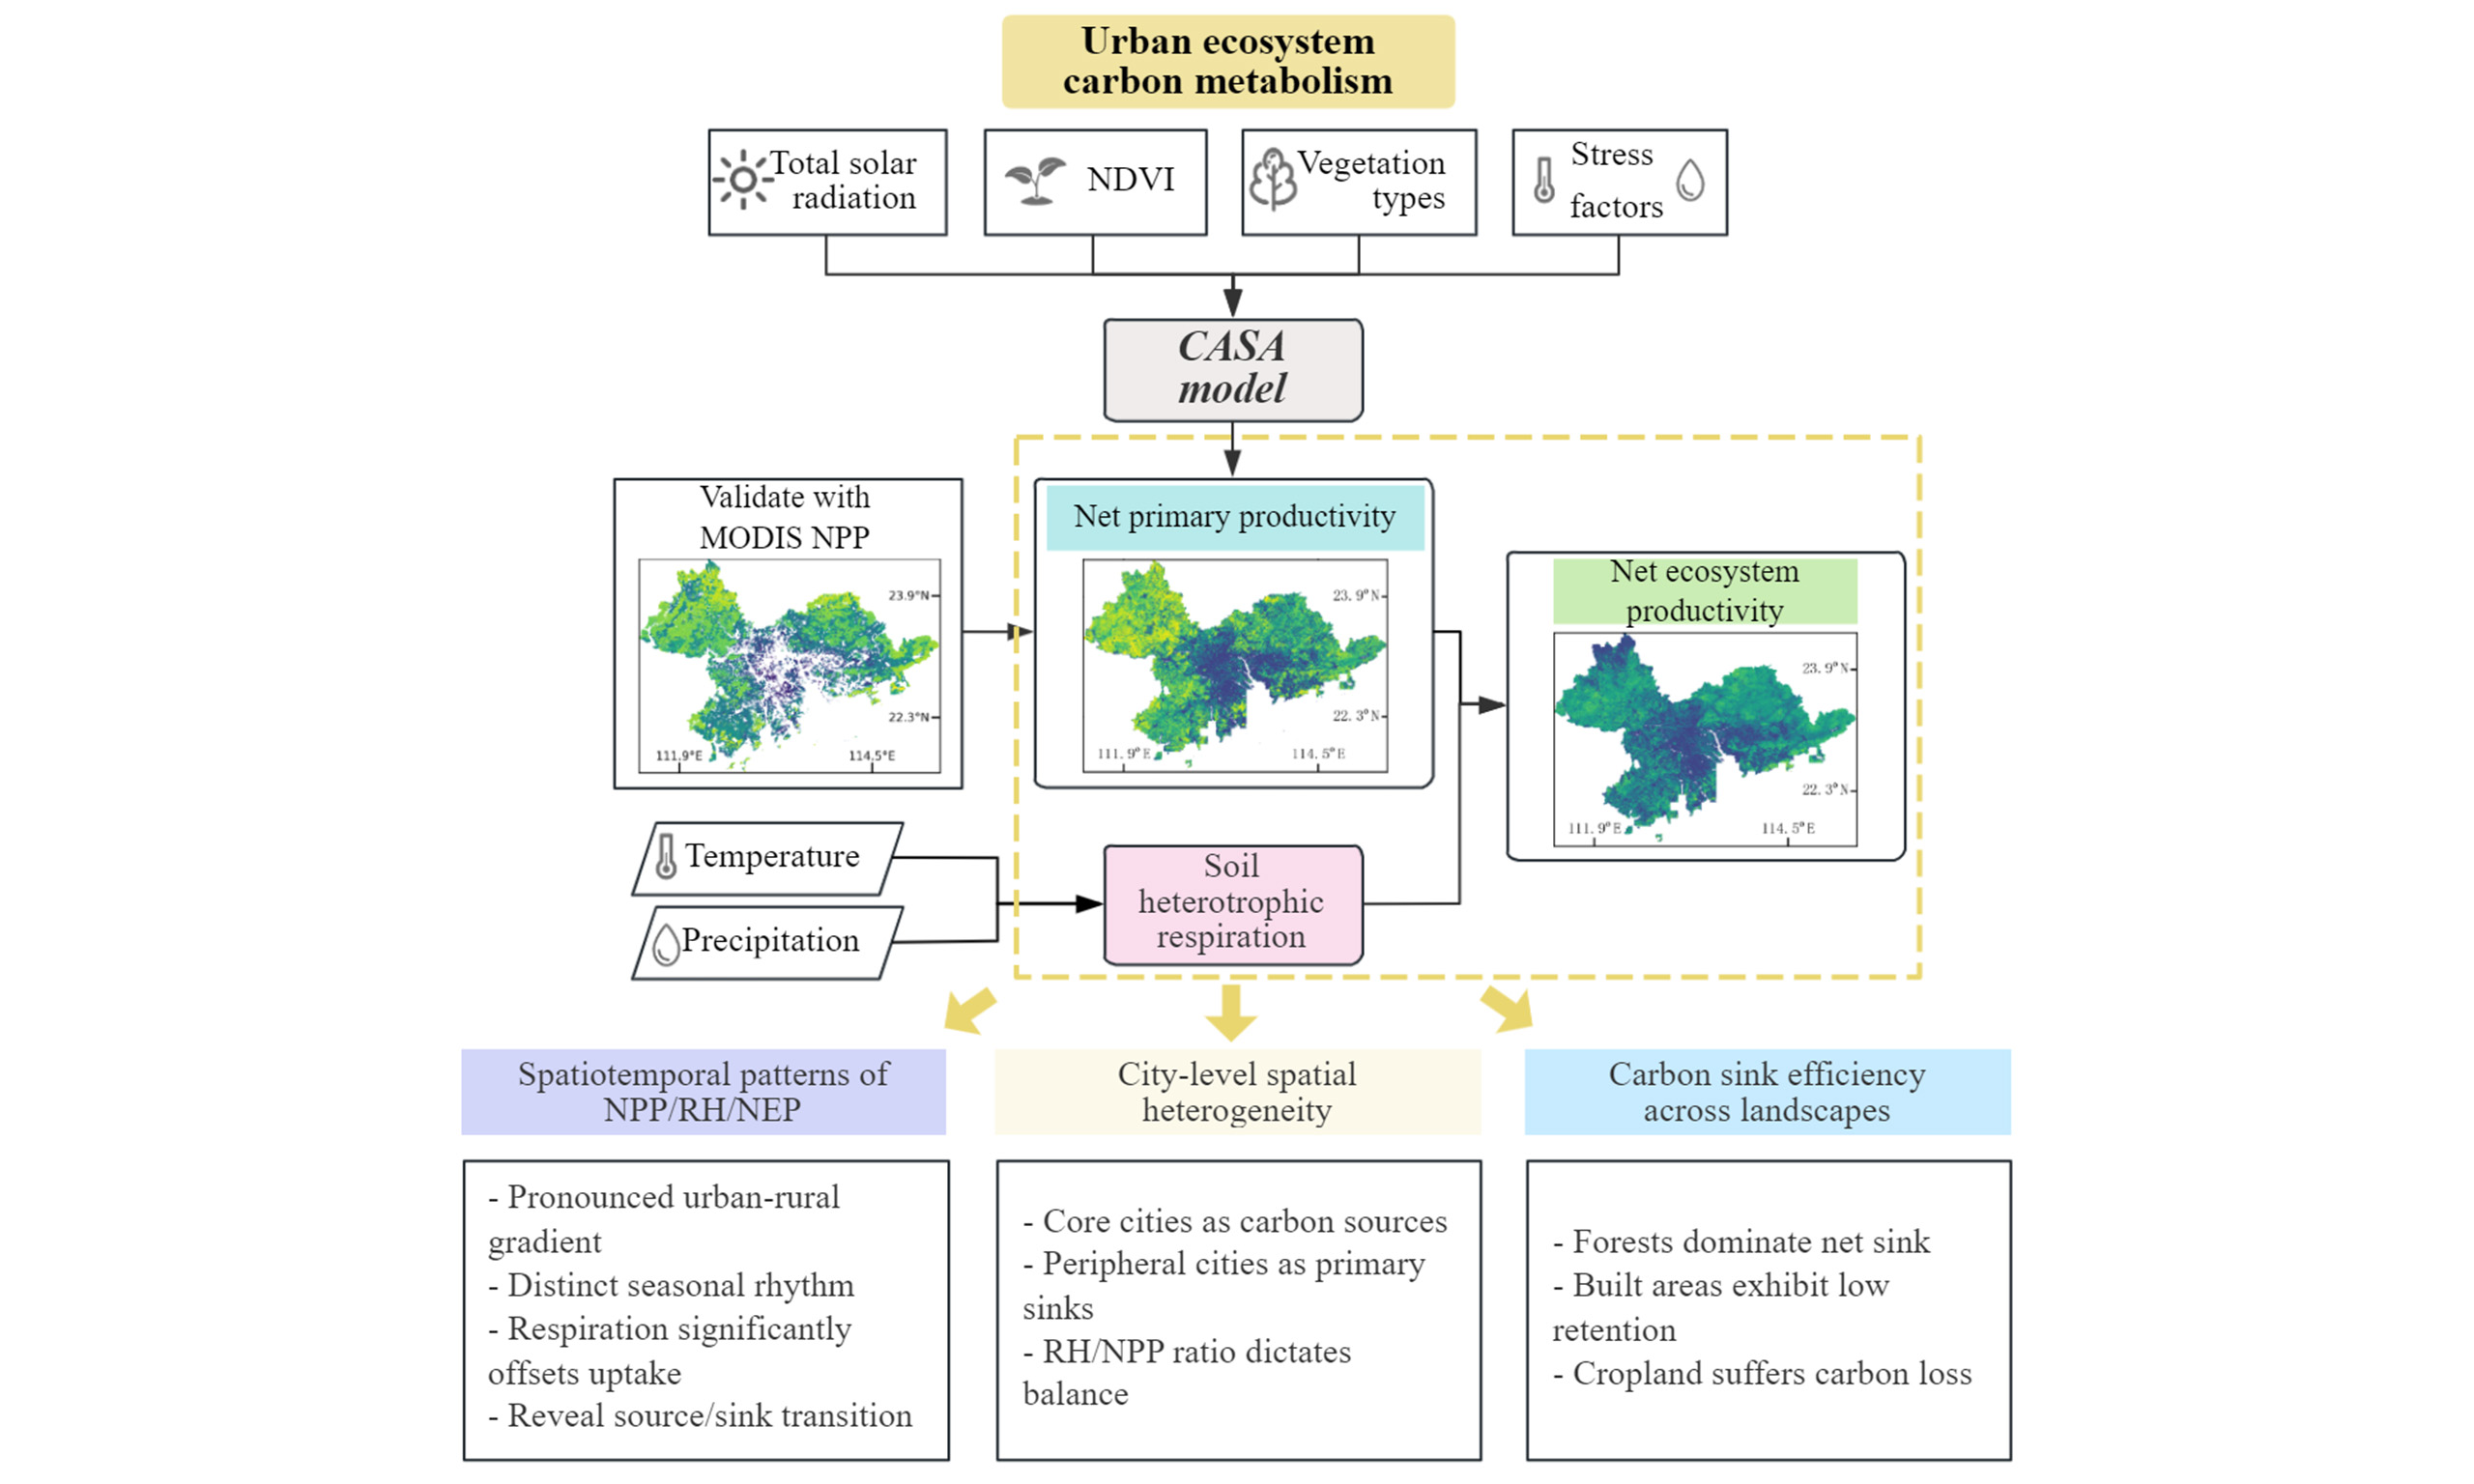
The workflow of our model is shown in Figure 1. The model first collects multi-source remote sensing data and meteorological datasets (ERA5-Land reanalysis data) and performs preprocessing. These input data are calculated using the CASA model to estimate monthly NPP at a resolution of 250 m; the results are validated with MODIS products to ensure reliability. Then, RH is calculated based on temperature and precipitation conditions. Finally, NEP is derived by subtracting RH from NPP, and spatial aggregation and statistical analysis are performed at different scales. The specific methods are discussed in the subsequent section.
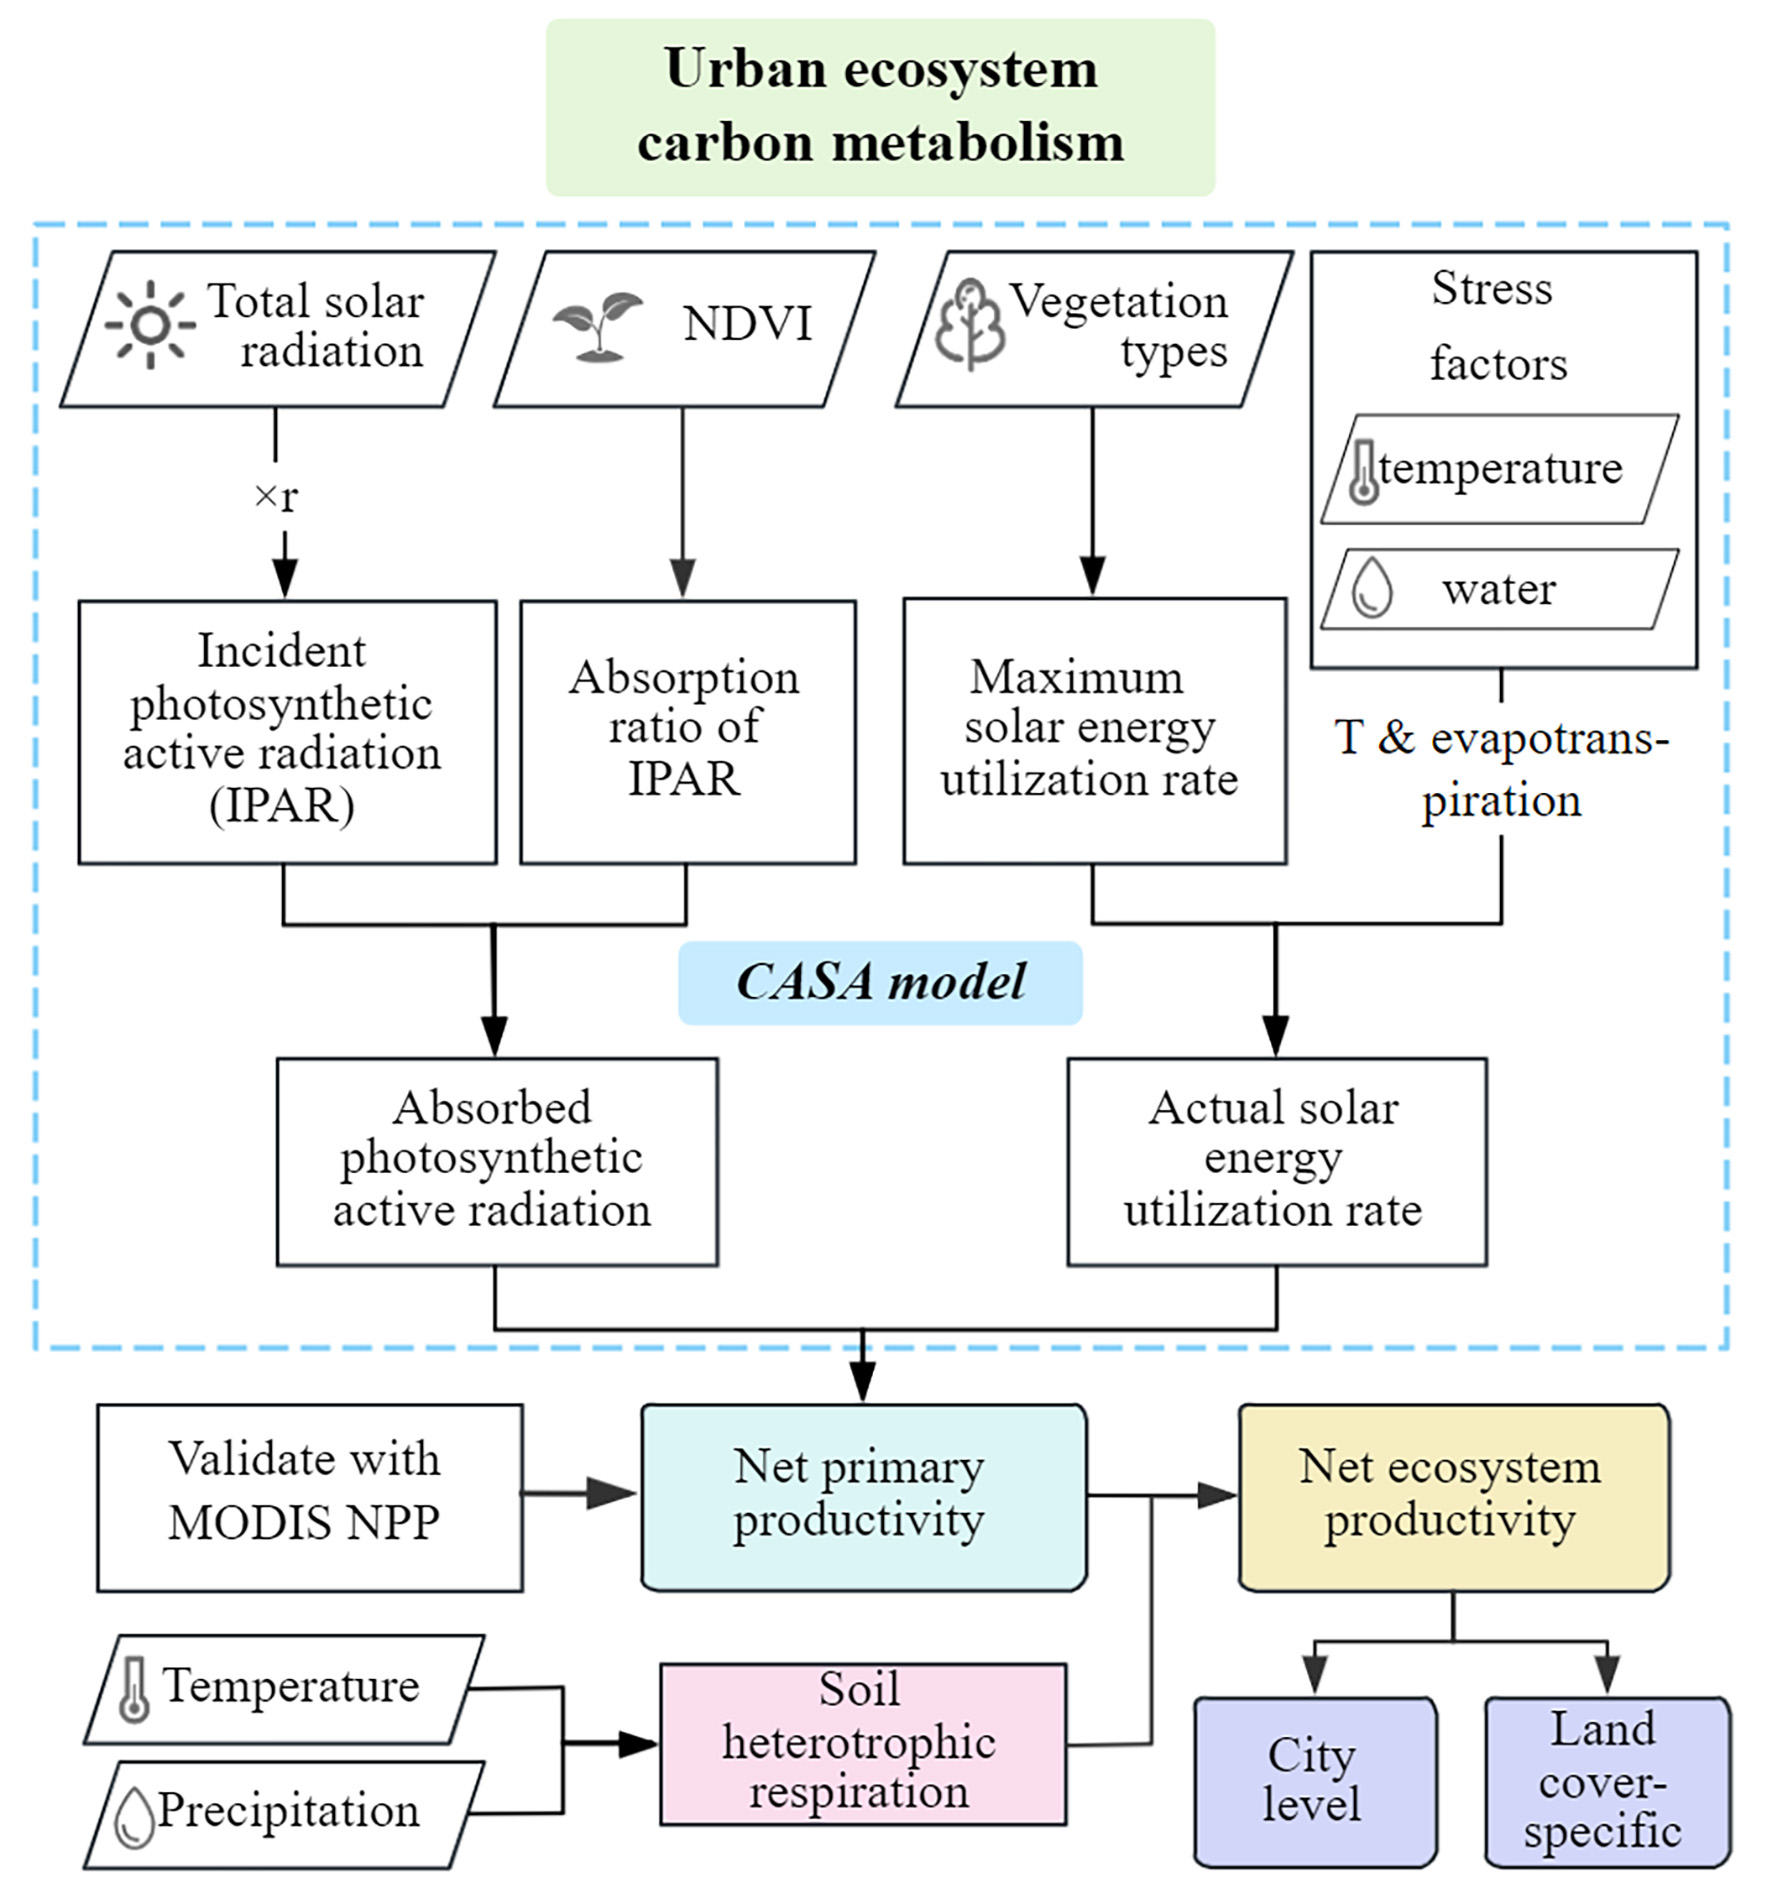
Figure 1. The workflow of this study.
Data sources
The data sources for this study are shown in Table 1. The meteorological data were obtained from the ERA5-Land reanalysis dataset[22], which contains globally gridded monthly averages of surface temperature, total solar radiation, soil evapotranspiration, precipitation, and other variables at a spatial resolution of
Description and sources of the data used in this study
| Data | Description | Spatial resolution | Source |
| SOL | Total solar radiation | 0.1° × 0.1° | ERA5-Land monthly averaged data from Copernicus Climate Data Store |
| T | Temperature of air at 2 m above the surface of the land | ||
| E | Soil evapotranspiration | ||
| PR | Precipitation | ||
| NDVI | Normalized Difference Vegetation Index | 250 m × 250 m | MOD13Q1 v061 from NASA Land Processes Distributed Active Archive Center (LP DAAC) (https://lpdaac.usgs.gov/products/mod13q1v061/) |
| Vegetation type | Vegetation type classification map | 30 m × 30 m | GLC_FCS30-2020 land cover dataset (https://data.casearth.cn/thematic/glc_fcs30/) |
| LULC | LULC classification map | 10 m × 10 m | AI Earth in China (AIEC) (https://engine-aiearth.aliyun.com/#/dataset/DAMO_AIE_CHINA_LC) |
Model calculation and analysis
CASA model for calculating NPP
The process of calculating NPP using the CASA model is as follows[26,27]:
where APAR(x, t) is the photosynthetic active radiation (MJ∙m-2∙month-1) absorbed by pixel x in month t, and ε(x, t) is the actual solar energy utilization rate (gC∙MJ-1) of pixel x in month t. APAR is calculated as follows:
where SOL(x, t) is the total solar radiation at pixel x in month t, and r is the proportion of incident photosynthetic active radiation (IPAR) utilized by plants (wavelengths 0.4~0.7 μm) to total solar radiation. Research has shown that this parameter can be taken as a constant of 0.5[26]. FPAR(x, t) is the absorption ratio of the vegetation layer to IPAR, which has a linear relationship with NDVI. It is calculated as follows, with specific algorithms detailed in Supplementary Text 1.
The actual solar energy utilization rate ε is calculated as follows:
where Tε1(x, t) and Tε2(x, t) are low and high temperature stress factors, Wε(x, t) is the water stress factor, reflecting the stress effects of temperature and water conditions on solar energy utilization, respectively.
where Topt(x) is the optimal temperature for plant growth, usually taken as the average temperature of the month when NDVI is highest within a year, and T(x, t) is the monthly average temperature. EP(x, t) is the regional potential evapotranspiration (mm), and E(x, t) is the regional actual evapotranspiration (mm).
Potter et al. suggested that the maximum solar energy utilization rate εmax for global vegetation is
Integrated model for calculating NEP
The net primary productivity NPP reflects the net carbon sequestration of vegetation in the urban ecosystem, which is the total energy accumulated by photosynthesis minus the respiration consumption of plants themselves, but still cannot represent the net carbon sink of the ecosystem in the region. Instead, the soil heterotrophic respiration RH should be subtracted to obtain the net ecosystem productivity NEP, as shown in Equation (8).
Soil heterotrophic respiration is related to multiple environmental factors, with temperature and precipitation being the two most important factors. Pei et al.[19] established the regression relationship between temperature, precipitation and soil respiration based on MODIS data and the measured data at the experimental site, and estimated the distribution of soil heterotrophic respiration carbon emissions, as shown in Equation (9), which was proved to be a universal empirical model by the research and application of Xu[15], Pan et al.[28].
where T represents temperature (°C) and R represents precipitation (mm). The monthly temperature and precipitation data of ERA5-Land were used to calculate the soil respiration of the ecosystem in PRD according to the above equation. Finally, the model calculation of carbon sinks has been completed, allowing for further analysis of the spatiotemporal changes and influencing factors of urban carbon sinks in the PRD region.
Spatial analysis at the city level and across different land cover types
To analyze the spatial patterns of urban carbon metabolism across the PRD region, we implemented a multi-scale spatial analysis framework integrating zonal statistics and land cover-based aggregation. We extracted carbon sink values for each administrative city boundary using zonal statistics in ArcGIS, calculating mean and total NPP, NEP, and RH values for all 250 m pixels within each city polygon. This enabled direct comparison of carbon dynamics across the nine PRD cities while preserving the original model resolution.
For land cover-specific analysis, we overlaid the 10 m-resolution LULC map with our 250 m carbon flux grids using a majority resampling approach. Carbon sink values were then aggregated by six dominant land cover classes (forest, cropland, grassland, water, built-up, and bare land) through zonal calculations. To address mixed pixels at urban-rural interfaces, we applied a fractional cover weighting scheme where each 250 m pixel’s contribution was weighted by its percentage of each land cover type derived from the higher-resolution LULC data. All spatial operations maintained the original measurement units
RESULTS
Spatiotemporal patterns of vegetation productivity across the urban-rural continuum
Our analysis reveals distinct spatiotemporal patterns of vegetation productivity in the urban-rural continuum of PRD in 2021-2022, as quantified by the CASA model at a resolution of 250 m [Figure 2A]. The subtropical monsoon climate, characterized by abundant sunshine and distinct seasons, creates a clear seasonal rhythm for vegetation productivity. Solar radiation emerges as the primary driver of this variability, with winter months (December to March) showing lower NPP values (< 40 gC·m-2·month-1) in stark contrast to summer peaks (June to September). The spatial dimension of this continuum shows a gradual transition from high-productivity forest communities at the edges of mountainous areas (exceeding
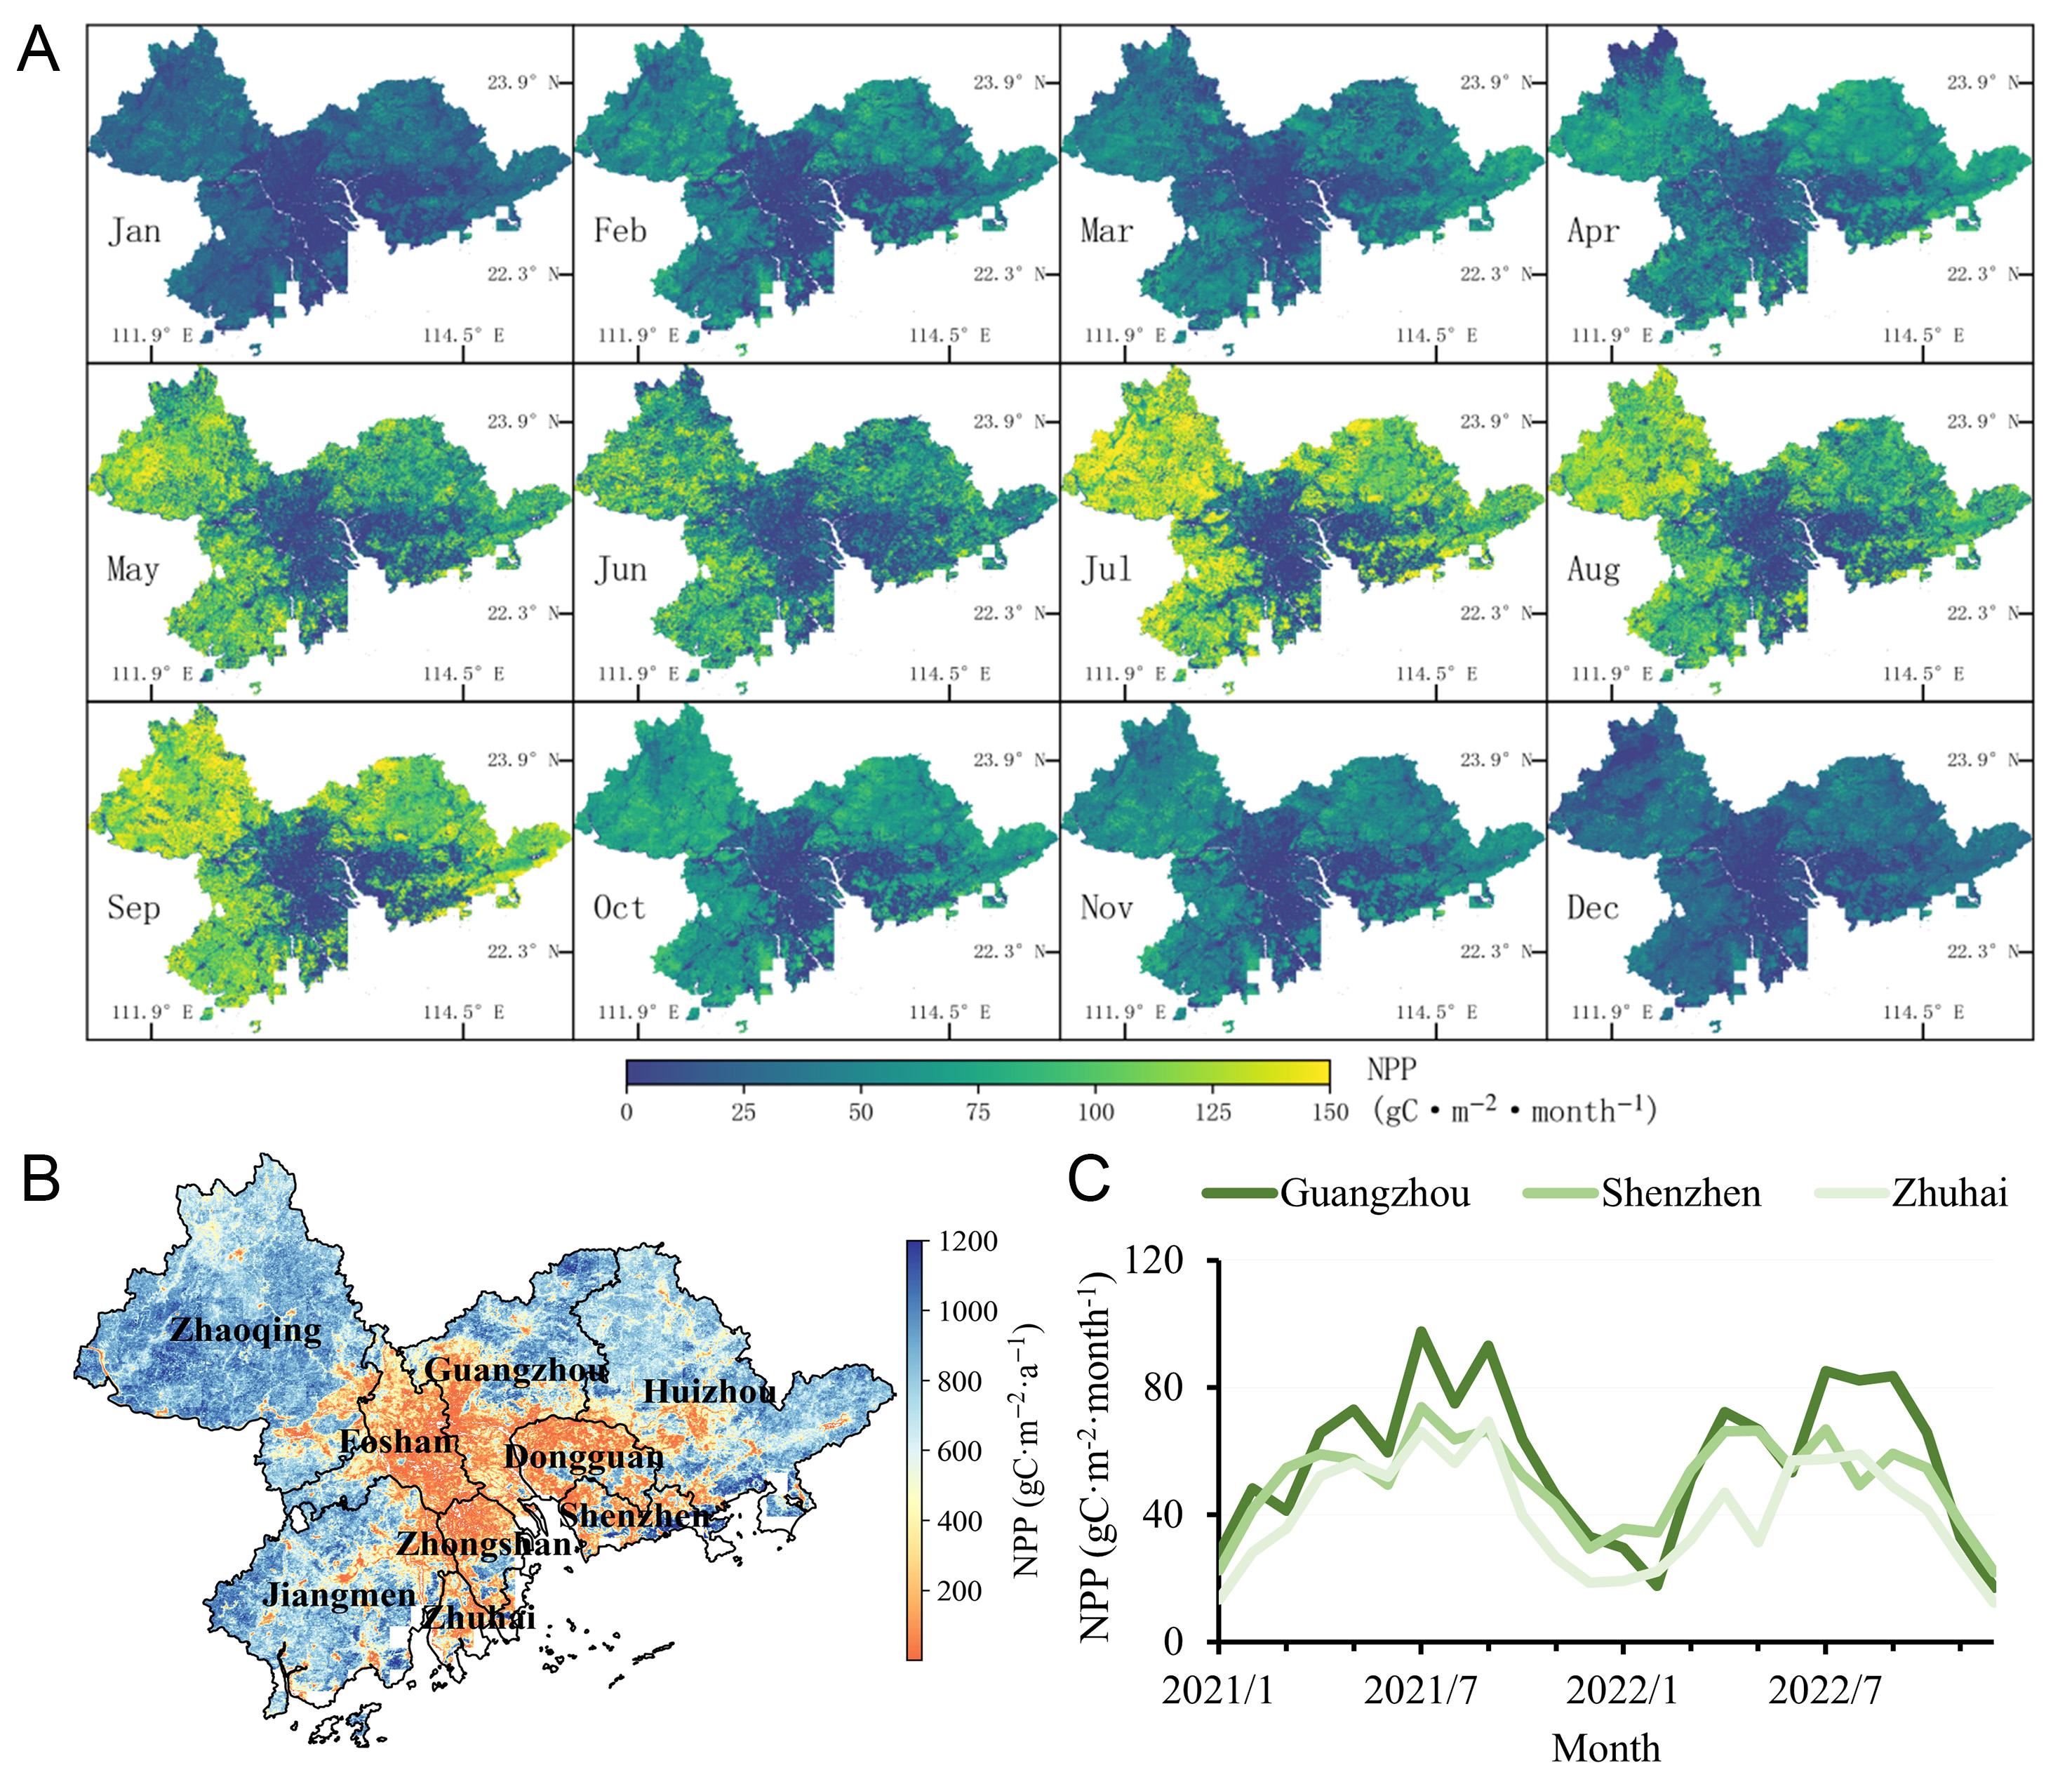
Figure 2. Monthly (A) and annual (B) NPP distribution in PRD in 2021. (C) Monthly NPP changes of Guangzhou, Shenzhen, and Zhuhai during 2021-2022.
We also computed the monthly average NPP for three major cities, Guangzhou, Shenzhen, and Zhuhai, as shown in Figure 2C. These three cities each have their own characteristics within the PRD region and serve as typical and representative examples for studying carbon sink changes in the region. The monthly NPP variations of the three cities exhibit synchronous seasonal patterns but differ in amplitude. All three cities exhibit productivity peaks during the summer, exceeding 60 gC·m-2·month-1, corresponding to favorable temperature and humidity conditions. However, Guangzhou maintains 20 gC·m-2·month-1 higher NPP than the other two cities, attributable to its greater preserved forest cover in Conghua District. Additionally, Guangzhou exhibits the most pronounced seasonality, with winter NPP dropping to 31% of summer values due to stronger monsoon influences. Notably, all cities experienced a midsummer decline (July to August), which may reflect heat stress and typhoon disturbances.
Net ecosystem carbon dynamics mediated by productivity-respiration coupling mechanisms
Our findings demonstrate how the productivity-respiration coupling mechanism controls net ecosystem carbon dynamics across the entire PRD region. Monthly NEP maps reveal significant spatial heterogeneity in the region [Figure 3A], with values systematically lower than corresponding NPP estimates due to the effect of soil heterotrophic respiration (RH). Annual average NEP [Figure 3B] ranges from -40 to 638 gC·m-2·month-1 across all cities, showing strong land cover dependence. Forested mountainous areas maintain the highest carbon sink capacity
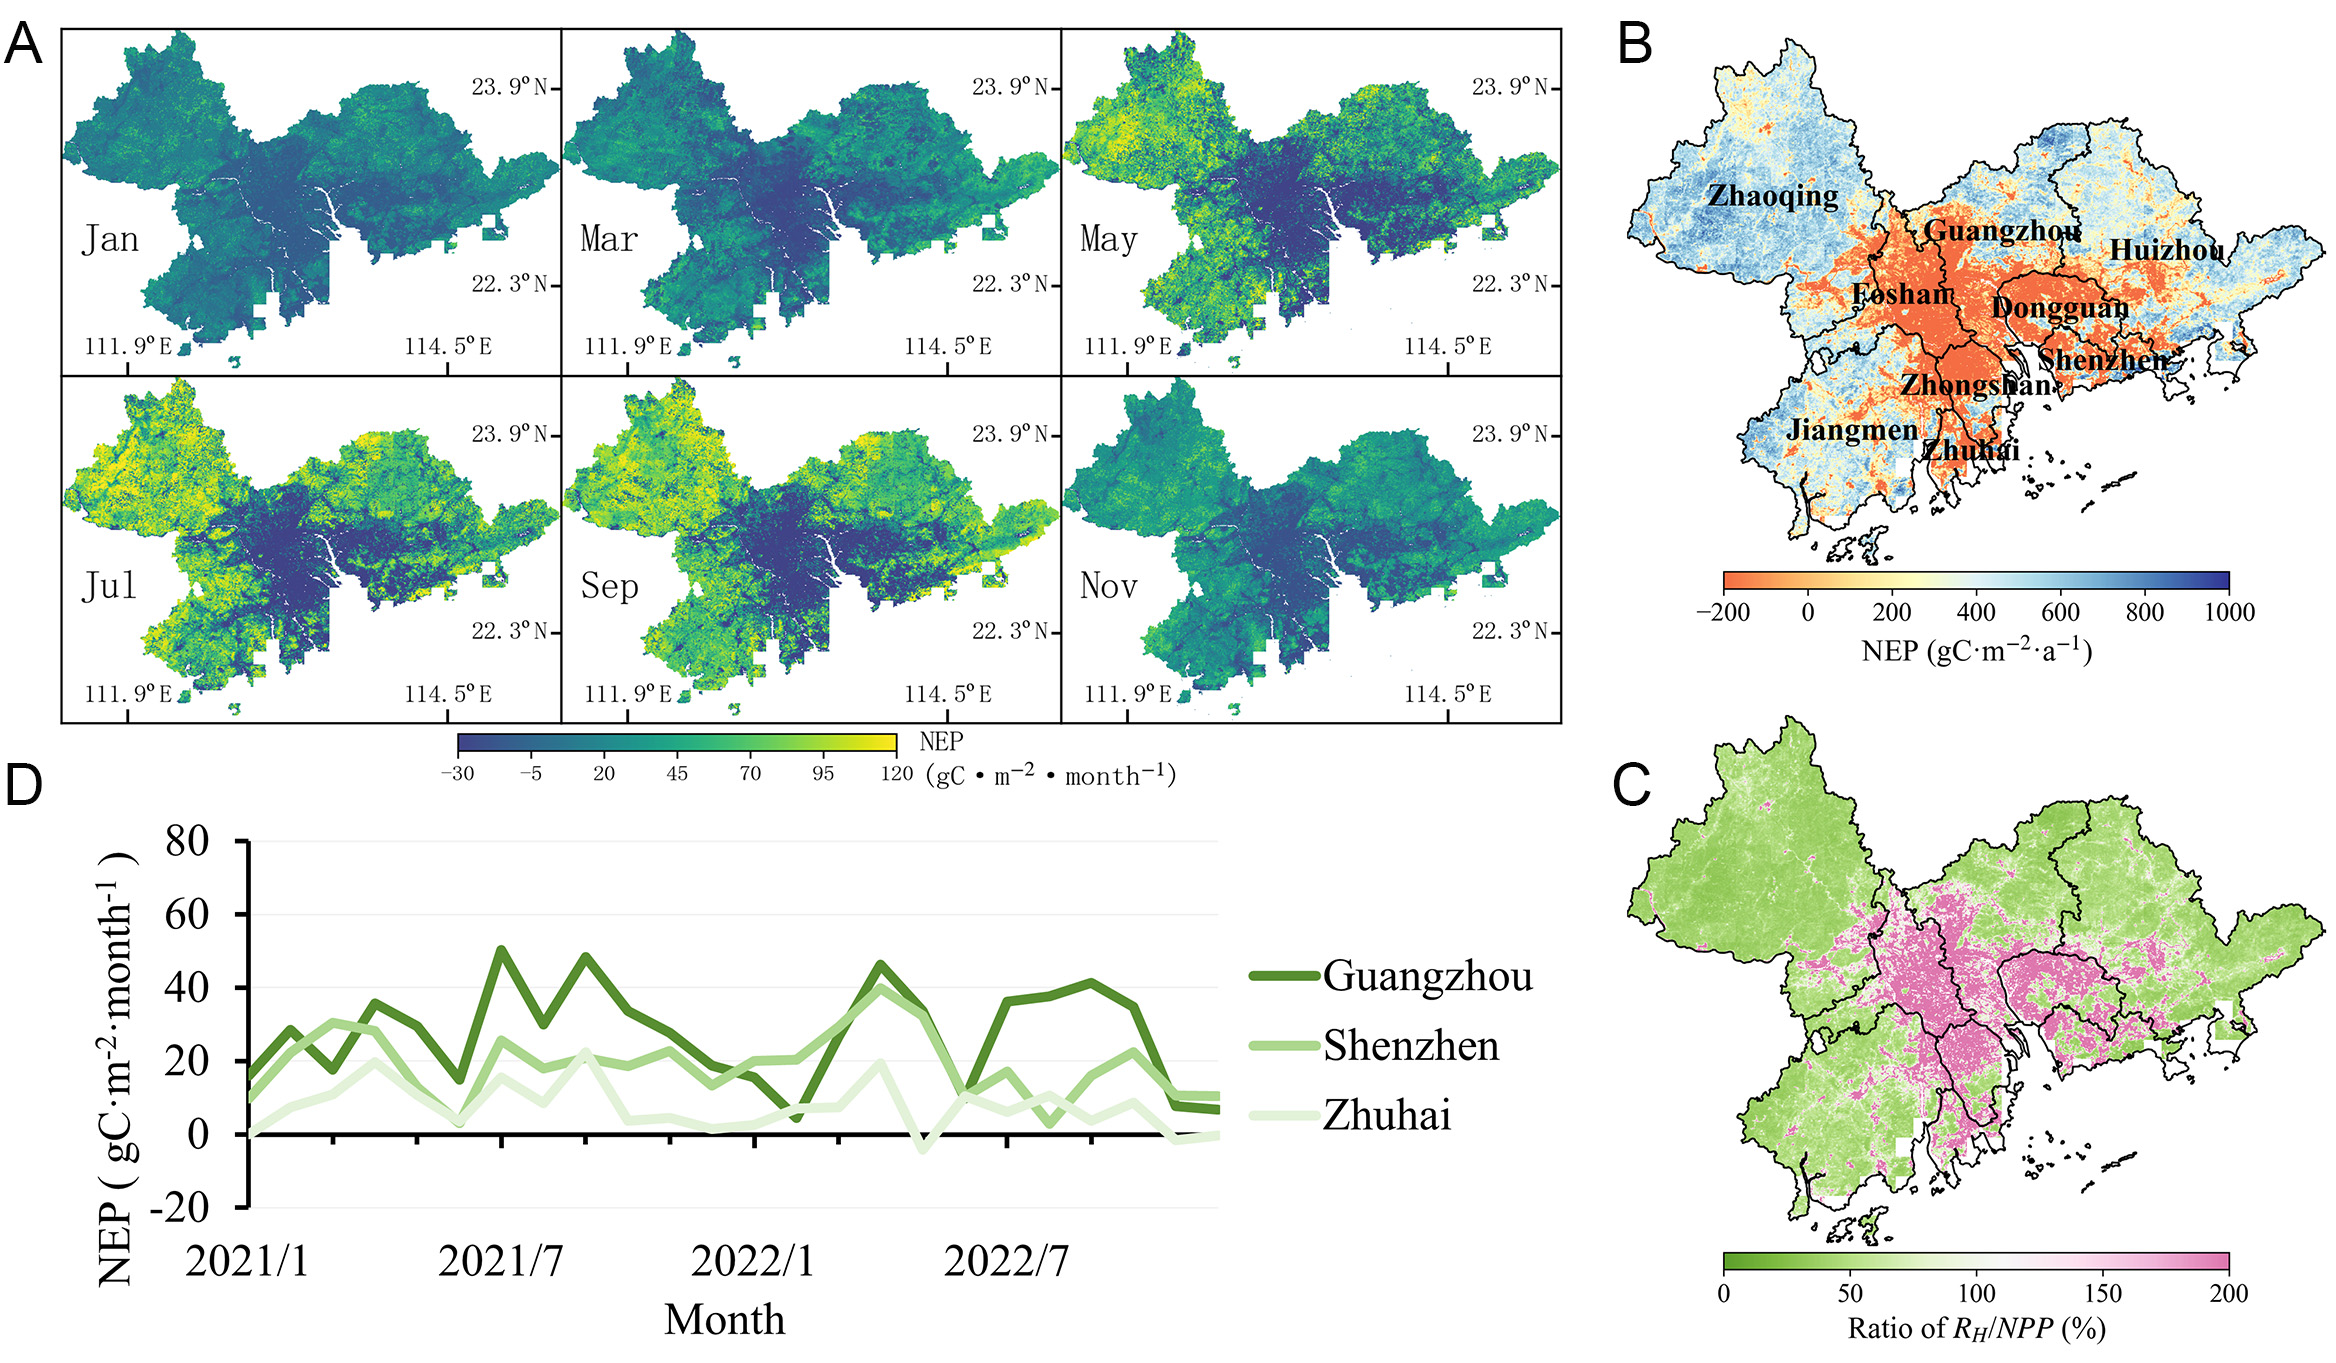
Figure 3. Monthly (A) and annual (B) NEP distribution in PRD in 2021. (C) Ratio of RH/NPP in PRD in 2021. (D) Monthly NEP changes of Guangzhou, Shenzhen, and Zhuhai during 2021-2022.
The monthly NEP changes in Guangzhou, Shenzhen, and Zhuhai [Figure 3D] reflect how RH regulates the net carbon balance. These three cities all exhibit a similar seasonal pattern compared to NPP, but with a lower amplitude of approximately 55%. The RH/NPP ratio ranges from 45% in winter to 60% in summer, reflecting temperature-dependent decomposition rates. Guangzhou maintains the highest annual NEP (326.1 gC·m-2·a-1), attributed to relatively high NPP and lower RH due to well-preserved soil conditions. In May 2022, Zhuhai experienced a notable divergence, with NEP turning negative (-5 gC·m-2·month-1) as RH exceeded net primary productivity, potentially due to the combined effects of typhoon-induced litterfall and accelerated decomposition[29,30]. These interrelated phenomena underscore the urgent need to integrate vegetation productivity and spatially heterogeneous RH drivers when assessing urban carbon sink dynamics, particularly in anthropogenically modified landscapes where traditional ecosystem models may underestimate respiratory fluxes.
Spatial heterogeneity in city-level carbon metabolism
Analysis of city-level carbon sink characteristics reveals spatial heterogeneity in carbon metabolism across the PRD region (see Figure 4). Zhaoqing emerged as the strongest carbon sink in the region, with an annual NEP of 637.5 gC·m-2·a-1, attributed to its extensive forest coverage, which maintained relatively low heterotrophic respiration of 342.9 gC·m-2·a-1. This surrounding carbon sink belt, including Huizhou
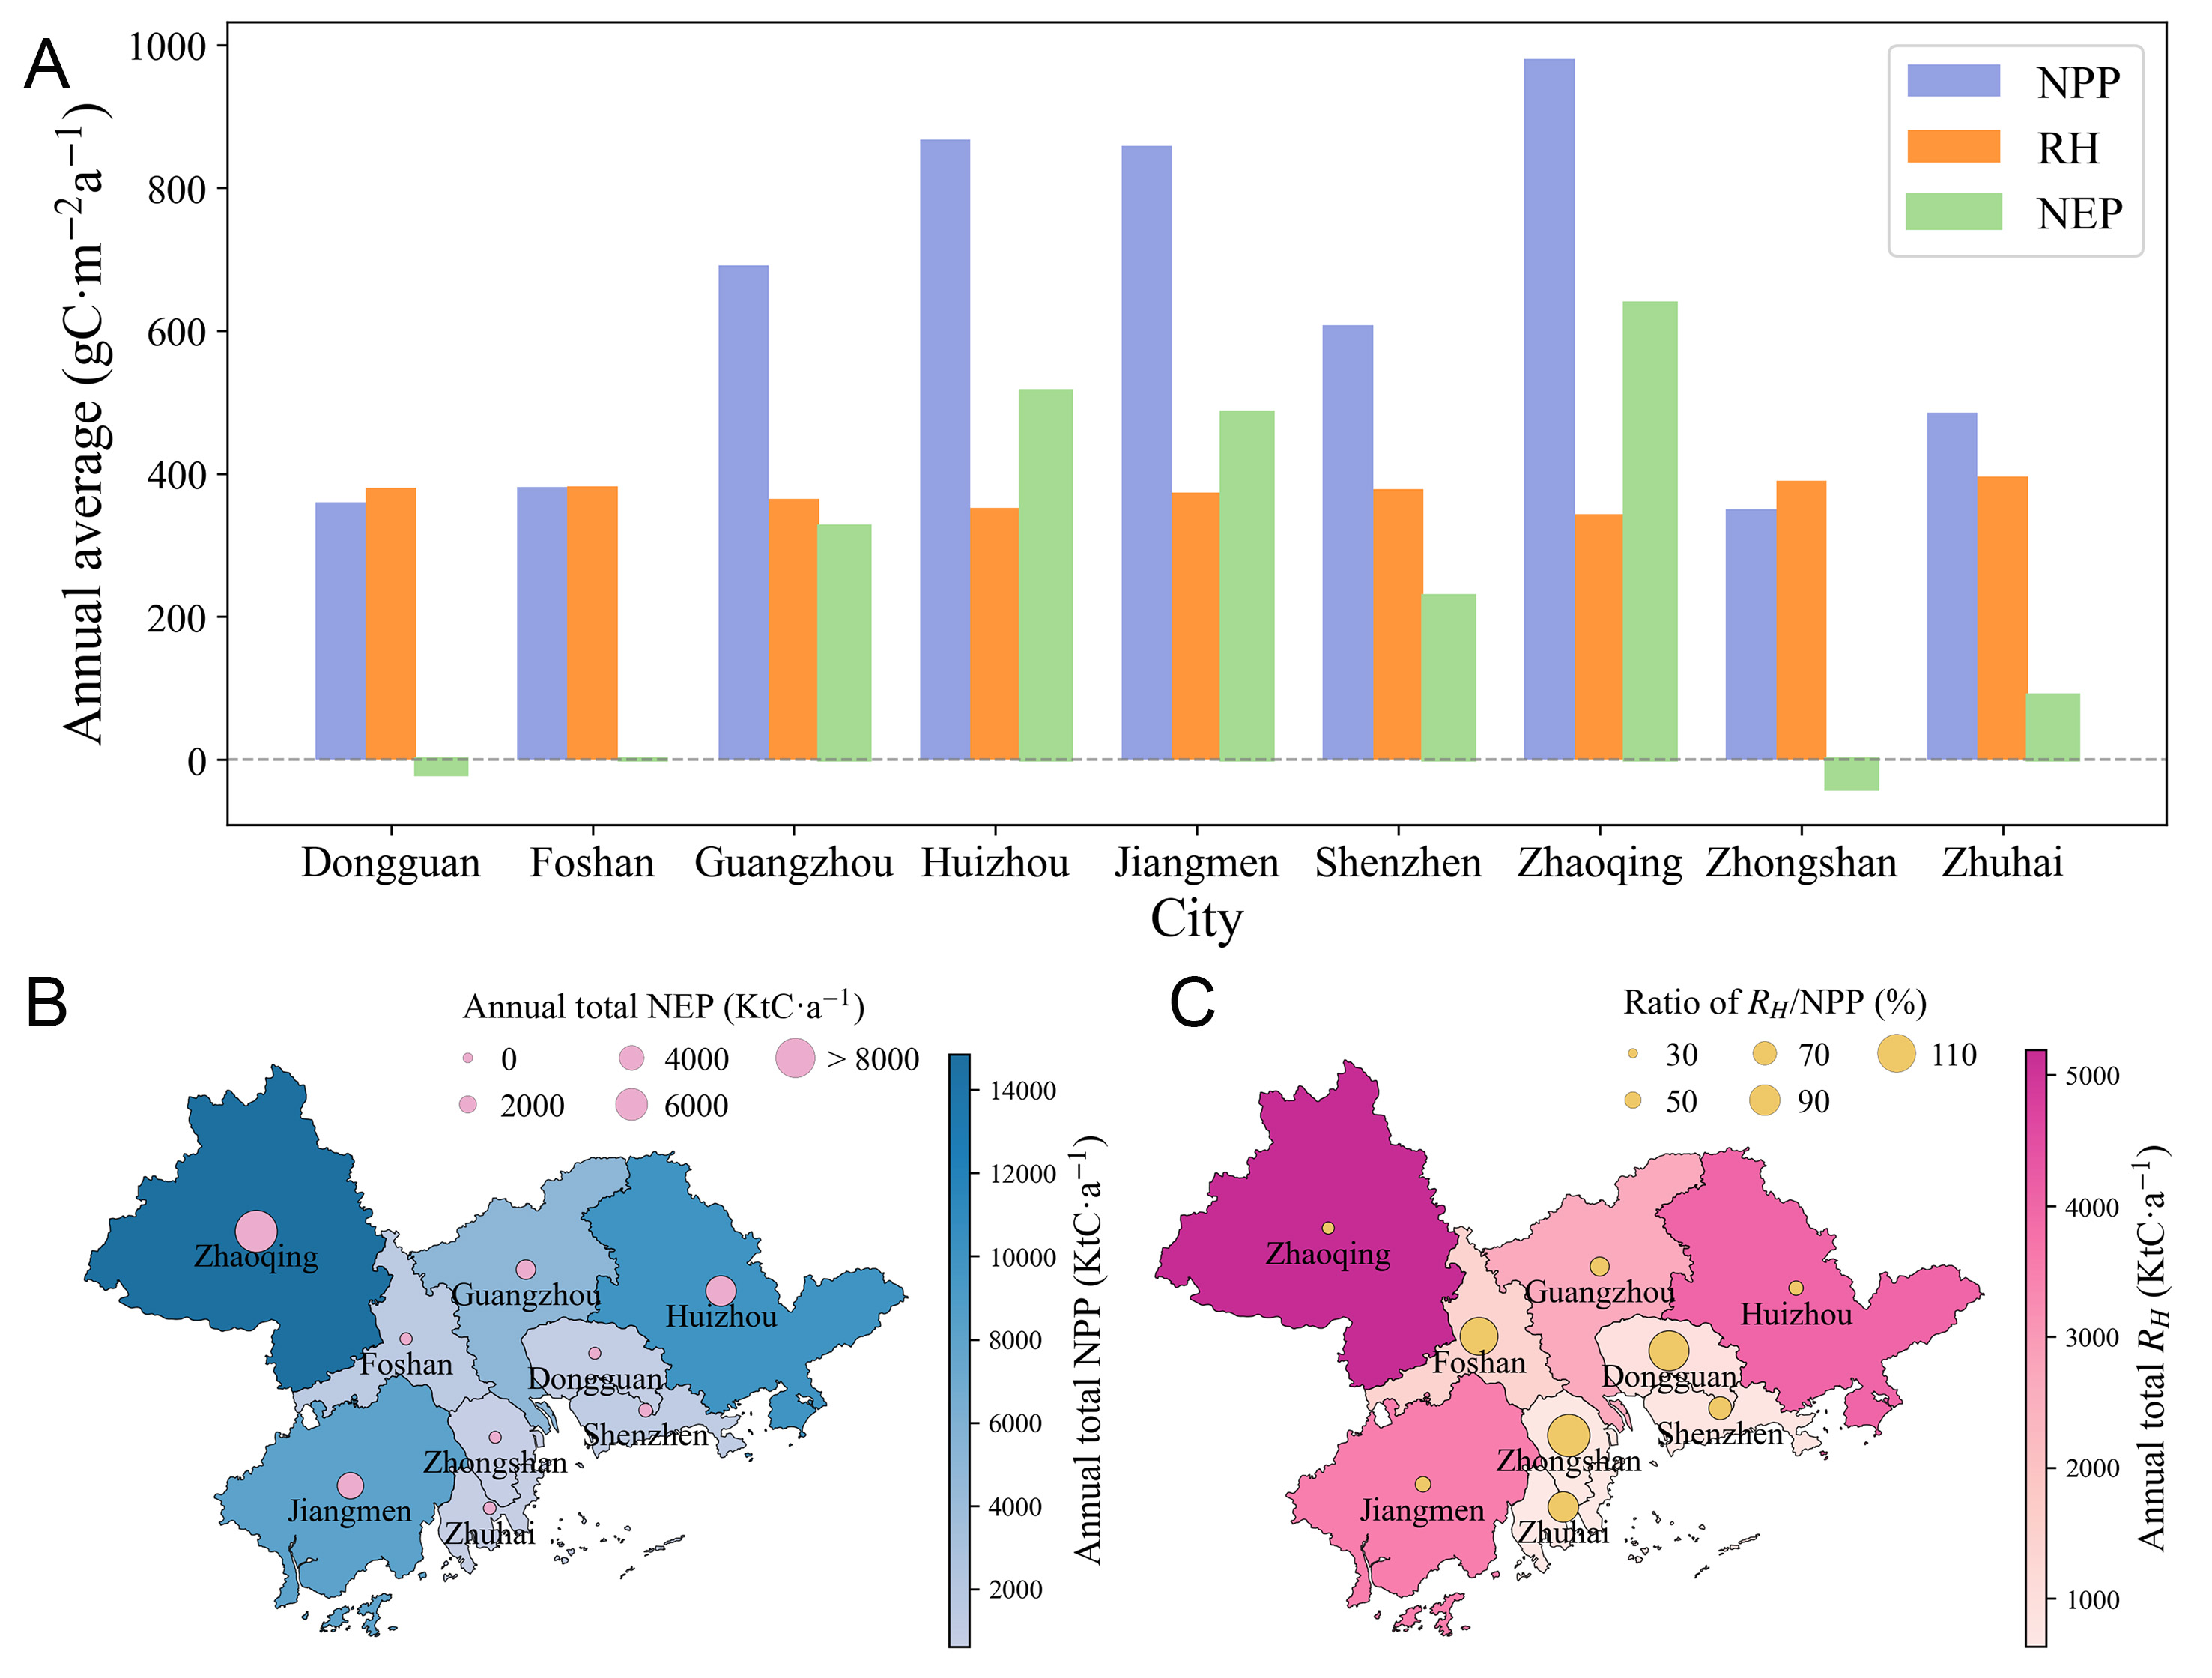
Figure 4. (A) Annual mean NPP, RH and NEP of PRD cities. (B) Annual total NPP and NEP distribution of PRD cities. (C) Annual total RH and ratio of RH /NPP distribution. The complete data are shown in Supplementary Table 1.
When examining the RH/NPP ratio between cities [Figure 4C], the urban-rural gradient becomes evident. Most urbanized areas have respiration rates exceeding 75%, with Dongguan (105.6%) and Zhongshan (111.5%) showing that respiration processes completely offset productivity. This contrasts sharply with forest-dominated Zhaoqing (35.0%) and Huizhou (40.6%), where lower temperatures and continuous vegetation cover maintain effective carbon storage. Guangzhou offers an interesting intermediate case, achieving a 52.8% RH/NPP balance ratio through carefully designed green infrastructure policies, with 41.6% of its area retained as forests despite its megacity status.
The city-level analysis provides important insights for regional carbon management. Zhaoqing leads in terms of NEP efficiency per unit area, with its large vegetation area contributing significantly to regional carbon budgets (accounting for 41.9% of total NEP), highlighting the value of suburban green spaces in urban carbon strategies. Shenzhen’s moderate NEP (229.1 gC·m-2·a-1) translates into a limited total quantity (450.9 KtC·a-1), as nearly half of its area is built-up, indicating that compact cities require innovative vertical greening methods[31]. Generally, considering natural disturbances such as pest infestation and wildfires in addition to soil respiration[32], the RH/NPP threshold is around 80%. Exceeding this threshold may cause urban ecosystems to transition into net carbon sources.
Zhuhai represents a notable exception in the regional pattern, as it maintains a green coverage rate of 34.2% but has an unusually high RH (395.6 gC·m-2·a-1). This anomaly may stem from its unique coastal conditions, where saline soils enhance organic matter mineralization[33], and frequent typhoons increase the input of active carbon through decomposition pathways[34,35]. The city’s NPP (484.9 gC·m-2·a-1) is extremely low relative to its climatic potential, further suggesting that landscape management related to tourism may be altering microbial community dynamics. These results highlight the necessity of coastal adjustments to carbon sink models in urban ecological assessments. Furthermore, the findings fully demonstrate the benefits of our high-resolution results on city-level carbon metabolism. In the absence of detailed carbon sink inventories (e.g., at the county level or below), such results can be extended to finer spatial scales to support carbon neutrality policies in small regions.
Landscape configuration controls on carbon sink efficiency in urban ecosystems
Our analysis indicates that landscape configuration fundamentally controls the carbon sink efficiency of the entire PRD urban ecosystem [Figure 5]. Forests are the primary carbon sinks, accounting for 48.3% of total NPP and 55.1% of total NEP. Despite covering a relatively small landscape area, they still exhibit high carbon retention efficiency. This significant contribution highlights the critical role of forests in regional carbon sequestration, where more carbon is stored than released through respiration compared to other ecosystems. Built areas and croplands exhibit differentiated carbon flux characteristics. Although built land contributes significantly to NPP (26.2%, 1,731.3 KtC·a-1), its NEP contribution drops to 21.7%, reflecting the impact of urban respiration processes. Cropland exhibits a similar but less pronounced pattern, with NPP
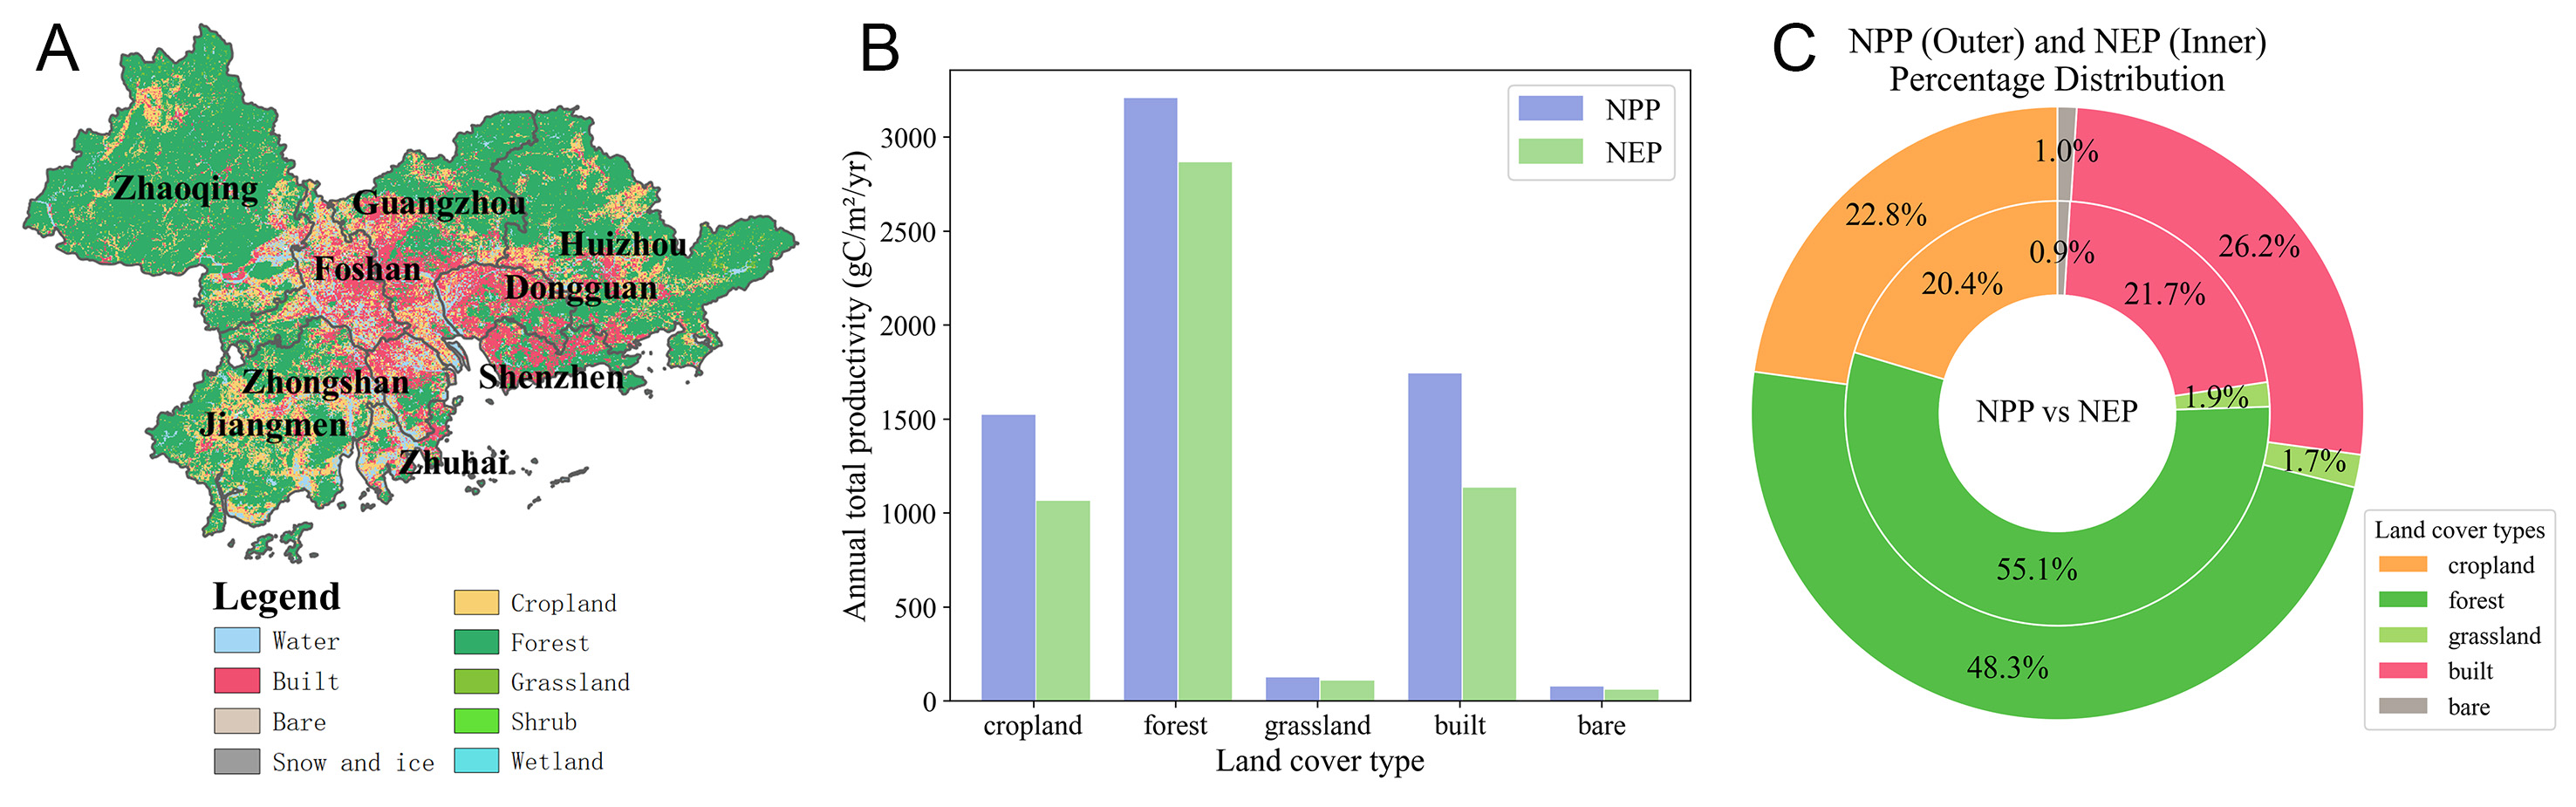
Figure 5. (A) LULC classification map of the PRD region. (B) Annual total amount of NPP and NEP by LULC types. (C) Percentage distribution of NPP and NEP by LULC types.
The role of grasslands and bare land in the carbon budget of the study area is relatively minor. Grassland carbon conversion ranges from 114.4 KtC·a-1 NPP to 96.4 KtC·a-1 NEP, but due to its limited spatial extent, its contribution is small, accounting for 1.7% of total NPP and 1.9% of total NEP. Bare land has an even more negligible effect, accounting for less than 1% of both NPP and NEP. Water bodies and snow- and ice-covered areas were excluded from analysis because their respiration dynamics cannot be objectively represented by the current model. Overall, these findings highlight the importance of forest conservation in mitigating climate change while revealing the complex carbon dynamics of the PRD’s diverse landscape mosaic.
DISCUSSION
This study reveals pronounced spatiotemporal heterogeneity in urban carbon metabolism across the Pearl River Delta. At the regional scale, forests emerge as the dominant contributors to net carbon sinks, accounting for more than half of total NEP, whereas urban cores such as Dongguan and Zhongshan function as net carbon sources due to respiration exceeding productivity. The RH/NPP ratio, which varied substantially among cities and land cover types, proved to be a critical indicator of ecosystem carbon balance, with values above 80% signaling a transition toward carbon source conditions. These findings underscore the importance of high-resolution assessments for capturing fine-scale metabolic differences, thereby providing essential insights into the mechanisms and thresholds that govern urban carbon dynamics. Building on these results, the following sections discuss model validation, uncertainties, and the policy implications of our framework.
Model validation and uncertainty analysis
To evaluate the accuracy of the CASA model in estimating NPP results, we compared the MODIS NPP data product (MOD17A3HGF)[5] with the CASA model estimation results, as shown in Figure 6. The temporal resolution of MODIS NPP data is annual, and the spatial resolution is 500 m. Some pixels are missing due to cloud cover in the original data. The NPP estimation results of the CASA model are monthly data with a spatial resolution of 250 m, which is more precise than MODIS NPP in terms of spatiotemporal resolution. Therefore, we consider conducting an annual summation of the CASA model results, and then taking a certain number of sample points from the MODIS and CASA datasets within the same latitude and longitude range to compare the differences in NPP means. We randomly selected 2,395 sets of sample points based on a 500 m × 500 m grid and conducted correlation analysis. The results show that the NPP results estimated by the CASA model have a significant correlation with the MODIS data, with an R2 value of 0.79 and a root mean square error RMSE of approximately 231. This indicates that the differences between the two datasets are small and the NPP results have high credibility. Moreover, the CASA model’s NPP estimates are more precise in spatiotemporal resolution compared to MODIS data, which can be further used for relevant research and analysis.
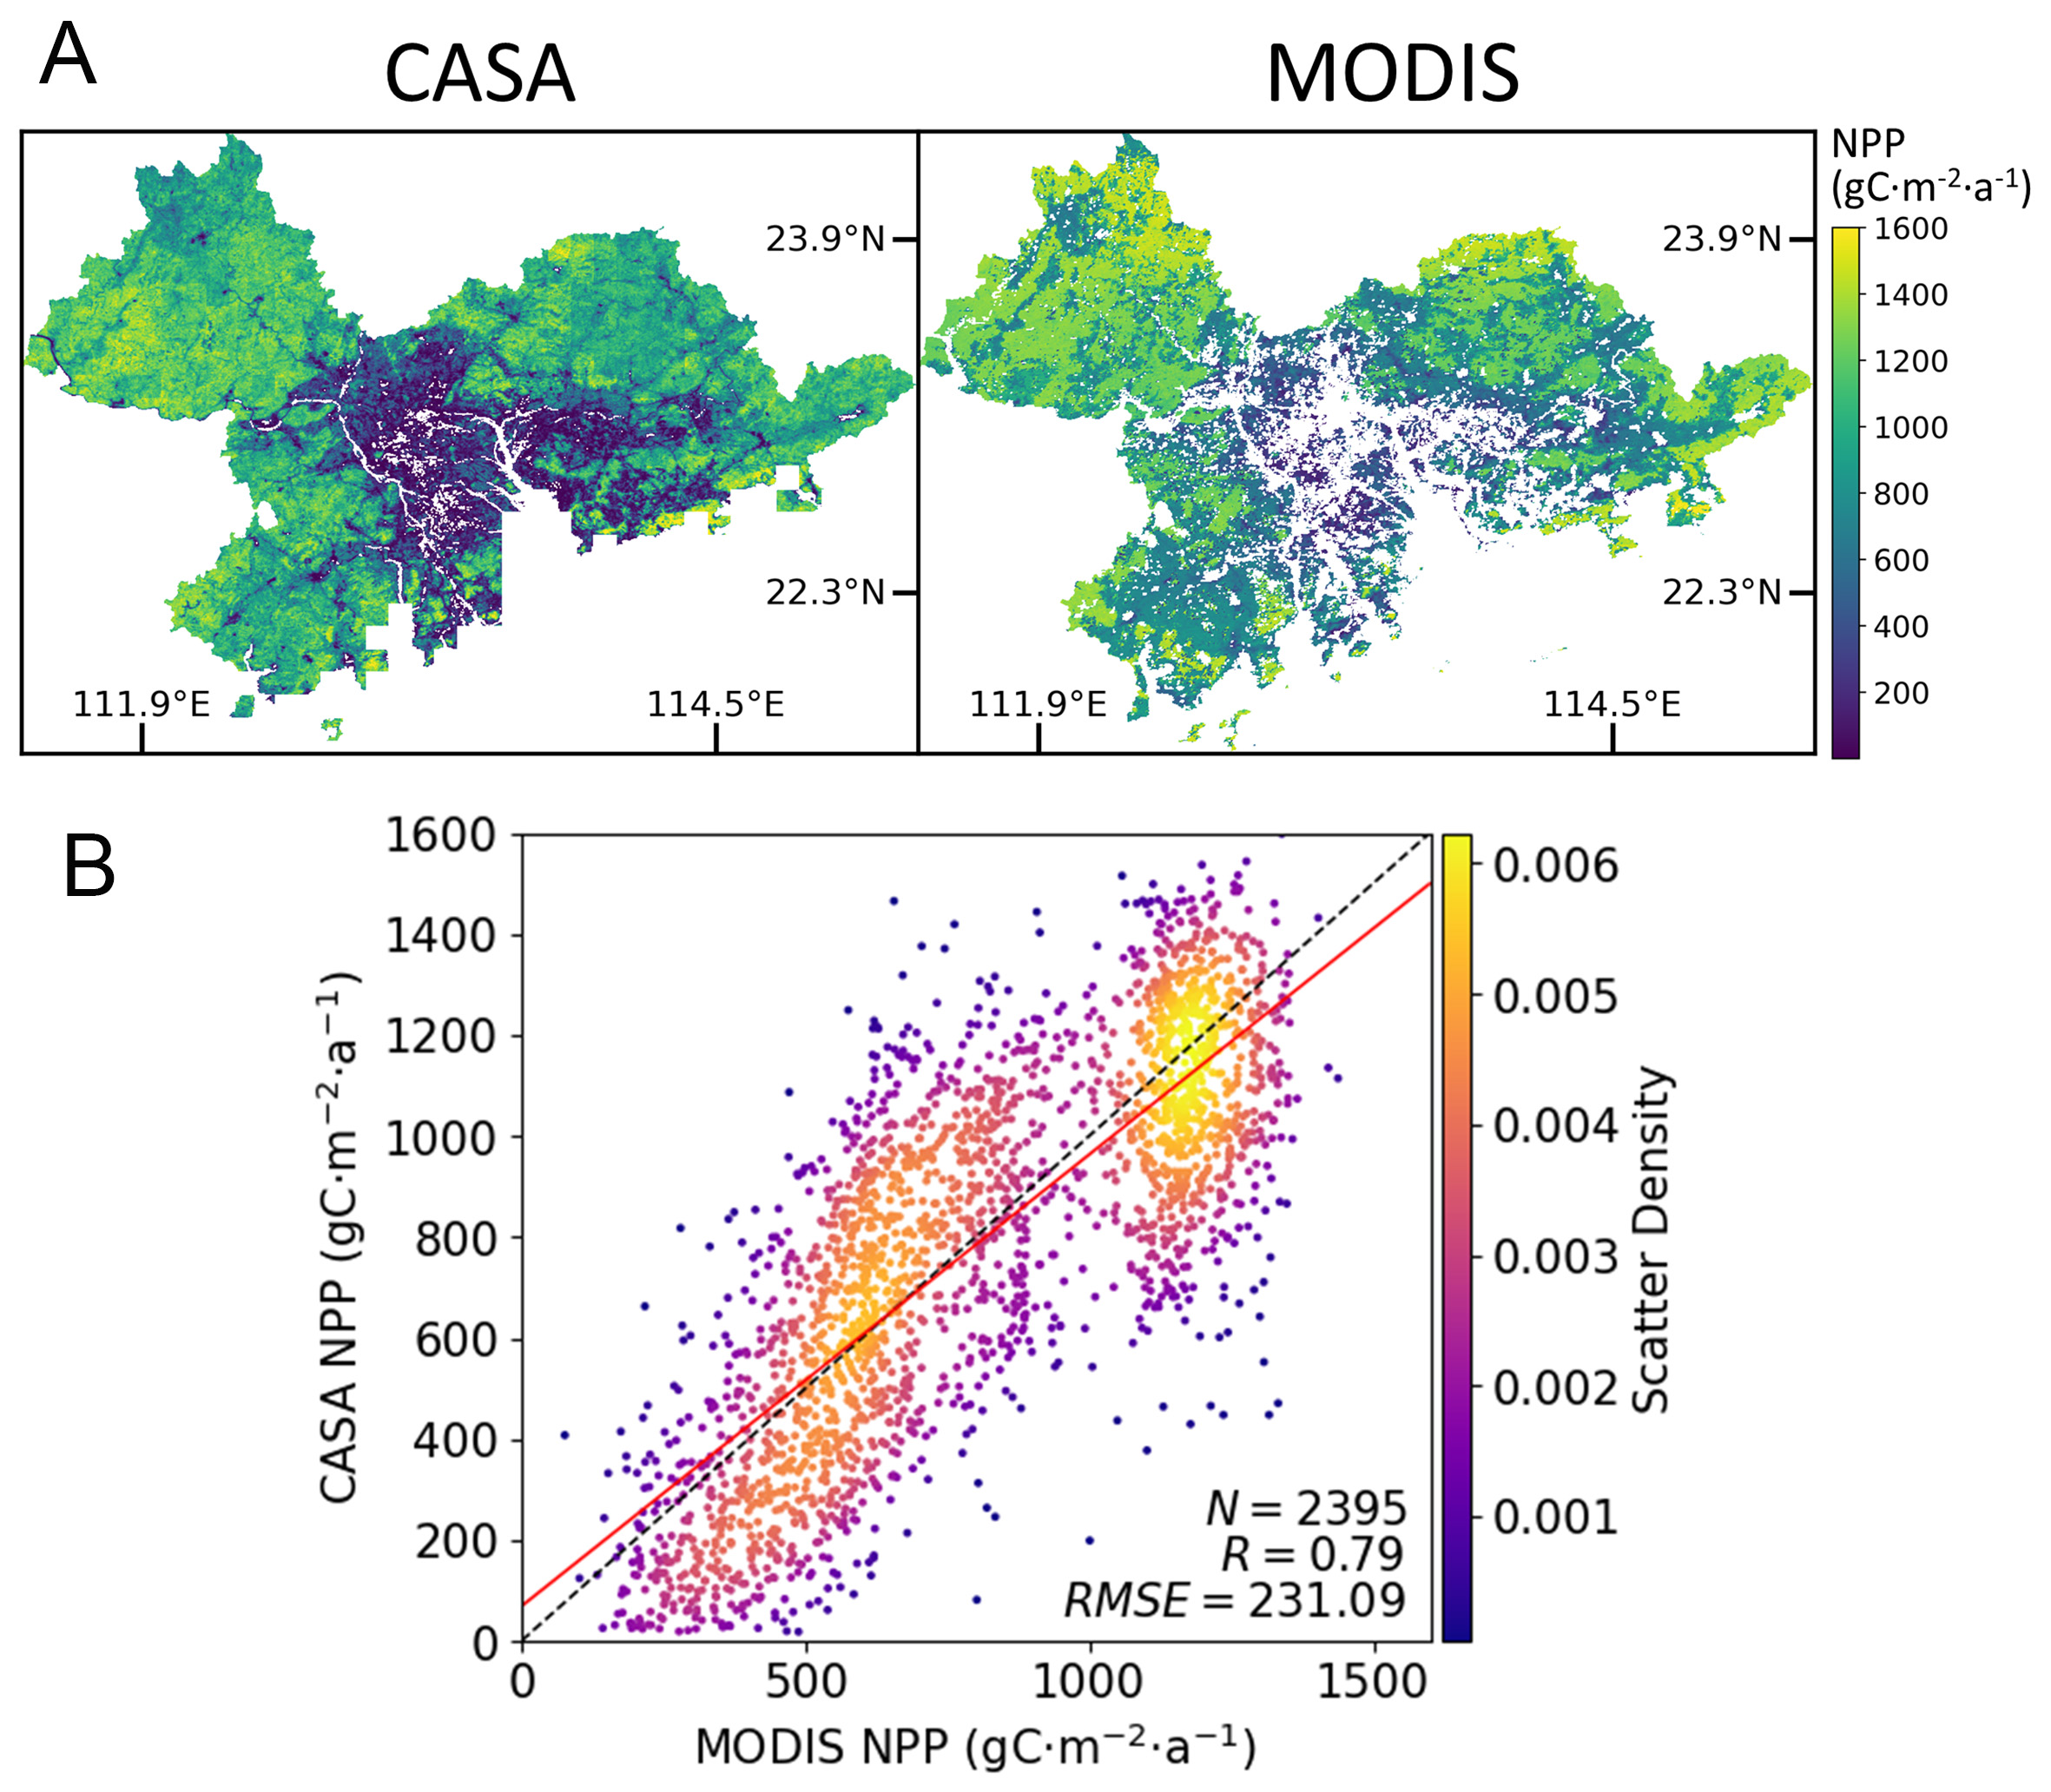
Figure 6. Comparison between CASA and MODIS NPP in PRD: (A) annual NPP distribution map; (B) correlation analysis.
The uncertainties in this study primarily stem from the following key sources: (1) meteorological inputs, where ERA5-Land reanalysis data may not fully capture urban microclimates[36]; (2) remote sensing limitations, including MODIS NDVI cloud contamination and mixed pixel effects in urban-rural transition zones at 250 m resolution[37]; (3) inaccurate classification in the GLC_FCS30-2020 dataset and AIEC dataset, particularly for artificial urban green spaces and rapidly changing land cover; (4) empirical simplifications in soil respiration model, which overlook urban-specific factors such as enhanced decomposition due to the urban heat island effect and anthropogenic organic carbon inputs. These uncertainties are most pronounced in urban core areas but have relatively minor impacts on regional-scale patterns. Additionally, a limitation of this study is that it is based on a 2-year dataset (2021-2022), which does not account for interannual variability in urban carbon metabolism. Future research should therefore extend the temporal coverage and conduct comparative analyses with other regions of similar landscapes, which would help to assess long-term trends and enhance the generalizability of the findings.
Policy implications
The findings of this study provide important insights for urban carbon management policies in rapidly developing regions such as the Pearl River Delta. The significant spatial heterogeneity in carbon sink capacity indicates the need for differentiated land use strategies, with forest conservation in northern mountainous areas taking priority, as they disproportionately contribute 55.1% to the regional NEP, far exceeding other landscape types. Urban planning should incorporate considerations of vegetation productivity and soil respiration effect ratios, particularly in core built-up areas where the RH/NPP ratio exceeds 80%, as these areas are highly likely to transition into net carbon sources. Guangzhou’s green infrastructure policies have proven highly effective[38], maintaining an RH/NPP ratio of 52.8% despite its megacity status. This success offers a replicable model for other PRD cities - particularly net carbon source urban areas such as Dongguan and Zhongshan - to adopt through targeted urban forestry programs and improved soil carbon management. Additional measures including restoration of vegetated patches and integration of permeable surfaces could further enhance carbon sequestration and mitigate respiratory carbon losses.
The research findings also highlight the importance of sector-specific carbon reduction strategies. Agricultural policies can be strengthened to reduce carbon losses from cropland, and current practices may increase potential NEP through improved residue management and reduced tillage. Coastal urban planning, particularly in Zhuhai, requires special adaptation measures to address observed salt-affected soil respiration anomalies and typhoon disturbances. Regional standards could set an 80% RH/NPP threshold as a key benchmark for urban ecosystem health and mandate corrective actions when this threshold is exceeded. Collectively, these measures can enhance the precision of China’s urban dual-carbon policy implementation and support spatially optimized carbon management. Moreover, they supplement existing national carbon neutrality strategies by incorporating an ecological perspective into energy- and emission-centered approaches. The integration of ecological indicators, such as the RH/NPP ratio, into urban planning can refine current roadmaps and improve the effectiveness of localized carbon management efforts.
CONCLUSIONS
This study employs a combined approach of high-resolution remote sensing and ecological modeling to reveal the fine-scale spatiotemporal patterns of carbon metabolism in urban ecosystems within the Pearl River Delta region. The results indicate that the annual NEP of PRD cities exhibits significant spatial heterogeneity (-40 to 638 gC·m-2·a-1), with forest ecosystems contributing 55.1% of the regional net carbon sink while maintaining a high carbon retention efficiency. In Dongguan (-20.1 gC·m-2·a-1) and Zhongshan
The scientific contribution of this study lies in the development of a carbon metabolism assessment method for rapidly urbanizing regions, which has three key policy implications: First, the RH/NPP ratio serves as a critical threshold for urban ecosystem health, providing a quantitative benchmark for urban carbon management standards. Second, it highlights the strategic importance of suburban forest belts (e.g., Zhaoqing accounts for 41.9% of the regional NEP) and emphasizes the need to strengthen their protection through ecological compensation strategies. Third, vertical greening should be prioritized as a core measure to increase carbon sinks in high-density cities (e.g., Shenzhen). Future research should integrate urban canopy models to analyze three-dimensional carbon flux differentiation and establish predictive models under dynamic land-use change scenarios. The established framework can be extended to global subtropical urban clusters, providing scientific support for regional climate actions mandated by the Paris Agreement[39].
DECLARATIONS
Acknowledgments
The authors acknowledge support from the National Key R&D Program of China (2023YFE0113000).
Authors’ contributions
Conceptualization, methodology, software, visualization, writing-original draft: Wang, L.
Conceptualization, supervision, writing-review and editing: Liu, Z.
Availability of data and materials
Data and materials are available from the corresponding author upon reasonable request.
Financial support and sponsorship
This work was financially supported by the National Key R&D Program of China (2023YFE0113000).
Conflicts of interest
Liu, Z. is the Associate Editor of the Carbon Footprints journal. He had no involvement in the review or editorial process of this manuscript, including but not limited to reviewer selection, evaluation, or the final decision, while the other authors have declared that they have no conflicts of interest.
Ethical approval and consent to participate
Not applicable.
Consent for publication
Not applicable.
Copyright
© The Author(s) 2025.
Supplementary Materials
REFERENCES
1. Zhao, D.; Cai, J.; Xu, Y.; Liu, Y.; Yao, M. Carbon sinks in urban public green spaces under carbon neutrality: a bibliometric analysis and systematic literature review. Urban. For. Urban. Gree. 2023, 86, 128037.
2. Zhao, X.; Ma, X.; Chen, B.; Shang, Y.; Song, M. Challenges toward carbon neutrality in China: strategies and countermeasures. Resour. Conserv. Recy. 2022, 176, 105959.
3. Nieto, M. J. Whatever it takes to reach net zero emissions around 2050 and limit global warming to 1.5c: the cases of United States, China, European Union and Japan. BAFFI CAREFIN Centre Research Paper No. 2022-170; 2022.
4. Hou, M. Z.; Luo, J.; Huang, L.; et al. Strategies toward carbon neutrality: comparative analysis of China, USA, and Germany. Carbon. Neutral. Syst. 2025, 1, 3.
5. Running, S.; Zhao, M. MOD17A3HGF MODIS/terra net primary production gap-filled yearly L4 global 500 m SIN Grid V006. NASA Land Processes Distributed Active Archive Center; 2019.
6. Chen, J.; Gao, M.; Cheng, S.; et al. County-level CO2 emissions and sequestration in China during 1997-2017. Sci. Data. 2020, 7, 391.
7. Lorenz, K.; Lal, R. The importance of carbon sequestration in forest ecosystems. In: Carbon Sequestration in Forest Ecosystems. Dordrecht: Springer; 2010.
8. Roxburgh, S. H.; Berry, S. L.; Buckley, T. N.; Barnes, B.; Roderick, M. L. What is NPP? Inconsistent accounting of respiratory fluxes in the definition of net primary production. Funct. Ecol. 2005, 19, 378-82.
9. Uchijima, Z.; Seino, H. Agroclimatic evaluation of net primary productivity of natural vegetations: (1) Chikugo model for evaluating net primary productivity. J. Agric. Meteorol. 1985, 40, 343-52.
10. Landsberg, J.; Waring, R. A generalised model of forest productivity using simplified concepts of radiation-use efficiency, carbon balance and partitioning. Forest. Ecol. Manag. 1997, 95, 209-28.
11. Potter, C. S.; Randerson, J. T.; Field, C. B.; et al. Terrestrial ecosystem production: a process model based on global satellite and surface data. Global. Biogeochem. Cycles. 1993, 7, 811-41.
12. Schaefer, K.; Collatz, G. J.; Tans, P.; et al. Combined simple biosphere/carnegie-ames-stanford approach terrestrial carbon cycle model. J. Geophys. Res. 2008, 113, 2007JG000603.
13. Huang, C.; Sun, C.; Nguyen, M.; et al. Spatio-temporal dynamics of terrestrial net ecosystem productivity in the ASEAN from 2001 to 2020 based on remote sensing and improved CASA model. Ecol. Ind. 2023, 154, 110920.
14. Ling, S.; Gao, Z.; Ma, C.; You, H. Estimation of net primary productivity of vegetation and vegetation carbon sink in Tianjin area based on CASA model. Tianjin. Agric. Sci. 2022, 28, 69-75+81.
15. Xu, F.; Wang, X.; Li, L. NPP and vegetation carbon sink capacity estimation of urban green space using the optimized CASA model: a case study of five Chinese cities. Atmosphere 2023, 14, 1161.
16. Liu, W.; Li, X.; Li, T.; Jia, B. Spatiotemporal variations of forest NPP and related driving factors based on MODIS and CASA models in Yichun. Shengtaixue. Zazhi. 2022, 41, 150-8.
17. Potter, C.; Pass, S. Changes in the net primary production of ecosystems across Western Europe from 2015 to 2022 in response to historic drought events. Carbon. Bal. Manag. 2024, 19, 32.
18. Piao, S.; He, Y.; Wang, X.; Chen, F. Estimation of China’s terrestrial ecosystem carbon sink: methods, progress and prospects. Sci. China. Earth. Sci. 2022, 65, 641-51.
19. Pei, Z.; Zhou, C.; Ouyang, H.; Yang, W. A carbon budget of alpine steppe area in the Tibetan Plateau. Geograp. Res. 2010, 29, 102-10.
20. Liang, L.; Wang, Q.; Qiu, S.; Geng, D.; Wang, S. NEP estimation of terrestrial ecosystems in China using an improved CASA model and soil respiration model. IEEE. J. Sel. Top. Appl. Earth. Observ. Remote. Sens. 2023, 16, 10203-15.
21. Shen, S.; Wu, C.; Gai, Z.; Fan, C. Analysis of the spatiotemporal evolution of the net carbon sink efficiency and its influencing factors at the city level in three major urban agglomerations in China. Int. J. Environ. Res. Public. Health. 2023, 20, 1166.
22. Muñoz-Sabater, J.; Dutra, E.; Agustí-Panareda, A.; et al. ERA5-land: a state-of-the-art global reanalysis dataset for land applications. Earth. Syst. Sci. Data. 2021, 13, 4349-83.
24. Zhang, X.; Liu, L.; Chen, X.; Gao, Y.; Xie, S.; Mi, J. GLC_FCS30: global land-cover product with fine classification system at 30 m using time-series Landsat imagery. Earth. Syst. Sci. Data. 2021, 13, 2753-76.
25. Liu, S.; Wang, H.; Hu, Y.; et al. Land use and land cover mapping in China using multimodal fine-grained dual network. IEEE. Trans. Geosci. Remote. Sens. 2023, 61, 1-19.
26. Piao, S.; Fang, J.; Guo, Q. Application of CASA model to the estimation of Chinese terrestrial net primary productivity. Chin. J. Plan. Ecol. 2001, 025, 603-8. Available from: https://www.plant-ecology.com/EN/Y2001/V25/I5/603 [Last accessed on 10 Oct 2025].
27. Zhu, W.; Pan, Y.; Zhang, J. Estimation of net primary productivity of Chinese terrestrial vegetation based on remote sensing. Chinese. J. Plant. Ecol. 2007, 31, 413-24.
28. Pan, J.; Wen, Y. Estimation and spatial-temporal characteristics of the carbon sink in the arid region of northwest China. Acta. Ecol. Sin. 2015, 35, stxb201405211045.
29. Wang, H.; Xu, X.; Wang, Z.; et al. Abnormal litter induced by typhoon disturbances had higher rates of mass loss and carbon release than physiological litter in coastal subtropical urban forest ecosystems. Forests 2022, 13, 1819.
30. Huang, C.; Liu, H.; Chung, C. Contribution of environmental factors to post-typhoon litterfall stability in subtropical montane cloud forests of the Asia-Pacific region. Forest. Ecol. Manag. 2024, 558, 121757.
31. Medl, A.; Stangl, R.; Florineth, F. Vertical greening systems - A review on recent technologies and research advancement. Build. Environ. 2017, 125, 227-39.
32. Randerson, J. T.; Iii, F. S. C.; Harden, J. W.; Neff, J. C.; Harmon, M. E. Net ecosystem production: a comprehensive measure of net carbon accumulation by ecosystems. Ecol. Appl. 2002, 12, 937.
33. Luo, M.; Huang, J.; Zhu, W.; Tong, C. Impacts of increasing salinity and inundation on rates and pathways of organic carbon mineralization in tidal wetlands: a review. Hydrobiologia 2019, 827, 31-49.
34. Lao, Q.; Chen, F.; Jin, G.; et al. Characteristics and mechanisms of typhoon-induced decomposition of organic matter and its implication for climate change. JGR. Biogeosci. 2023, 128, e2023JG007518.
35. Wang, C.; Sardans, J.; Tong, C.; Peñuelas, J.; Wang, W. Typhoon-induced increases in porewater nutrient concentrations and CO2 and CH4 emissions associated with salinity and carbon intrusion in a subtropical tidal wetland in China: a mesocosm study. Geoderma 2021, 384, 114800.
36. Yilmaz, M. Accuracy assessment of temperature trends from ERA5 and ERA5-Land. Sci. Total. Environ. 2023, 856, 159182.
37. Miura, T.; Huete, A.; Yoshioka, H. Evaluation of sensor calibration uncertainties on vegetation indices for MODIS. IEEE. Trans. Geosci. Remote. Sens. 2000, 38, 1399-409.
38. Wang, Y.; Ni, Z.; Hu, M.; Chen, S.; Xia, B. A practical approach of urban green infrastructure planning to mitigate urban overheating: a case study of Guangzhou. J. Clean. Prod. 2021, 287, 124995.
39. Paris Agreement. 2015. Available from: https://heinonline.org/HOL/LandingPage?handle=hein.journals/intlm55&div=46&id=&page= [Last accessed on 10 Oct 2025].
Cite This Article
How to Cite
Download Citation
Export Citation File:
Type of Import
Tips on Downloading Citation
Citation Manager File Format
Type of Import
Direct Import: When the Direct Import option is selected (the default state), a dialogue box will give you the option to Save or Open the downloaded citation data. Choosing Open will either launch your citation manager or give you a choice of applications with which to use the metadata. The Save option saves the file locally for later use.
Indirect Import: When the Indirect Import option is selected, the metadata is displayed and may be copied and pasted as needed.
About This Article
Copyright

Data & Comments
Data
0


Comments
Comments must be written in English. Spam, offensive content, impersonation, and private information will not be permitted. If any comment is reported and identified as inappropriate content by OAE staff, the comment will be removed without notice. If you have any queries or need any help, please contact us at [email protected].