


fig3
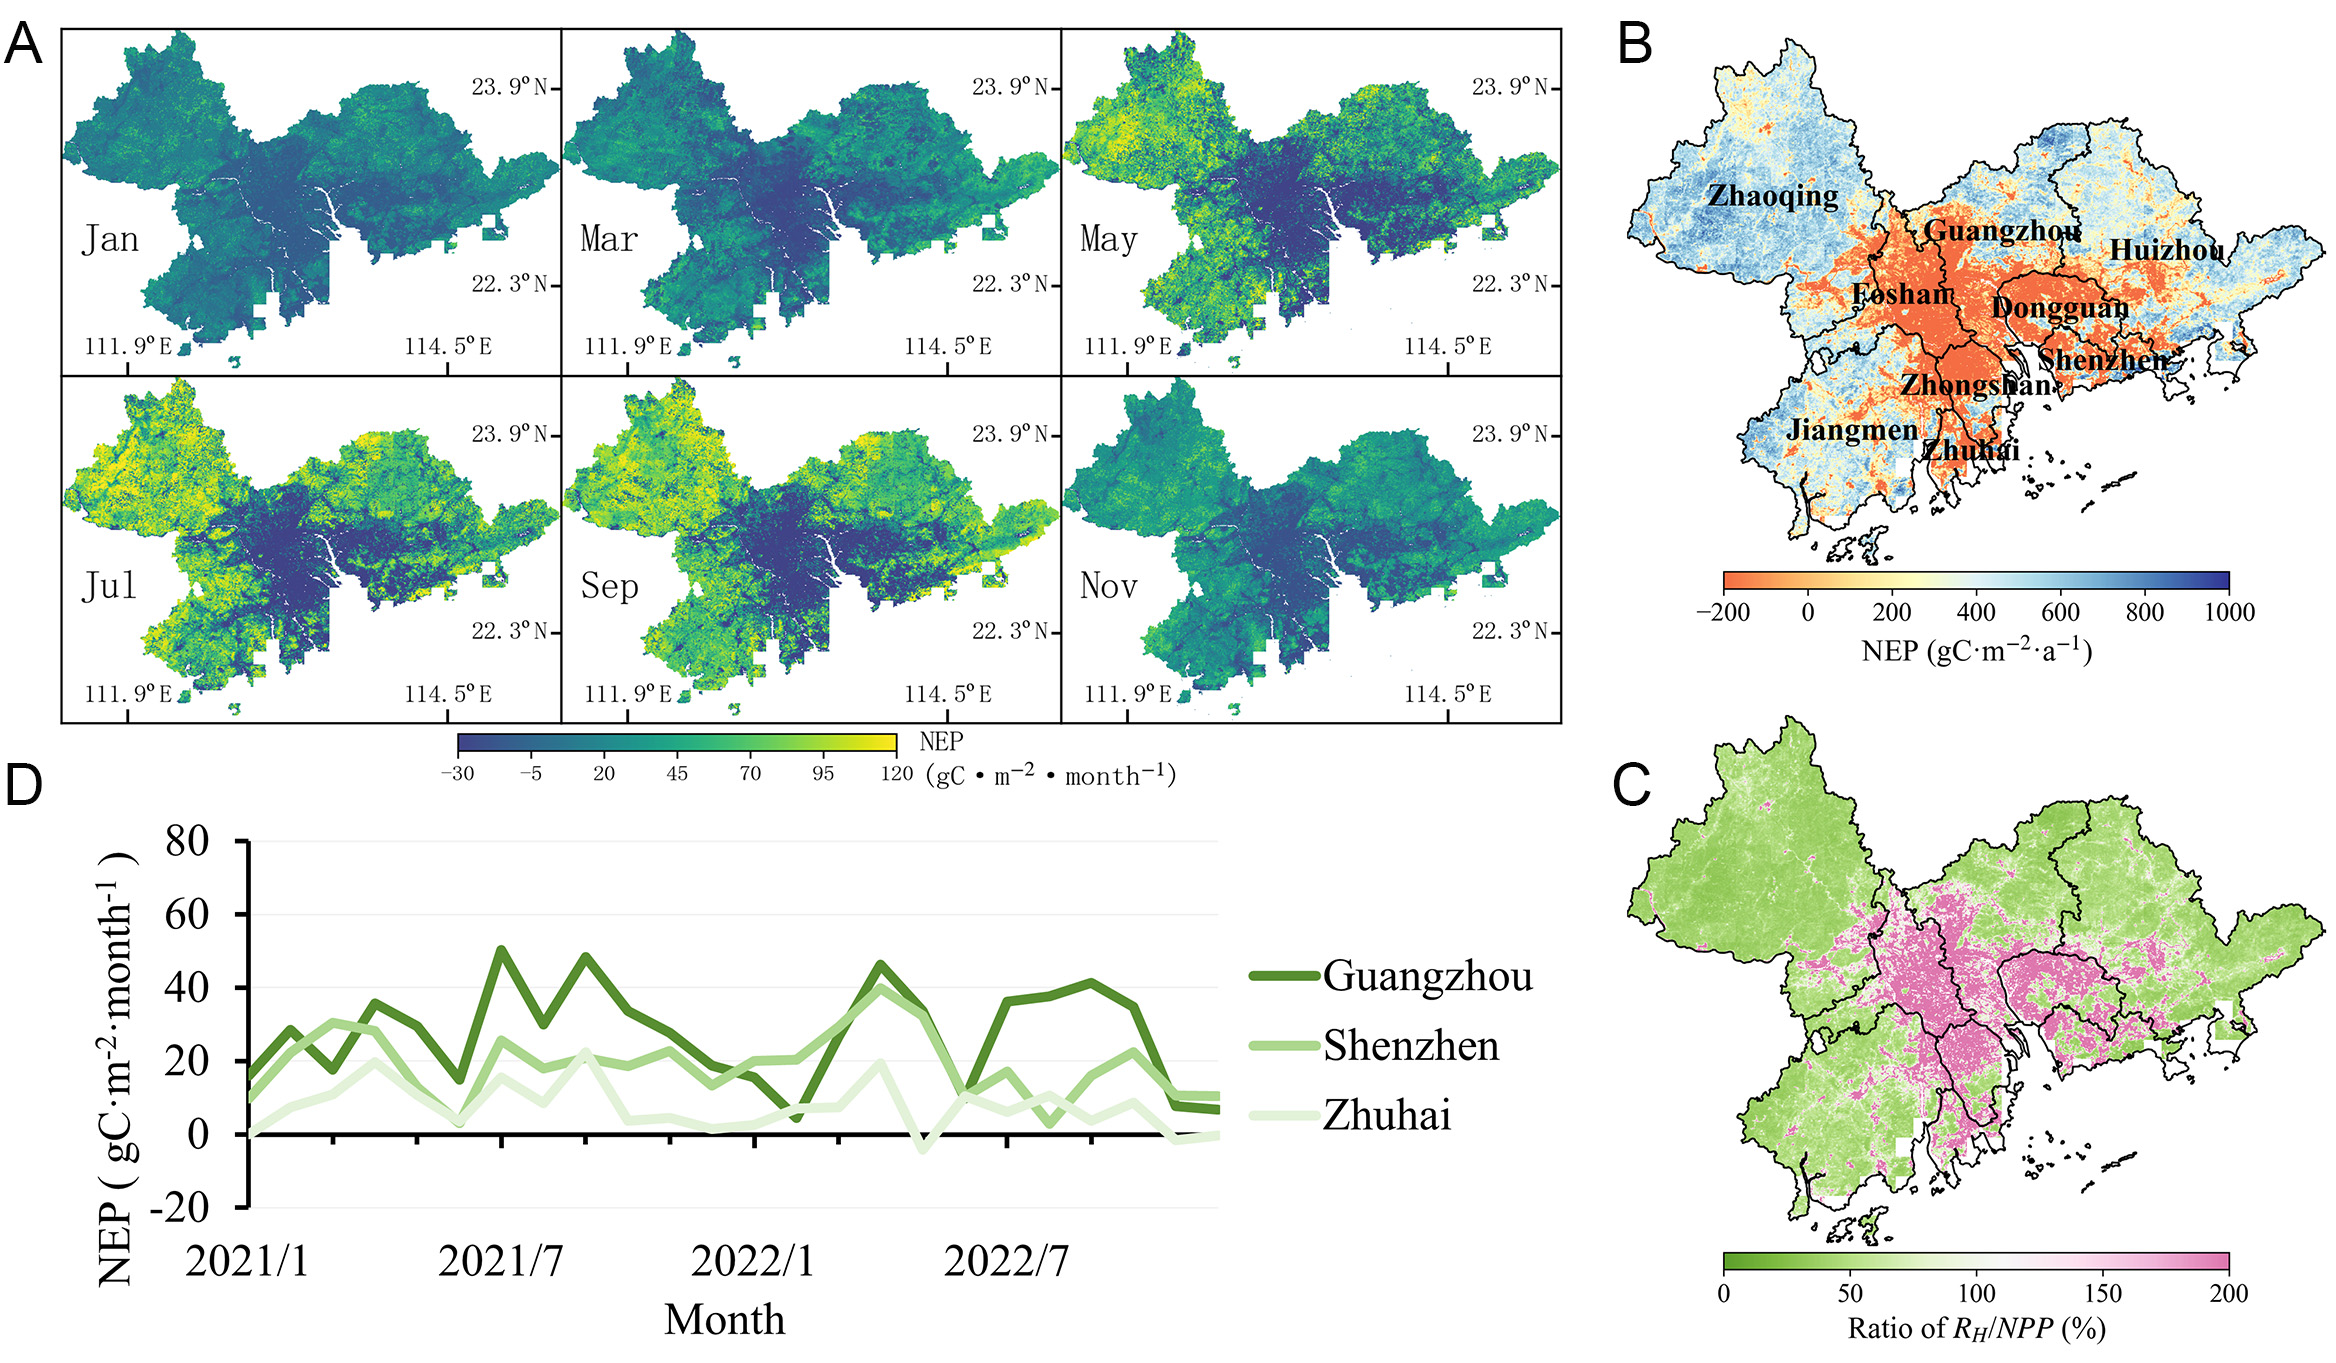
Figure 3. Monthly (A) and annual (B) NEP distribution in PRD in 2021. (C) Ratio of RH/NPP in PRD in 2021. (D) Monthly NEP changes of Guangzhou, Shenzhen, and Zhuhai during 2021-2022.
Figure 3. Monthly (A) and annual (B) NEP distribution in PRD in 2021. (C) Ratio of RH/NPP in PRD in 2021. (D) Monthly NEP changes of Guangzhou, Shenzhen, and Zhuhai during 2021-2022.


All published articles are preserved here permanently
https://www.portico.org/publishers/oae/


