


fig4
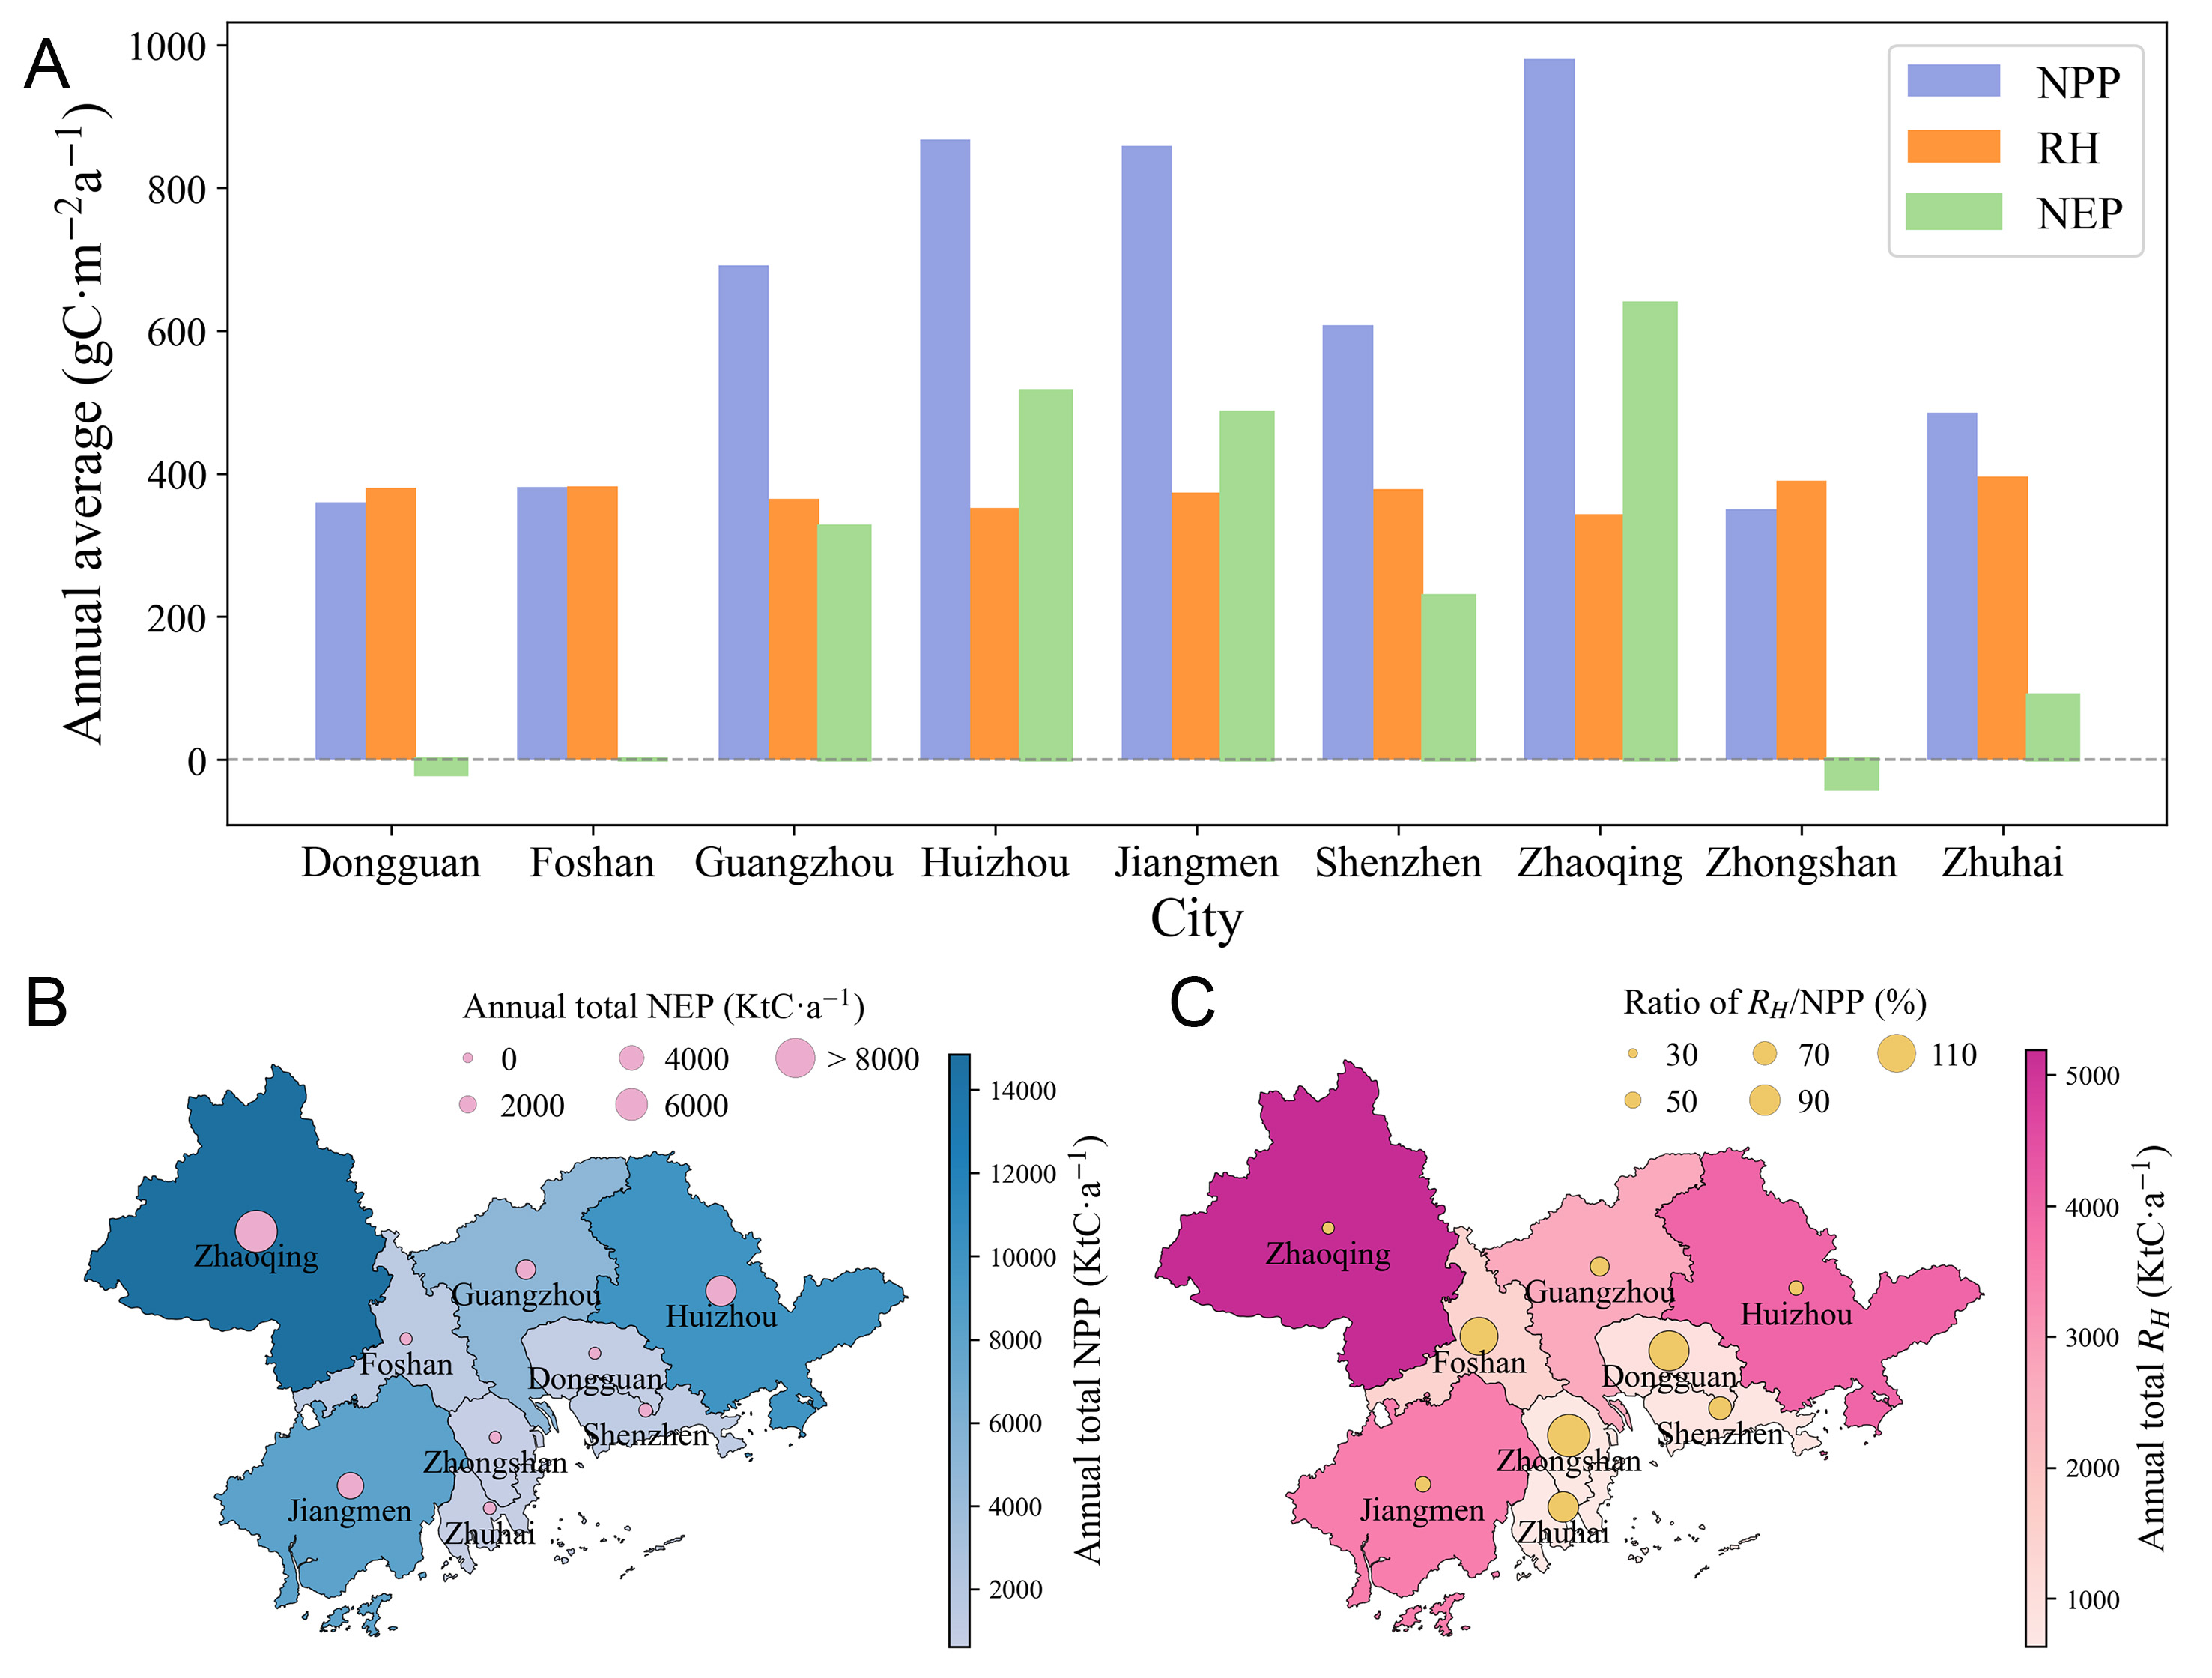
Figure 4. (A) Annual mean NPP, RH and NEP of PRD cities. (B) Annual total NPP and NEP distribution of PRD cities. (C) Annual total RH and ratio of RH /NPP distribution. The complete data are shown in Supplementary Table 1.
Figure 4. (A) Annual mean NPP, RH and NEP of PRD cities. (B) Annual total NPP and NEP distribution of PRD cities. (C) Annual total RH and ratio of RH /NPP distribution. The complete data are shown in Supplementary Table 1.


All published articles are preserved here permanently
https://www.portico.org/publishers/oae/


