


fig6
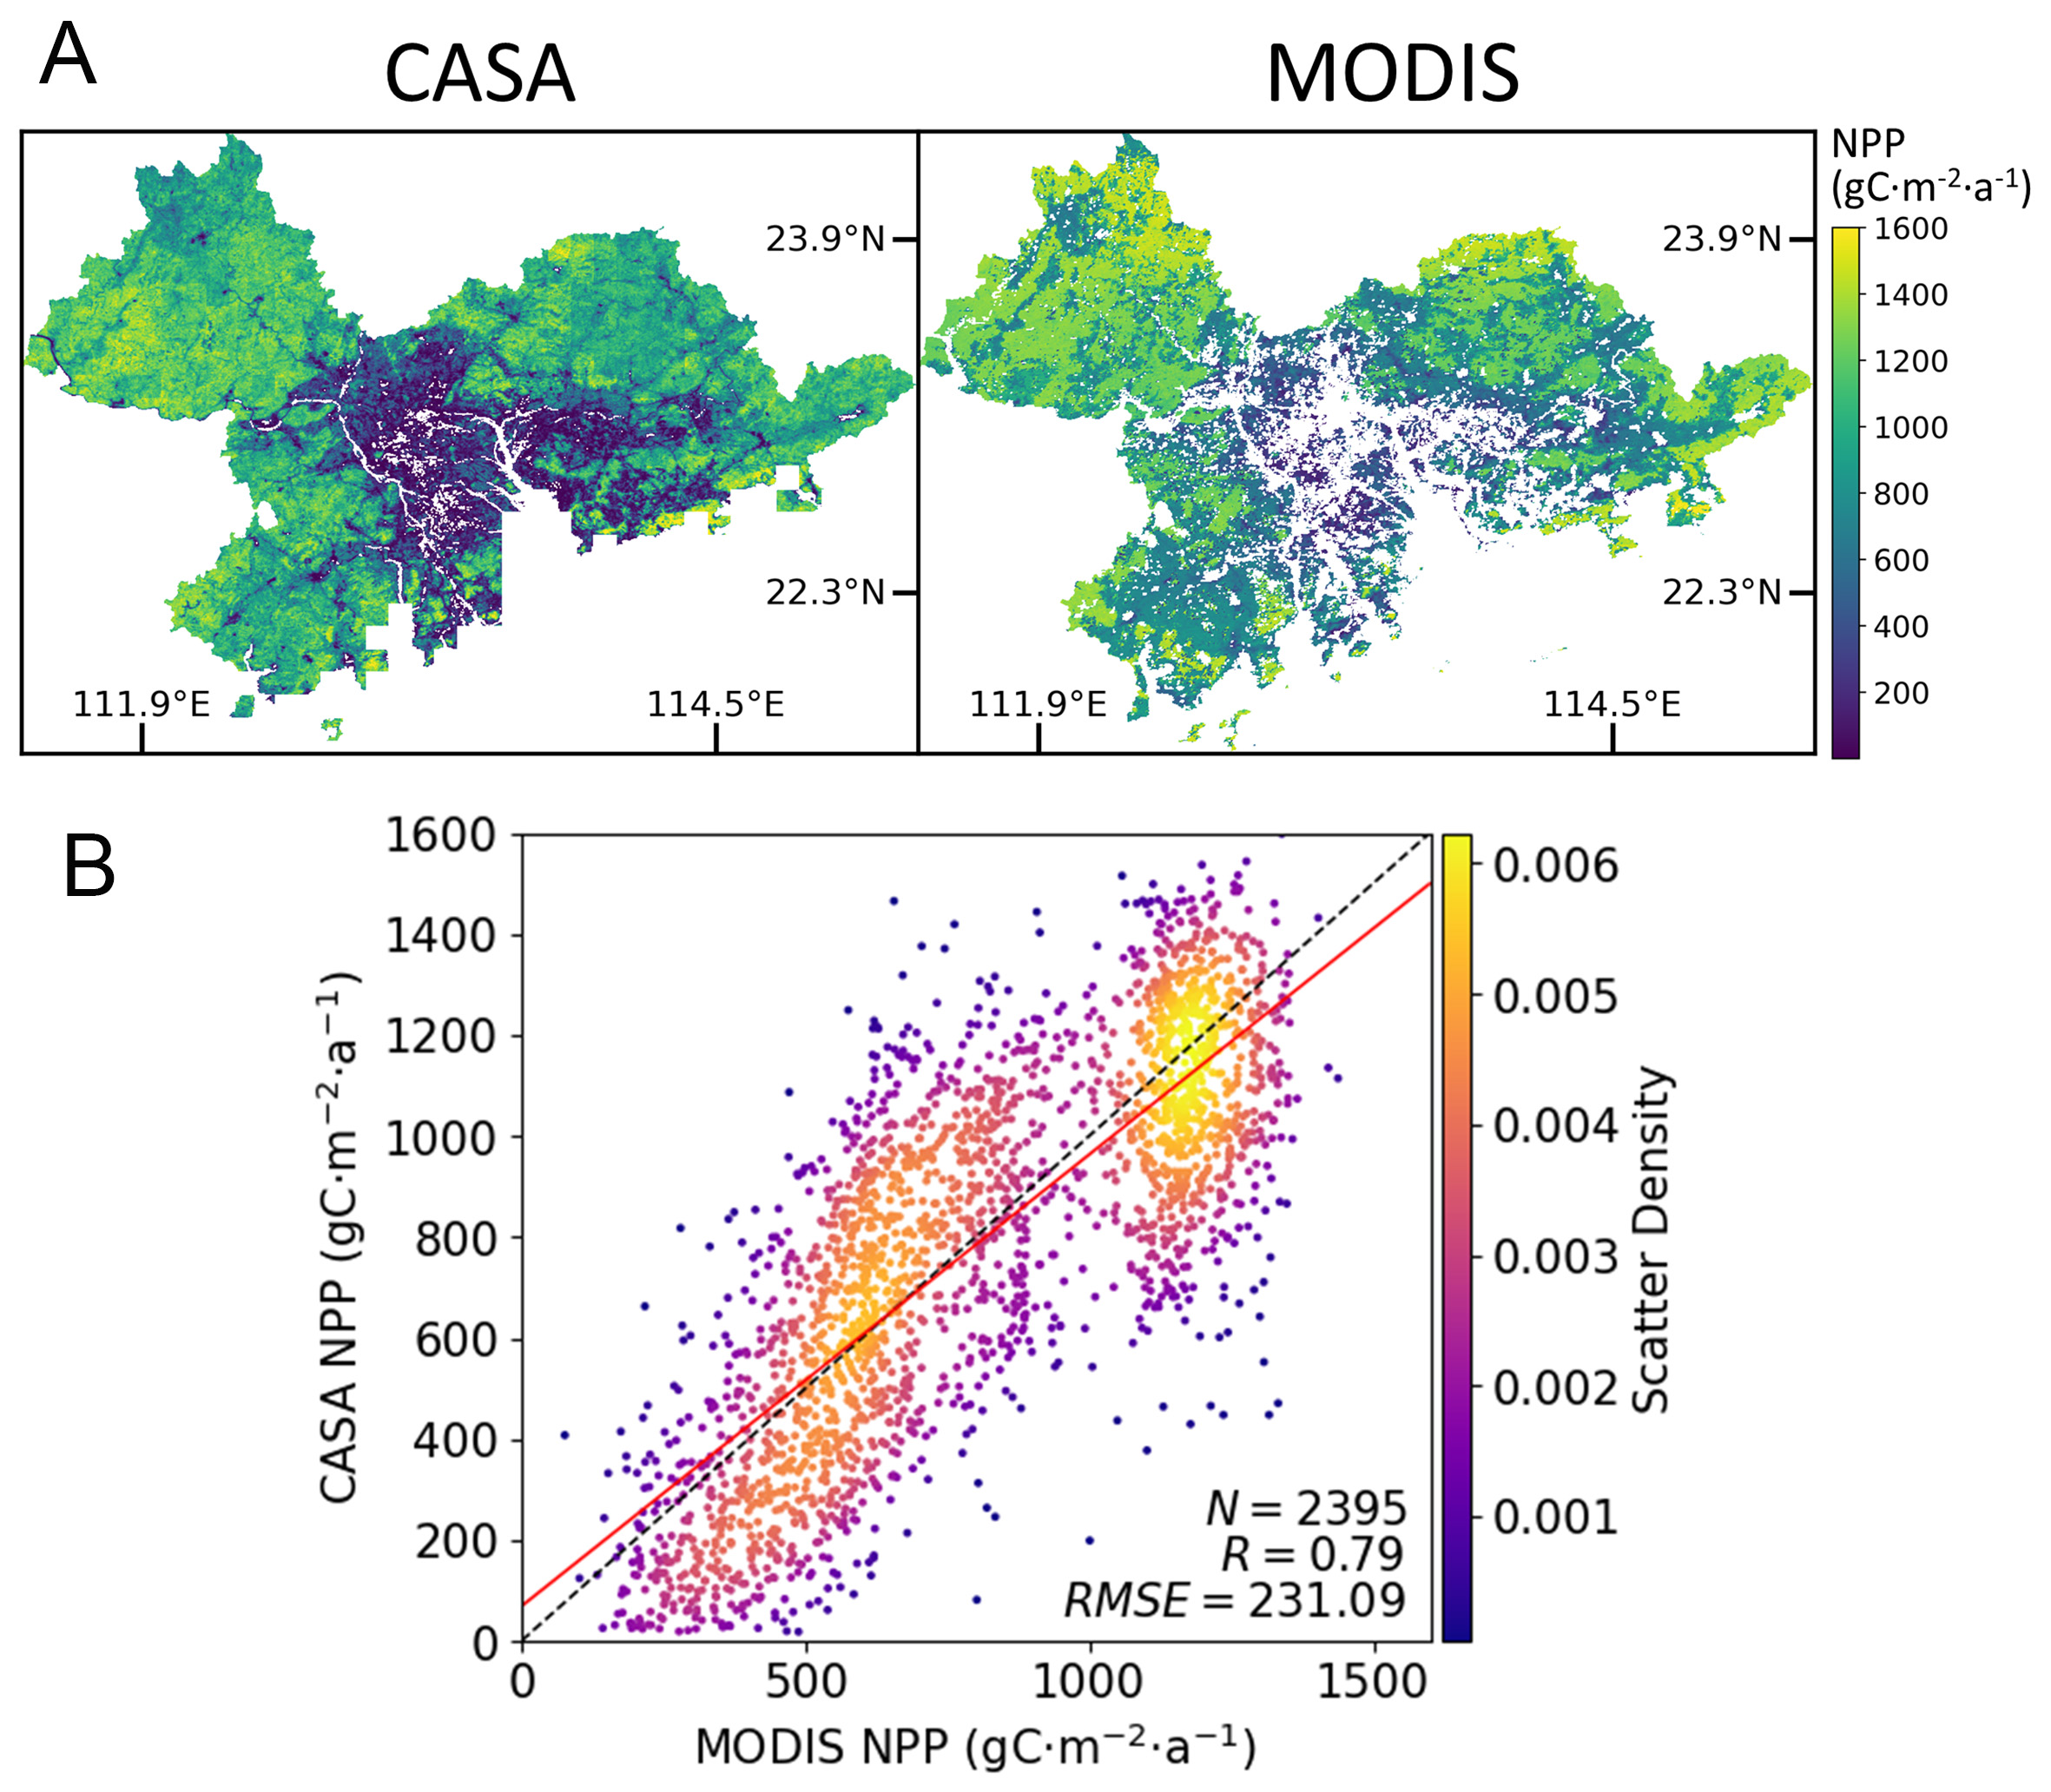
Figure 6. Comparison between CASA and MODIS NPP in PRD: (A) annual NPP distribution map; (B) correlation analysis.
Figure 6. Comparison between CASA and MODIS NPP in PRD: (A) annual NPP distribution map; (B) correlation analysis.


All published articles are preserved here permanently
https://www.portico.org/publishers/oae/


