

Strengthening the role and exploring the effectiveness of new climate finance target
 0
0 Abstract
To address global climate change, developed countries have committed at the 29th session of the Conference of the Parties (COP29) to provide $300 billion annually in climate finance by 2035 to support mitigation and adaptation actions in developing countries. However, the effectiveness of this target remains unclear. This paper, based on the Policy Analysis of Greenhouse Effect - Ice, Climate, and Economics (PAGE-ICE) model, introduces a climate finance module to evaluate the implementation of new climate finance targets under different collection and dispensation principles. It further explores the impact of regional governance capacity and the classification of donor and recipient countries on global climate and economic outcomes. The results show that if climate finance lasts until 2035, the global temperature rise will decrease by 0.13 °C to 0.14 °C in 2050. Extending the financing period to 2050 will further reduce the temperature rise by approximately 0.02 °C and increase the economic benefits of each country as a percentage of GDP by 0.09% to 1.25%. Regarding the dispensation principles, the Carbon Intensity-Adaptation Need (CIAN) principle results in the greatest emission reductions, while the Carbon Reduction Contribution-Adaptation Need (CRCAN) principle facilitates a more equitable distribution of economic benefits among recipient countries. In terms of collection principles, the Responsibility-Capacity Integrated (RCI) principle is a more acceptable burden-sharing option for donor countries compared to other existing principles. Furthermore, weaker governance capacity reduces the effectiveness of climate finance. While shifting China from a recipient to a donor may alleviate pressure on traditional donor countries, it could weaken the overall mitigation effectiveness.

Keywords
INTRODUCTION
Human activities have led to a continuous increase in greenhouse gas (GHG) emissions, resulting in catastrophic consequences for human society and natural ecosystems[1]. Many developing countries have already experienced the adverse impacts of climate change, especially Small Island Developing States (SIDS), which are threatened by rising sea levels[2]. Given the historical differences in emission responsibilities and development needs, the United Nations Framework Convention on Climate Change (UNFCCC) emphasizes that developed countries must “urgently enhance financial support” to assist developing countries in addressing climate change[3]. As a result, climate finance has become one of the highest priorities in international climate negotiations, as it is the primary mechanism for supporting developing countries to combat climate change[4]. However, despite the establishment of the “annual $100 billion” climate finance target at the Copenhagen and Cancun conferences, a significant financing gap remains, especially in vulnerable regions such as Africa, where the amount of adaptation finance is still far below demand[5,6]. The latest New Collective Quantified Goal (NCQG) proposed at the 29th session of the Conference of the Parties (COP29) to the UNFCCC raises the financing target to $300 billion per year, with plans to continue until 2035, marking a new phase in global climate finance[7].
Previous studies have shown that climate finance plays a positive role in driving emission reductions and promoting green economic development. A group of studies based on econometric models assessed the effectiveness of climate finance in advancing mitigation actions and reducing climate vulnerability in recipient countries[8-11]. Lee et al.[12] indicated that the effect of climate finance is more significant in SIDS and countries that have higher levels of economic development, with the impact of mitigation finance being greater than that of adaptation finance. However, due to the reliance on historical data, such studies were limited in revealing the long-term impact of climate finance on mitigation pathways and structural transformations. Another group of studies used computable general equilibrium (CGE) models or integrated assessment models (IAMs) to evaluate the long-term mitigation effects and macroeconomic impacts of climate finance. Wu et al.[13] extended the RICE model, treating climate finance as the cost needed for recipient countries to achieve additional emission reductions, and simulated the climate and economic effects under different burden-sharing principles. Gu et al.[14] used the CIECIA-TD-F model to examine the effectiveness of climate finance for low-carbon technology financing, and proposed a Pareto improvement scheme that combines climate finance with technology sharing, national research and development improvements. Regarding the effectiveness of climate finance, Antimiani et al.[15] noted that while the costs associated with implementing climate finance for developed countries are high, most developing countries will face even higher costs if no action is taken. However, these studies generally viewed climate finance as support for mitigation actions, leaving several critical areas underexplored - such as a systematic analysis of adaptation finance, the decline in financing efficiency due to regional disparities in governance capacity, and the implications of adjustments in the classification of donor and recipient countries on global climate cooperation, which urgently require more in-depth quantitative research.
To fill the gaps in existing literature, this study, based on the Policy Analysis of Greenhouse Effect - Ice, Climate and Economics (PAGE-ICE) model, analyzes the implementation of new climate finance targets by introducing the climate finance module. The main innovations of this study are as follows: First, it simultaneously considers the mitigation and adaptation uses of climate finance to assess its comprehensive impact on promoting emission reductions and reducing climate damages. Second, it incorporates the difference in regional governance capacity based on the Corruption Perceptions Index (CPI) and quantifies the impact of governance deficiencies on the efficiency of climate finance. Third, it adjusts the classification of donor and recipient countries, simulating the impact of shifting China from a recipient to a donor country, and identifies its key role in global mitigation pathways and responsibility structure.
The rest of the paper is structured as follows: Section 2 introduces the method for incorporating the climate finance module and the principles of collection and dispensation. Section 3 analyzes the climate and economic effects under different scenarios. Section 4 discusses the results of this study. Section 5 concludes with a summary of the findings and policy recommendations.
METHOD
PAGE-ICE model
PAGE-ICE simulates climate and economic development across eight aggregated regions from 2020 to 2300, improving upon the PAGE09 model to enhance climate processes and economic loss estimations[16,17]. It simulates temperature responses and GHG cycles, including feedbacks from six types of emissions: CO2, CH4, N2O, linear gases, sulphates, and a residual group for other GHG emissions. The global temperature change, after regional scaling, is used to assess the economic impact across eight regions. The economic losses induced by temperature rise are calibrated based on historical data, reflecting the heterogeneous responses of different regions to global warming[18].
This study selects PAGE-ICE as the analytical tool, primarily due to its advantages in representing climate damages and scenario simulations. PAGE-ICE incorporates a detailed Arctic feedback model and redefines the discontinuous impacts of climate change, allowing for a more accurate representation of economic losses across regions under climate finance. Additionally, this model adopts a modular structure, making it suitable for simulating complex climate finance scenarios, including various collection and dispensation principles, regional disparities in governance capacity, and adjustments in the classification of donor and recipient countries.
Climate finance module
In this study, climate finance refers to the flow of capital allocated for low-carbon and climate-resilient development, aiming to achieve the net-zero carbon target of the Paris Agreement and promote environmental sustainability[5,19]. Based on this, in the climate finance module, the finance of donor countries is pooled and invested in recipient countries to support their mitigation and adaptation
The climate finance in donor and recipient countries can be expressed as follows:
where i and j are the donor and recipient countries, respectively. CFGlobt is the amount of total climate finance for year t. CFRegi,t and CFRegj,t are the amount of climate finance for the donor and recipient countries in year t, respectively. αi,t and βj,t are the collection and dispensation rate for year t. Climate finance is deducted from the GDP of the donor country and is used to support the mitigation and adaptation actions of the recipient country:
PAGE-ICE includes six types of GHGs and the finance for mitigation actions is allocated to each gas according to the following equation:
where CFRegmit is the amount of climate finance for mitigation actions; γi,g is the proportion of climate finance for mitigation actions to each gas. The value of γi,g is provided in Supplementary Table 2.
The emission reductions for each GHG are based on calibrated Marginal Abatement Cost (MAC) curves. The introduction of the MAC curves can be expressed as follows:
where Q0j,g,t is the emission reductions achieved through negative-cost measures in recipient country j for gas g in year t; Qj,g,t is the total emission reductions in recipient country j for gas g in year t; aloj,g,t, bloj,g,t,
By performing a definite integral calculation on Equation (4), the additional emission reductions attributable to climate finance can be expressed as follows:
Where
where ERWj,g,t is the emission growth rate relative to the baseline year in recipient country j for gas g in year t; Ej,g,0 is the emission in recipient country j for gas g in baseline year; and ZCj,g,t is the zero-cost emission in recipient country j for gas g in year t, expressed relative to the emission growth rate from the baseline year.
Adaptation actions can be categorized into preventive and reactive measures based on the time dimension of action and the relative expected benefits. Preventive measures must be implemented before climate damage occurs, while reactive measures address the restoration costs of damage that has already occurred. In this study, we focus only on reactive adaptation in the form of climate finance expenditures required to compensate for damages:
Where
Collection and dispensation principles
Collection principles
The collection principles for climate finance refer to the rational allocation of the burden-sharing among donor countries[20]. This study considers the following three principles for the collection of climate finance:
The Historical Emission Responsibility (HER) principle suggests that regions with higher historical emissions should bear a larger share of climate finance[21]. Under this principle, the collection rate
where
The Ability to Pay (AP) principle suggests that wealthier regions should bear a larger share of climate finance[23]. Referring to Dellink et al.[24], GDP is used as an indicator of the economic capacity across regions. Under this principle, the collection rate
where GDPi,t is the GDP of donor country i in year t.
The Responsibility-Capability Integrated (RCI) principle suggests that regions with higher historical emissions and economic development levels should bear a larger share of climate finance[25]. Under this principle, the collection rate
where RCIi,t is the responsibility-capability index of donor country i in year t; Ci,t and Ri,t are the normalized responsibility and capability levels of donor country i in year t, respectively; and a and b are the corresponding shares, with a = b = 0.5.
Dispensation principles
The dispensation of climate finance determines whether it will benefit the most vulnerable groups and affects the equity of the distribution[26,27]. In this study, the allocation of climate finance refers to the process of mobilizing international climate finance and then allocating it among different recipient countries. This study considers the following three principles for the dispensation of climate finance:
The Carbon Intensity-Adaptation Need (CIAN) and Carbon Reduction Contribution-Adaptation Need (CRCAN) principles allocate climate finance based on its intended use. In terms of mitigation need, under the CIAN principle, countries with higher carbon intensity tend to have lower energy efficiency and higher reliance on fossil fuels in their economies, thereby possessing greater potential for emission reductions[28]. While under the CRCAN principle, regions with higher GDP are more likely to take mitigation actions[29]. In terms of adaptation needs, countries facing higher climate damages should receive more climate finance to support climate adaptation[30]. When allocating finance to recipient countries, mitigation and adaptation needs are considered on average.
The dispensation rates
where CIj,t is the carbon intensity of recipient country j in year t; GDPj,t is the GDP of recipient country j in year t; and Damagej,t is the climate damage of recipient country j in year t.
The Equity Need (EQU) principle allocates climate finance based on the consensus of equality for all people[31]. Under this principle, the per capita finance should be the same across all recipient countries. Therefore, the dispensation rate
where POPj,t is the population of recipient country j in year t.
RESULTS
Given that the climate finance in the context of this study lasts until 2050 at the latest, we primarily focus on the climate and economic impacts before this time point.
Effect of collection and dispensation principles
Based on the collection and dispensation principles from Section 2.3, we simulate the results of climate finance lasting from 2025 to 2035 and 2050, respectively, resulting in 19 policy scenarios. The scenario design is shown in Table 1. Among them, the scenario without climate finance (BAU) refers to the RCP4.5 and SSP2 scenario[32]. In this section, the European Union (EU), the United States (USA), and other Organization for Economic Co-operation and Development (OECD) countries (Other OECD) are designated as donor countries, while the remaining regions are defined as recipient countries. The collection and dispensation rates by region under different scenarios are presented in Table 2.
Scenario design
| Scenario | Duration of climate finance | Collection principle | Dispensation principle |
| BAU | No financing | No financing | No financing |
| AP_CIAN_35 | 2025~2035 | AP | CIAN |
| AP_CRCAN_35 | CRCAN | ||
| AP_EQU_35 | EQU | ||
| HER_CIAN_35 | HER | CIAN | |
| HER_CRCAN_35 | CRCAN | ||
| HER_EQU_35 | EQU | ||
| RCI_CIAN_35 | RCI | CIAN | |
| RCI_CRCAN_35 | CRCAN | ||
| RCI_EQU_35 | EQU | ||
| AP_CIAN_50 | 2025~2050 | AP | CIAN |
| AP_CRCAN_50 | CRCAN | ||
| AP_EQU_50 | EQU | ||
| HER_CIAN_50 | HER | CIAN | |
| HER_CRCAN_50 | CRCAN | ||
| HER_EQU_50 | EQU | ||
| RCI_CIAN_50 | RCI | CIAN | |
| RCI_CRCAN_50 | CRCAN | ||
| RCI_EQU_50 | EQU |
Collection and dispensation rates by region under different scenarios (%)
| Collection principle | Dispensation principle | Donors | Recipients | ||||||
| EU | USA | Other OECD | Former USSR | China | Southeast Asia | Africa | Latin America | ||
| AP | CIAN | 37.72 | 40.36 | 21.92 | 15.77 | 23.94 | 27.42 | 19.44 | 13.42 |
| CRCAN | 37.72 | 40.36 | 21.92 | 3.10 | 33.56 | 35.19 | 15.64 | 12.51 | |
| EQU | 37.72 | 40.36 | 21.92 | 4.27 | 21.81 | 36.73 | 27.21 | 9.98 | |
| HER | CIAN | 33.16 | 48.47 | 18.37 | 15.77 | 23.94 | 27.42 | 19.44 | 13.42 |
| CRCAN | 33.16 | 48.47 | 18.37 | 3.10 | 33.56 | 35.19 | 15.64 | 12.51 | |
| EQU | 33.16 | 48.47 | 18.37 | 4.27 | 21.81 | 36.73 | 27.21 | 9.98 | |
| RCI | CIAN | 35.85 | 43.74 | 20.41 | 15.77 | 23.94 | 27.42 | 19.44 | 13.42 |
| CRCAN | 35.85 | 43.74 | 20.41 | 3.10 | 33.56 | 35.19 | 15.64 | 12.51 | |
| EQU | 35.85 | 43.74 | 20.41 | 4.27 | 21.81 | 36.73 | 27.21 | 9.98 | |
Climate results
Based on the model settings in Section 2.2, climate finance is provided by donor countries to support the emission reductions in recipient countries, meaning that the climate outcomes are not affected by differences in collection principles. For simplicity, the collection principles are omitted in the graphical representations of this section.
Figure 1 shows the global temperature rise under different scenarios. The results show that if climate finance continues until 2035 and 2050, the global temperature rise will decrease by 0.14 °C and 0.16 °C in 2050, respectively. In terms of different dispensation principles, the CIAN scenario yields the largest emission reductions, while the EQU scenario results in the least emission reductions. However, the differences across dispensation principles are small, with a maximum difference of no more than 0.01 °C in 2050.

Figure 1. Global temperature rise from 2020 to 2050 under different scenarios. Note: The result of temperature rise is affected by parameter uncertainties. For clarity of representation, only the mean results for each scenario are shown in this figure. The results of the 95% confidence intervals are presented in Supplementary Table 3.
The regional results explain the reasons for the differences in global temperature rise across scenarios. Figure 2 shows the cumulative emission reduction rates of recipient countries for all GHGs under different scenarios. Since the CIAN scenario allocates climate finance based on carbon intensity, regions with higher baseline emissions, such as the Former USSR, see a significant increase in cumulative emission reductions, leading to the most substantial global emission reductions in this scenario. Furthermore, due to the higher Global Warming Potential (GWP) of non-CO2 gases, investing climate finance in the reduction of non-CO2 gases, compared to scenarios focused only on CO2 reduction [Supplementary Figures 1 and 2], will enhance the overall emission reduction effectiveness and contribute to a further reduction in global temperature rise.

Figure 2. The cumulative emission reduction rate of GHGs by region under different scenarios compared to BAU. Note: LG stands for linear gas. GHG: Greenhouse gas; BAU: business as usual.
Economic results
Figure 3 shows the economic effects by region in 2050 compared to the BAU scenario under different scenarios. The results show that climate finance compensates for the climate damages for recipient countries, but also imposes certain economic costs on donor countries. For recipient countries, mitigation finance reduces the global temperature rise, thereby decreasing climate damages. Additionally, adaptation finance further compensates for the climate damages. For recipient countries, mitigation finance reduces climate damages by limiting global temperature rise, while adaptation finance provides additional compensation for residual climate damages. The extension of the financing duration further enhances the economic benefits for recipient countries. If financing continues until 2035 and 2050, the economic benefits of each recipient country as a share of GDP will range from 0.18% to 1.50% and 0.21% to 2.06%, respectively. At the regional level, the economic effects on recipient countries primarily depend on the proportion of climate finance for mitigation and adaptation actions, as well as differences in dispensation principles. Specifically, due to Africa’s higher climate vulnerability and higher proportion of adaptation finance, climate finance delivers the greatest economic benefits to this region, averaging 0.77% and 1.70% of GDP under scenarios where financing continues until 2035 and 2050, respectively. Former USSR sees higher economic benefits under the CIAN principle, owing to its high carbon intensity and a relatively high dispensation rate under this principle.

Figure 3. The economic effects by region in 2050 compared to the BAU scenario under different scenarios. BAU: business as usual.
Donor countries, despite benefiting from the mitigation effects of reduced temperature rise resulting from recipient countries' emissions reductions, also bear the corresponding costs of climate finance. As a result, the economic effects for donor countries are negative in all scenarios for 2050, and are mainly influenced by differences in collection principles. Specifically, due to higher baseline emissions, USA faces higher economic costs under the HER principle, leading it to prefer the AP principle. However, EU and other OECD countries, with lower baseline emissions, face higher economic costs under the AP principle and tend to prefer the HER principle. In comparison, the RCI principle balances historical responsibility and economic capability, making it a burden-sharing scheme that is more acceptable to all donor countries.
Furthermore, we also calculate the Social Cost of Carbon (SCC) under different scenarios [Table 3]. SCC represents the marginal social cost of global damages caused by the emission of one ton of CO2, reflecting the cost that society is willing to pay now to avoid future damage from today’s carbon emissions. The results indicate that after the introduction of climate finance, due to the reduced global temperature rise, SCC decreases in all scenarios compared to the BAU scenario. Specifically, extending the financing period has a particularly significant effect on decreasing long-term SCC. Moreover, the collection principles have a certain impact on SCC, while the dispensation principles have minimal effects. The results suggest that climate finance not only facilitates short-term mitigation actions, but also endogenously reduces the SCC by reducing future climate risks.
SCC from 2020 to 2050 under different scenarios($2015)
| Scenario | 2020 | 2030 | 2040 | 2050 |
| BAU | 244.5971 | 259.6697 | 384.6415 | 383.7539 |
| AP_CIAN_35 | 244.1225 | 243.4949 | 350.135 | 348.6889 |
| AP_CRCAN_35 | 244.514 | 243.4017 | 349.9269 | 348.4957 |
| AP_EQU_35 | 243.978 | 243.356 | 349.8692 | 348.4697 |
| HER_CIAN_35 | 244.1255 | 245.6257 | 354.3074 | 352.8452 |
| HER_CRCAN_35 | 244.517 | 245.5316 | 354.0967 | 352.6496 |
| HER_EQU_35 | 243.9811 | 245.4855 | 354.0384 | 352.6234 |
| RCI_CIAN_35 | 244.1239 | 244.5598 | 352.2007 | 350.7467 |
| RCI_CRCAN_35 | 244.5154 | 244.4662 | 351.9913 | 350.5522 |
| RCI_EQU_35 | 243.9794 | 244.4203 | 351.9333 | 350.5261 |
| AP_CIAN_50 | 246.1367 | 246.0063 | 332.6528 | 284.9835 |
| AP_CRCAN_50 | 238.054 | 241.5433 | 332.5679 | 284.8369 |
| AP_EQU_50 | 242.0973 | 243.1876 | 332.5568 | 284.8429 |
| HER_CIAN_50 | 246.1482 | 248.1691 | 337.7399 | 293.989 |
| HER_CRCAN_50 | 238.0649 | 243.6669 | 337.6538 | 293.8378 |
| HER_EQU_50 | 242.1084 | 245.3257 | 337.6425 | 293.844 |
| RCI_CIAN_50 | 246.1415 | 247.0863 | 335.1555 | 289.3029 |
| RCI_CRCAN_50 | 238.0586 | 242.6037 | 335.0701 | 289.1541 |
| RCI_EQU_50 | 242.1019 | 244.2553 | 335.0589 | 289.1602 |
Effect of governance capacity on the efficiency of climate finance
This section incorporates CPI as a proxy for regional governance capacity to simulate efficiency disparities among countries in the collection and utilization of climate finance. Specifically, the weaker the governance capacity of the donor country, the less efficient the collection of funds and the more funds will be needed to achieve the stated financing objectives. In addition, the weaker the governance capacity of the recipient country, the less efficient the utilization of funds and the less effective the mitigation and adaptation actions will be. The formulas for introducing the governance capacity are as follows:
where CPI denotes the Corruption Perceptions Index, which reflects perceived levels of public sector corruption. The index ranges from 0 to 100, where 0 indicates high corruption and 100 signifies strong integrity. The CPI for each region is provided in Supplementary Table 4.
The results in Section 3.1 indicate that the RCI principle can consider the willingness of each donor country to the greatest extent. Meanwhile, the CIAN principle results in the lowest global warming and a more even distribution of mitigation responsibilities among recipient countries. Therefore, we use the RCI and CIAN principles as the collection and allocation principles for the simulations in Sections 3.2 and 3.3, assuming that climate finance will be provided until 2050.
The results show that governance deficits substantially undermine the overall effectiveness of climate finance [Figure 4]. Incorporating regional governance inefficiencies leads to an increase of approximately 0.06 °C in global temperature rise in 2050. At the regional level, GHG emission reductions among recipient countries decline by 19.2% to 25.7%, with Former USSR and Latin America experiencing the largest reductions in effectiveness due to relatively weak governance capacities. In terms of economic outcomes, the effect on GDP ranges from a decline of 0.09% to 1.25% across regions, with Former USSR and Africa experiencing the most pronounced economic losses. In contrast, donor countries generally have higher governance capacities and suffer fewer economic losses.
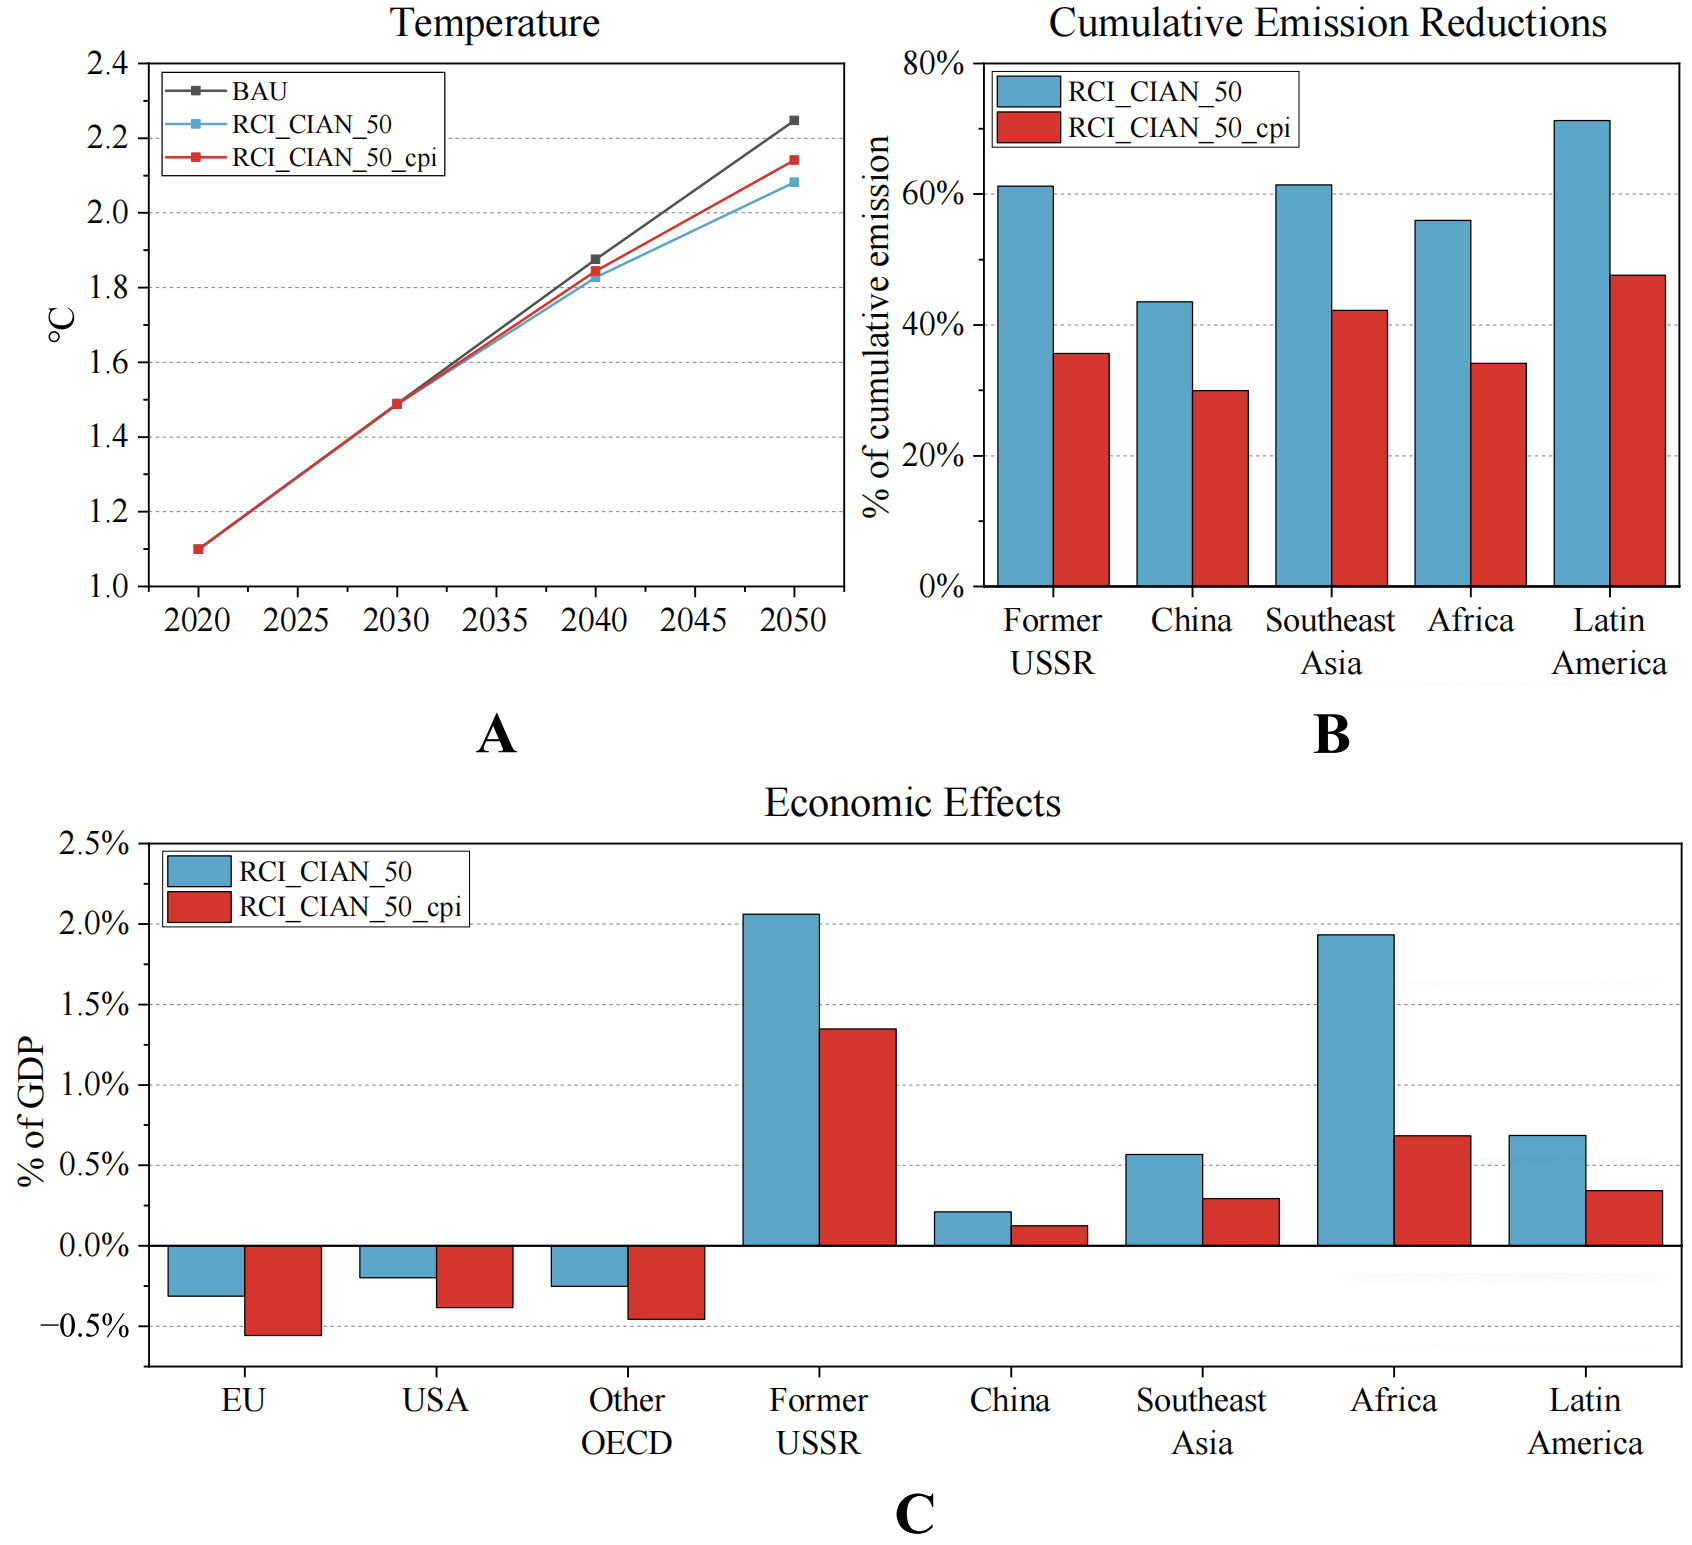
Figure 4. Climate and economic results considering the governance capacity. (A) Global temperature rise from 2020 to 2050; (B) The average cumulative emission reduction rate of GHGs; (C) The economic effects by region in 2050 compared to the BAU scenario. Among them, RCI_CIAN_50_cpi is the scenario considering governance capacity. Note: The result of temperature rise is affected by parameter uncertainties. For clarity of representation, only the mean results for each scenario are shown in Figure 4A. The results of the 95% confidence intervals are presented in Supplementary Table 3. Figure 4B shows the average cumulative emission reduction rate; the values for each GHG are presented in Supplementary Figure 3. GHG: Greenhouse gas; BAU: business as usual.
Effect of changing donors and recipient roles on the efficiency of climate finance
In the preceding sections, we analyzed scenarios in which the USA, EU, and other OECD countries serve as climate finance donors, while other regions are treated as recipients. Although China is formally classified as a recipient country, its actual role in international cooperation tends to be that of a donor. Therefore, in this section, we simulate the scenario by including China as a donor country. The resulting collection and dispensation rates after this change are presented in Table 4.
Proportion of collection and dispensation rates by region considering the change of donors and recipients (%)
| Donors | Recipients | ||||||
| EU | USA | Other OECD | China | Former USSR | Southeast Asia | Africa | Latin America |
| 19.85 | 23.90 | 11.25 | 45.00 | 16.62 | 37.27 | 30.36 | 15.74 |
Figure 5 illustrates the climate and economic results considering the change of donors and recipients. The results show that changing China from a recipient to a donor country reduces the fiscal burden on traditional donor countries, yet decreases the overall effectiveness of global mitigation efforts. Specifically, the global temperature rise in 2050 increases by an additional 0.02 °C. This outcome is largely attributed to the fact that China, as one of the largest GHG emitters, plays a critical role in global mitigation outcomes. China’s shift in international cooperation results in a reversal of its net economic effect from positive to negative in 2050. On the one hand, by no longer receiving climate finance to support mitigation and adaptation actions, China faces increased climate damages and diminished economic benefits. On the other hand, as a donor country, China assumes substantial financial obligations due to its high emission level and large economic scale, further raising its overall economic costs. Nevertheless, the fiscal burden on traditional donor countries is correspondingly alleviated, with their economic effects as a share of GDP improving by 0.17% to 0.20% in 2050. Moreover, not all recipient countries benefit from China’s reclassification. Regions such as Southeast Asia and Latin America experience declines in total economic benefits due to the increase in temperature rise. Overall, adjusting the burden-sharing arrangement without increasing the total amount of finance may ease the pressure on traditional donor countries but ultimately undermines the mitigation potential of major recipient countries.

Figure 5. Climate and economic results considering the change of donors and recipients. (A) Global temperature rise from 2020 to 2050; (B) The average cumulative emission reduction rate of GHGs; (C) The economic effects by region in 2050 compared to the BAU scenario. Among them, RCI_CIAN_50_ci is the scenario considering the change of donors and recipients. Note: The result of temperature rise is affected by parameter uncertainties. For clarity of representation, only the mean results for each scenario are shown in Figure 5A. The results of the 95% confidence intervals are presented in Supplementary Table 3. Figure 5B shows the average cumulative emission reduction rate; the values for each GHG are presented in Supplementary Figure 4. GHG: Greenhouse gas; BAU: business as usual.
Sensitivity analysis
In the sensitivity analysis, we assess the impact of key parameter variations on the SCC values under the RCI_CIAN_50 scenario. To assess the model’s sensitivity to critical assumptions, each parameter is perturbed within a one standard deviation range, and the results are presented in Figures 6 and 7. The complete results of the sensitivity analysis can be found in Supplementary Tables 5 and 6.

Figure 6. Impact of a parameter increase by one standard deviation on the 2050 SCC. Only parameters with an absolute SCC impact of at least $11 are displayed here. SCC: Social cost of carbon.

Figure 7. Impact of a parameter decrease by one standard deviation on the SCC. Only parameters with an absolute SCC impact of at least $11 are displayed here. SCC: Social cost of carbon.
The results show that damage-related parameters have relatively symmetric effects on SCC, suggesting that the model’s conclusions are less sensitive to variations in these parameters. In contrast, discounting parameters exhibit the most pronounced and asymmetric impacts. For example, a decrease in the pure time preference significantly raises the SCC, while an increase substantially lowers it, indicating the model’s high sensitivity to intertemporal preference assumptions. Furthermore, climate-related parameters also produce asymmetric effects, with one standard deviation increase leading to a substantially greater change in SCC compared to an equivalent decrease. Despite certain parameters having notable effects under positive or negative perturbations, the overall ranking of SCC values remains consistent across parameter variations, demonstrating the model’s robustness.
DISCUSSION AND LIMITATIONS
The objective of this study is to evaluate the climate and economic outcomes of the NCQG for climate finance. We find that international climate finance could promote mitigation outcomes and compensate for climate damages in recipient countries, but may impose economic costs on donor countries. Consistent with the findings of existing studies[12,14,15,33], we find that the duration of finance and the choice of collection and dispensation principles influence the effectiveness of climate finance. However, some studies present different conclusions. For example, Wu et al.[13] argued that donor countries may also benefit from climate finance in 2050. This divergence may stem from differences in model structure and scenario assumptions, as their study assumed an annual climate finance level of $100 billion and considers only CO2 mitigation.
This study further considers governance capacity and the classification of donor and recipient countries, which are rarely discussed in current research on the impacts of climate finance. Most existing studies on the role of governance capacity in climate finance effectiveness are based on a qualitative level[34-36], whereas this study quantitatively demonstrates the decisive influence of governance capacity on financing outcomes, emphasizing that governance indicators should be incorporated into the allocation of climate finance. In addition, this study finds that changing the classification of donor and recipient countries has an important impact on the effectiveness of climate finance. When China is reclassified from a recipient to a donor country, although the fiscal burden on traditional donor countries is reduced, it results in a decline in total emission reductions due to China’s high mitigation potential. This phenomenon is also reflected in the conclusions of other studies[37,38]. Our findings suggest that although the traditional “developed-developing” binary division of donor roles no longer reflects the current international financing landscape, more flexible burden-sharing mechanisms may yield unintended adverse consequences.
Despite the marginal contribution of this study to the impacts of climate finance, it has three main limitations that could be addressed in future research. First, PAGE-ICE is based on calibrated MAC curves, which makes it difficult to simulate the heterogeneous impacts of climate finance on different technologies and economic sectors. The use of detailed process IAMs or CGE models would help to further delineate the impact mechanisms of climate finance, particularly its impacts on technological progress and specific adaptation measures. Second, measuring governance efficiency across countries based on the CPI simplifies the impact of governance capacity factors on the effectiveness of climate finance implementation. Third, we assume that climate finance is invested in both mitigation and adaptation actions. Without considering its potential role in promoting production in recipient countries, our results may overlook the “rebound effect” of climate finance, meaning that receiving finance could lead to increased fossil fuel consumption[39].
CONCLUSIONS AND POLICY IMPLICATIONS
Climate finance provided by developed countries to developing countries has become a central issue in international climate negotiations. This study, based on the PAGE-ICE model, incorporates a climate finance module to assess the effectiveness of the NCQG of climate finance under different collection and dispensation principles, and further explores the influence of governance capacity and the classification of donor and recipient countries on global climate and economic outcomes. The main findings are as follows:
(1) If international climate finance lasts until 2035, the global temperature rise in 2050 is projected to decrease by 0.13 °C to 0.14 °C compared to the BAU scenario. Under the CIAN principle, regions with higher baseline emissions receive a larger share of finance, thereby achieving the most significant mitigation outcomes. In terms of economic effects, the change in economic effects as a share of GDP in 2050 ranges from -0.52% to -0.43% for donor countries and 0.18% to 1.50% for recipient countries across different collection and dispensation principles. While differences in total economic effects are relatively small across collection principles, the RCI principle, which jointly considers historical emissions and economic capacity, emerges as a preferred compromise for equitable burden-sharing among donor countries. The difference in dispensation principles impacts the total economic effects by affecting the global temperature rise. While the total climate damage is lowest under the CIAN principle, the economic benefits are more evenly distributed across recipient countries under the CRCAN principle.
(2) Long-term climate finance by donor countries to support mitigation and adaptation actions in recipient countries not only helps reduce global temperature rise but also enhances net bilateral benefits. If climate finance is extended to 2050, the global temperature rise in 2050 will decline by an additional 0.02 °C. As a result of the global temperature rise, economic effects as a share of GDP are expected to rise by 0.03% to 0.99% for donor countries and 0.17% to 0.30% for recipient countries.
(3) Governance capacity affects the effectiveness of climate finance by influencing the efficiency with which finance is collected and used. When regional governance deficits are considered, the global temperature rise in 2050 increases by approximately 0.06 °C, and economic effects as a share of GDP are reduced by 0.19% to 0.25% for donor countries and 0.09% to 1.25% for recipient countries. Donor countries, typically characterized by higher governance capacity, experience relatively minor economic loss. In contrast, recipient regions such as Former USSR and Africa face the greatest losses due to their relatively low levels of governance capacity.
(4) When China is classified from a recipient to a donor, the fiscal burden on traditional donor countries is reduced. However, given China’s status as one of the world’s largest GHG emitters, its mitigation actions play a crucial role in influencing global temperature rise. As a result, this reclassification negatively affects both global mitigation outcomes and economic benefits across countries.
Based on the above findings, the policy recommendations are as follows:
(1) Optimize collection and dispensation mechanisms to strike a balance between equity and efficiency. Regarding the dispensation of climate finance, a flexible dispensation mechanism is recommended, one that simultaneously prioritizes mitigation effectiveness and channels resources toward countries most in need of support. Regarding the burden-sharing of climate finance, responsibility-capacity integrated mechanisms should be prioritized, as they reconcile historical responsibility with economic capacity and facilitate a fairer distribution of obligations among donor countries.
(2) Extend the duration of climate finance to strengthen long-term capacity building in recipient countries. Prolonging the financing period significantly enhances the mitigation and adaptation capacities of recipient countries and improves net bilateral benefits between donors and recipients. It is recommended to extend the time of climate finance to ensure sustained financial support for the systemic transformation of developing countries, thereby shifting the focus of climate policy from short-term assistance toward long-term development cooperation.
(3) Incorporate governance capacity into financing allocation to improve the efficiency of fund utilization. Countries with weak governance tend to exhibit lower effectiveness in converting climate finance into mitigation outcomes and economic benefits. It is recommended to prioritize support for countries and projects with stronger governance capacities while simultaneously enhancing institutional capacity in
(4) Promote a flexible and diversified donor structure to reshape the traditional “donor-recipient” paradigm. Future institutional frameworks should transcend the binary division between developed and developing countries by adopting a comprehensive assessment mechanism. Such a mechanism would enable emerging economies with substantial mitigation potential and strong governance capacity to access prioritized financing or to assume dual roles during transitional phases, thereby fostering a more sustainable, balanced, and efficient global climate finance architecture.
DECLARATIONS
Authors’ contributions
Conceptualization and supervision: Liu, Y.
Methodology, software, visualization and writing-original draft: Wen, X.; Zhao, X.; Zhang, Z.
Writing-review and editing: Li, Z.; Zhang, J.
Availability of data and materials
The data that support the findings of this study are available from the corresponding author upon reasonable request.
Financial support and sponsorship
The paper was supported by the National Natural Science Foundation of China (No. 72125010; No. 72243011; No. 72404007; No. 724B2001), the China Postdoctoral Science Foundation (2024M750025), the Postdoctoral Fellowship Program of China Postdoctoral Science Foundation (GZC20240044), and the Fundamental Research Funds for the Central Universities in Peking University.
Conflicts of interest
Liu, Y. is the Associate Editor of the journal Carbon Footprints. Liu, Y. was not involved in any steps of editorial processing, notably including reviewer selection, manuscript handling, or decision making. The other authors declared that there are no conflicts of interest.
Ethical approval and consent to participate
Not applicable.
Consent for publication
Not applicable.
Copyright
© The Author(s) 2025.
Supplementary Materials
REFERENCES
1. Sun, Y.; Zhu, S.; Wang, D.; et al. Global supply chains amplify economic costs of future extreme heat risk. Nature 2024, 627, 797-804.
2. Robinson, S.; Dornan, M. International financing for climate change adaptation in small island developing states. Reg. Environ. Change. 2017, 17, 1103-15.
3. United Nations Framework Convention on Climate Change. What is the Kyoto Protocol? https://unfccc.int/kyoto_protocol (accessed 2025-05-20).
4. Carfora, A.; Scandurra, G. The impact of climate funds on economic growth and their role in substituting fossil energy sources. Energy. Policy. 2019, 129, 182-92.
5. Carty, T.; Le, C. A. Climate finance shadow report 2018: assessing progress towards the $100 billion commitment. Oxfam; 2018.
6. Savvidou, G.; Atteridge, A.; Omari-motsumi, K.; Trisos, C. H. Quantifying international public finance for climate change adaptation in Africa. Climate. Policy. 2021, 21, 1020-36.
7.
8. Scandurra, G.; Thomas, A.; Passaro, R.; Bencini, J.; Carfora, A. Does climate finance reduce vulnerability in small island developing states? J. Clean. Prod. 2020, 256, 120330.
9. Zoungrana, T. D.; Lompo, A. A. B.; Toé, D. L. T. Effect of climate finance on environmental quality: a global analysis. Res. Econ. 2024, 78, 100989.
10. Pickering, J.; Skovgaard, J.; Kim, S.; et al. Acting on climate finance pledges: inter-agency dynamics and relationships with aid in contributor states. World. Dev. 2015, 68, 149-62.
11. Bhandary, R. R.; Gallagher, K. S.; Zhang, F. Climate finance policy in practice: a review of the evidence. Clim. Policy. 2021, 21, 529-45.
12. Lee, C.; Li, X.; Yu, C.; Zhao, J. The contribution of climate finance toward environmental sustainability: new global evidence. Energy. Econ. 2022, 111, 106072.
13. Wu, J.; Tang, L.; Mohamed, R.; Zhu, Q.; Wang, Z. Modeling and assessing international climate financing. Front. Earth. Sci. 2016, 10, 253-63.
14. Gu, G.; Zhang, W.; Cheng, C. Mitigation effects of global low carbon technology financing and its technological and economic impacts in the context of climate cooperation. J. Clean. Prod. 2022, 381, 135182.
15. Antimiani, A.; Costantini, V.; Markandya, A.; Paglialunga, E.; Sforna, G. The green climate fund as an effective compensatory mechanism in global climate negotiations. Environ. Sci. Policy. 2017, 77, 49-68.
16. Kikstra, J. S.; Waidelich, P.; Rising, J.; Yumashev, D.; Hope, C.; Brierley, C. M. The social cost of carbon dioxide under climate-economy feedbacks and temperature variability. Environ. Res. Lett. 2021, 16, 094037.
17. Yumashev, D.; Hope, C.; Schaefer, K.; et al. Climate policy implications of nonlinear decline of Arctic land permafrost and other cryosphere elements. Nat. Commun. 2019, 10, 1900.
18. Burke, M.; Hsiang, S. M.; Miguel, E. Global non-linear effect of temperature on economic production. Nature 2015, 527, 235-9.
19. Castro, P.; Betzold, C. Climate finance after the Paris Agreement: new directions or more of the same? Global Governance Spotlight 2016,3. https://www.zora.uzh.ch/id/eprint/137944/1/Castro-Betzold_-_Climate_finance_after_the_Paris_Agreement.pdf (accessed 2025-05-20).
20. Yang, Y.; Wang, Z.; Wu, J. Study on principles of burden sharing in international climate financing. Bull. Chin. Acad. Sci. 2016, 31, 820-9. (in Chinese)
21. Luppi, B.; Parisi, F.; Rajagopalan, S. The rise and fall of the polluter-pays principle in developing countries. Int. Rev. Law. Econ. 2012, 32, 135-44.
22. Cui, L.; Huang, Y. Exploring the schemes for green climate fund financing: international lessons. World. Dev. 2018, 101, 173-87.
23. Caney, S. Climate change and the duties of the advantaged. Crit. Rev. Int. Soc. Polit. Philos. 2010, 13, 203-28.
24. Dellink, R.; Elzen, M. D.; Aiking, H.; et al. Sharing the burden of financing adaptation to climate change. Glob. Environ. Change. 2009, 19, 411-21.
25. Zou, C. Q.; Alayza, N.; Higgins, H. Climate finance calculator: data and methodology. World Resources Institute 2024.
26. Rickman, J.; Kothari, S.; Larosa, F.; Ameli, N. The unequal distribution of international climate finance flows and its underlying drivers. Research Square 2022. Available online: https://www.researchsquare.com/article/rs-1188981/v1 (accessed 20 May 2025).
27. Chukwudum, Q. C.; Nadarajah, S. Modelling climate finance flows in Sub-Saharan Africa. Environ. Model. Assess. 2023, 28, 977-98.
28. Cui, L.; Sun, Y.; Song, M.; Zhu, L. Co-financing in the green climate fund: lessons from the global environment facility. Climate. Policy. 2020, 20, 95-108.
29. Weiler, F.; Klöck, C.; Dornan, M. Vulnerability, good governance, or donor interests? World. Dev. 2018, 104, 65-77.
30. Füssel, H. How inequitable is the global distribution of responsibility, capability, and vulnerability to climate change: a comprehensive indicator-based assessment. Glob. Environ. Change. 2010, 20, 597-611.
31. Wang, L.; Chen, W.; Zhang, H.; Ma, D. Dynamic equity carbon permit allocation scheme to limit global warming to two degrees. Mitig. Adapt. Strateg. Glob. Change. 2017, 22, 609-28.
32. Riahi, K.; van, V. D. P.; Kriegler, E.; et al. The shared socioeconomic pathways and their energy, land use, and greenhouse gas emissions implications: an overview. Glob. Environ. Change. 2017, 42, 153-68.
33. Rashid, S.; Khan, M. R.; Haque, N. Does climate finance enhance mitigation ambitions of recipient countries? Earth. Syst. Gov. 2023, 17, 100188.
34. Lubinga, M. H.; Mazenda, A. Empirical analysis of the effect of institutional governance indicators on climate financing. Economies 2024, 12, 29.
35. Winkler, H.; Keen, S.; Marquard, A. Policy approaches to guide finance flows for more effective climate action in South Africa. 2021.https://zivahub.uct.ac.za/articles/report/Policy_approaches_to_guide_finance_flows_for_more_effective_climate_action_in_South_Africa/14963157?file=31067815 (accessed 2025-05-20).
36. Macinante, J. Climate impact measurement in climate finance and carbon markets. Carbon. Clim. Law. Rev. 2020, 14, 199-209.
37. Kablan, S.; Chouard, V. Does climate aid matter for reducing CO2 emissions? Appl. Econ. 2022, 54, 5357-72.
38. Jakob, M.; Steckel, J. C.; Flachsland, C.; Baumstark, L. Climate finance for developing country mitigation: blessing or curse? Clim. Dev. 2015, 7, 1-15.
Cite This Article
How to Cite
Download Citation
Export Citation File:
Type of Import
Tips on Downloading Citation
Citation Manager File Format
Type of Import
Direct Import: When the Direct Import option is selected (the default state), a dialogue box will give you the option to Save or Open the downloaded citation data. Choosing Open will either launch your citation manager or give you a choice of applications with which to use the metadata. The Save option saves the file locally for later use.
Indirect Import: When the Indirect Import option is selected, the metadata is displayed and may be copied and pasted as needed.
About This Article
Special Issue
Copyright

Data & Comments
Data
0


Comments
Comments must be written in English. Spam, offensive content, impersonation, and private information will not be permitted. If any comment is reported and identified as inappropriate content by OAE staff, the comment will be removed without notice. If you have any queries or need any help, please contact us at [email protected].