


fig2
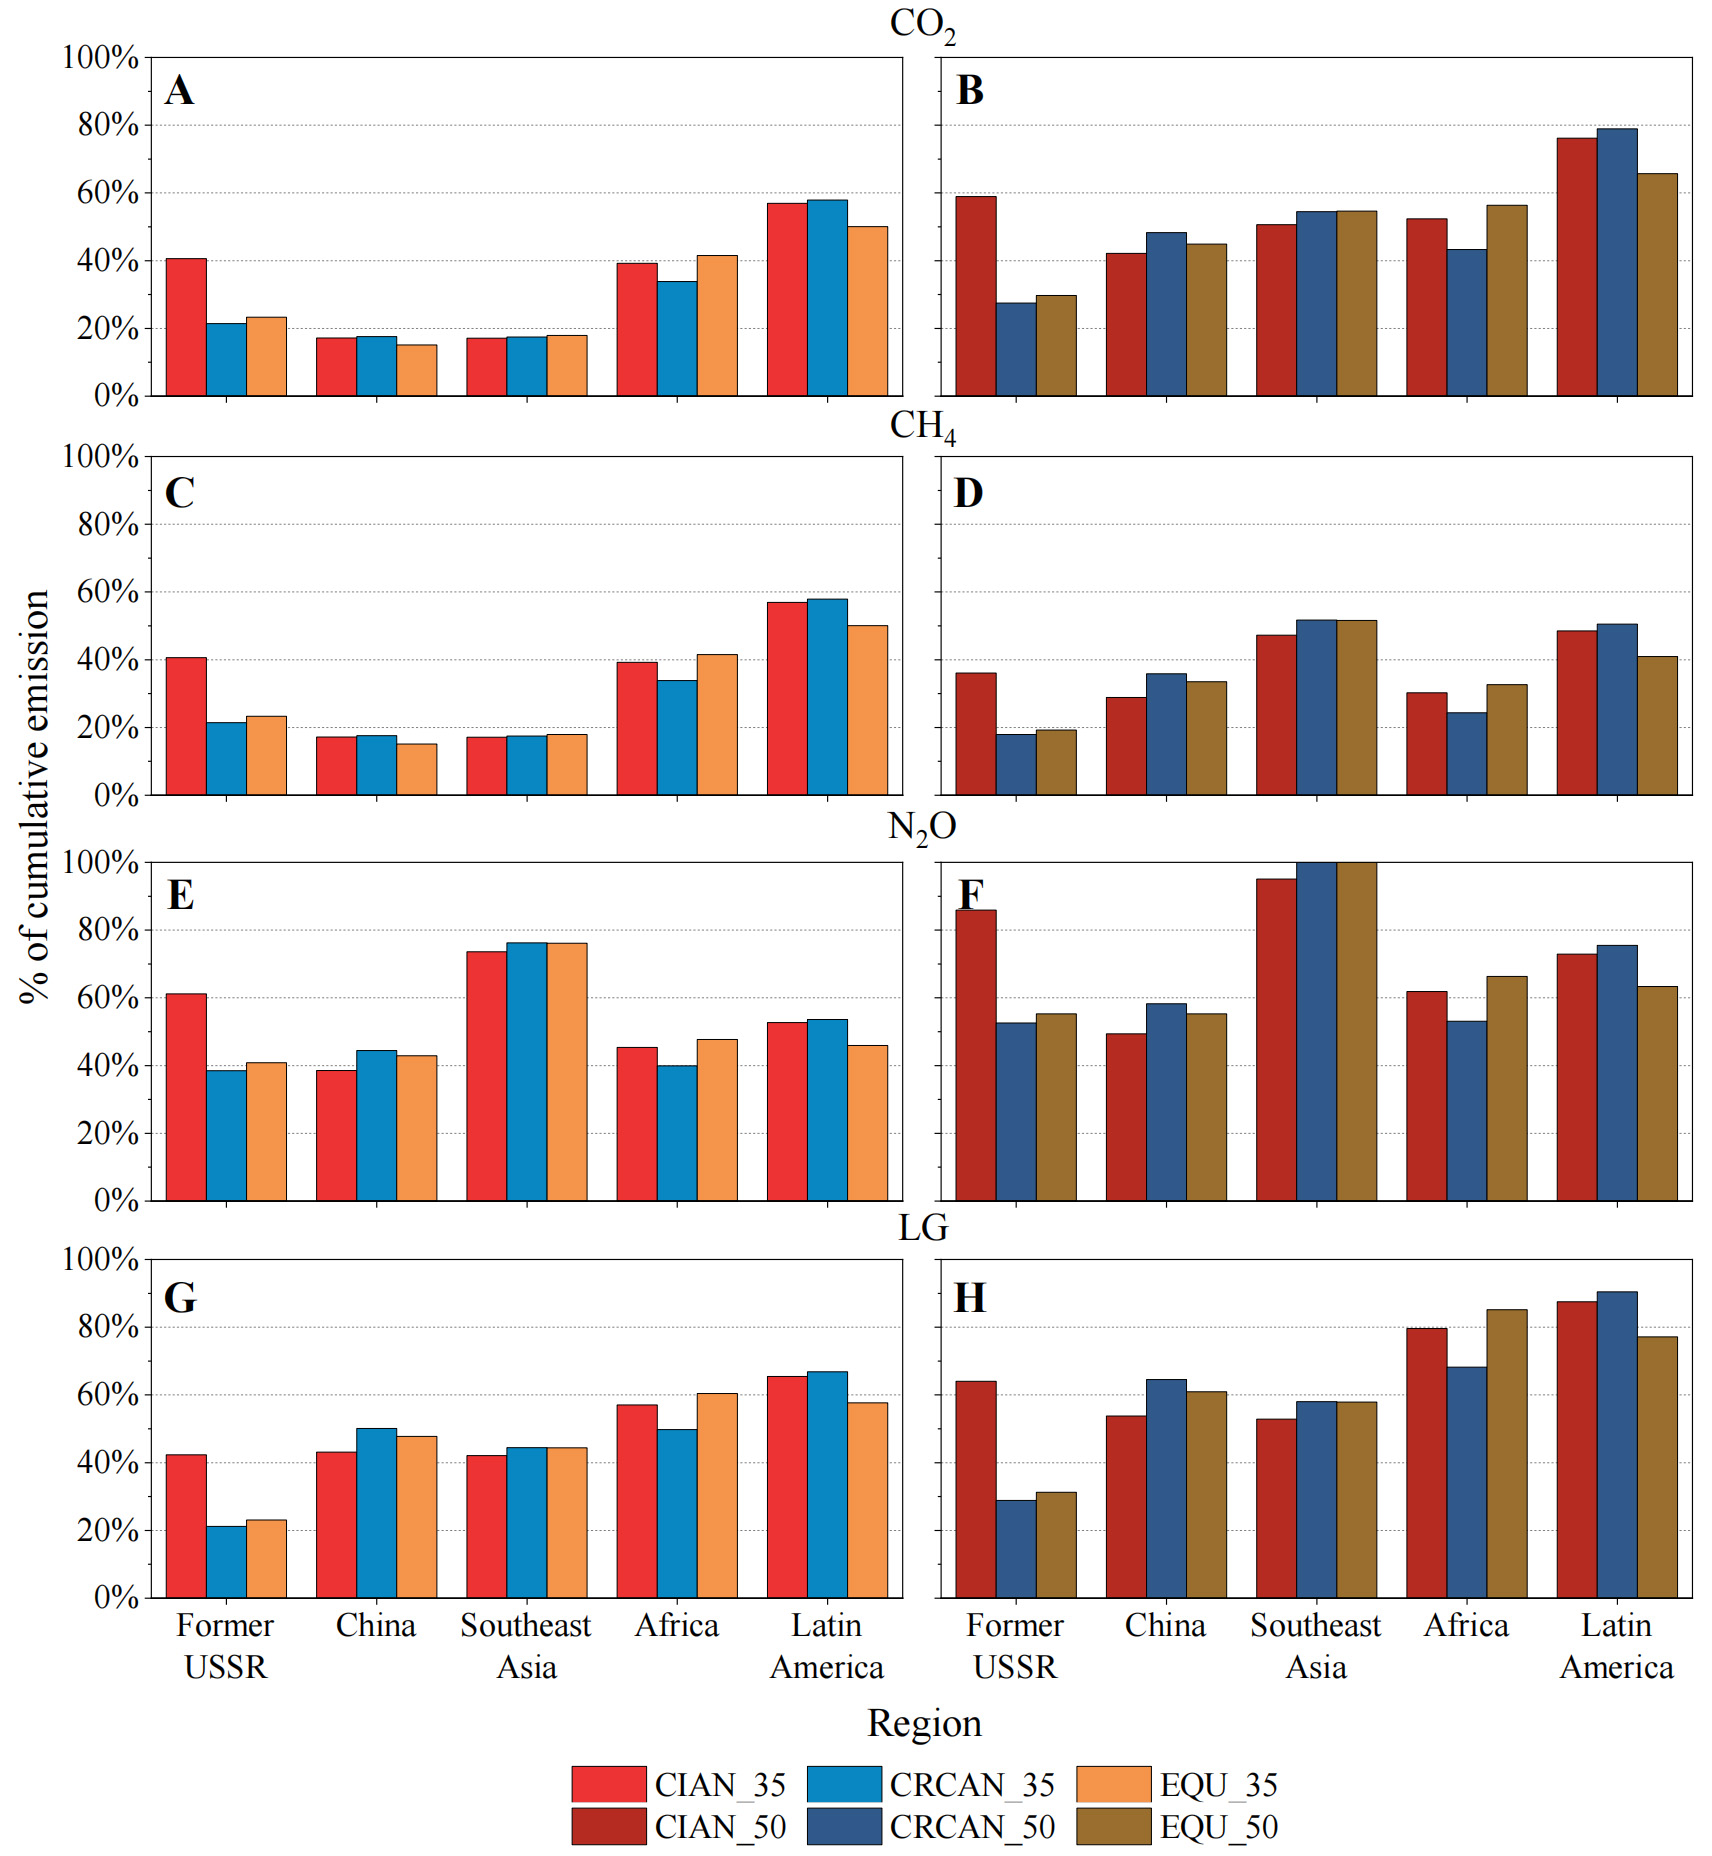
Figure 2. The cumulative emission reduction rate of GHGs by region under different scenarios compared to BAU. Note: LG stands for linear gas. GHG: Greenhouse gas; BAU: business as usual.
Figure 2. The cumulative emission reduction rate of GHGs by region under different scenarios compared to BAU. Note: LG stands for linear gas. GHG: Greenhouse gas; BAU: business as usual.


All published articles are preserved here permanently
https://www.portico.org/publishers/oae/


