


fig1
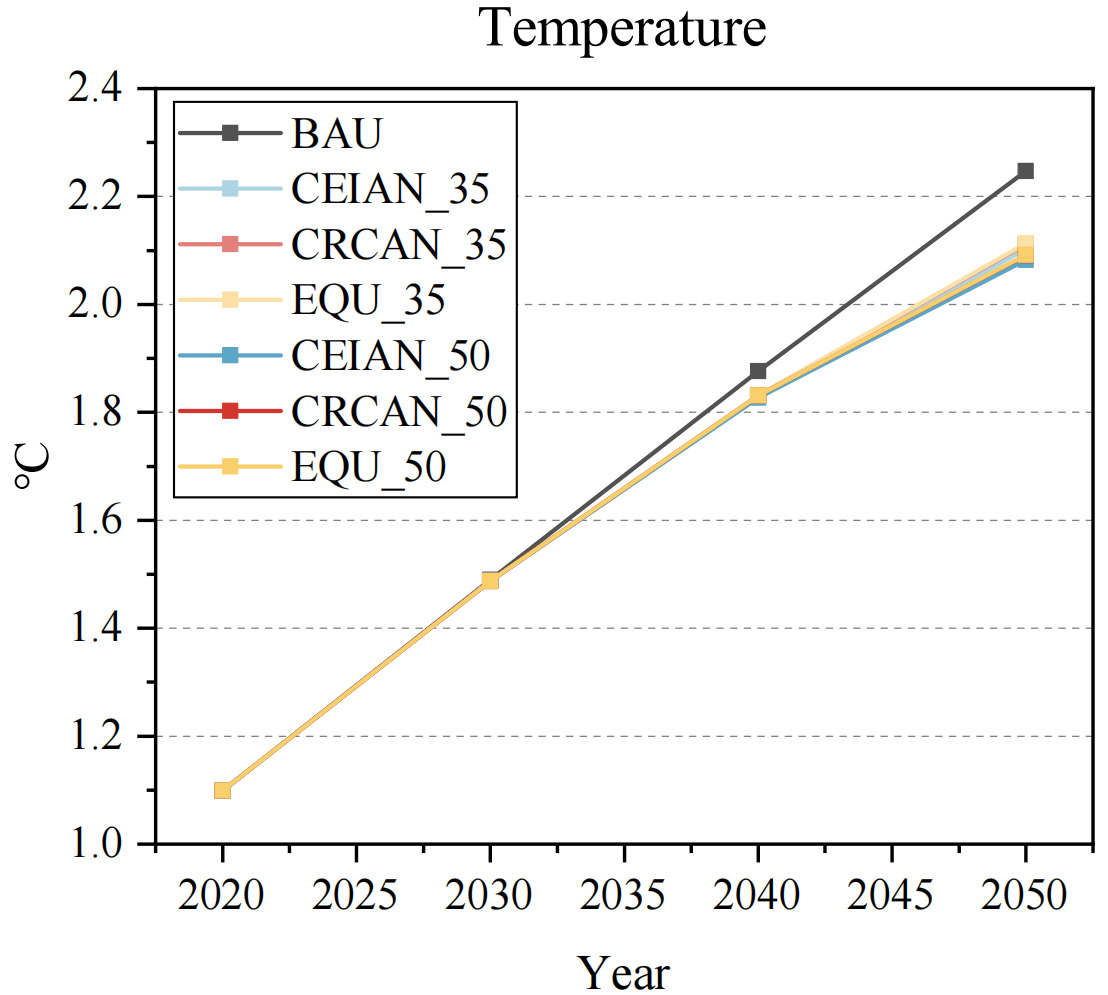
Figure 1. Global temperature rise from 2020 to 2050 under different scenarios. Note: The result of temperature rise is affected by parameter uncertainties. For clarity of representation, only the mean results for each scenario are shown in this figure. The results of the 95% confidence intervals are presented in Supplementary Table 3.


