


fig4
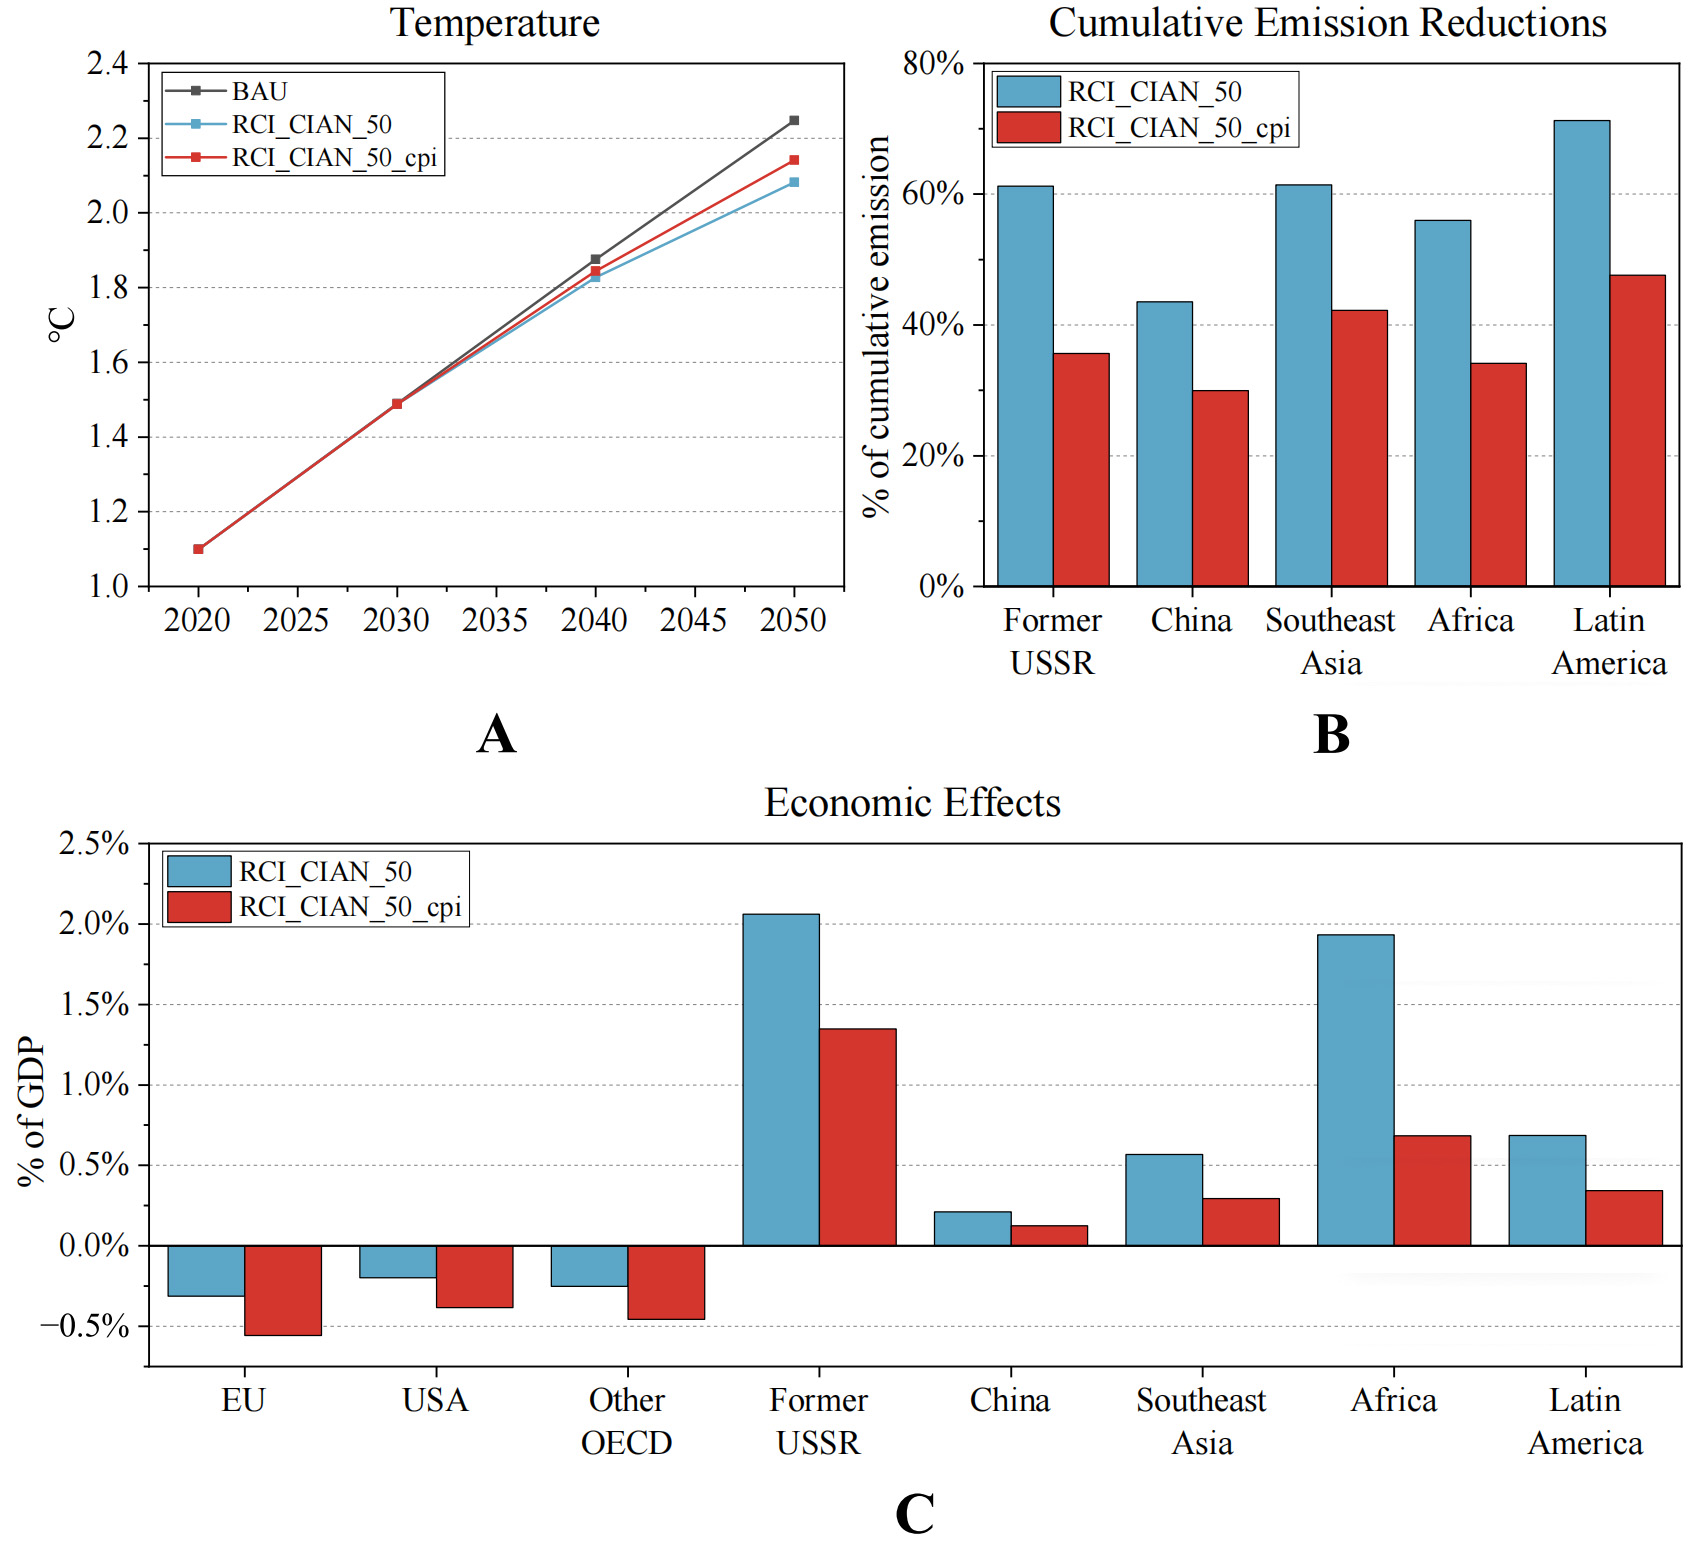
Figure 4. Climate and economic results considering the governance capacity. (A) Global temperature rise from 2020 to 2050; (B) The average cumulative emission reduction rate of GHGs; (C) The economic effects by region in 2050 compared to the BAU scenario. Among them, RCI_CIAN_50_cpi is the scenario considering governance capacity. Note: The result of temperature rise is affected by parameter uncertainties. For clarity of representation, only the mean results for each scenario are shown in Figure 4A. The results of the 95% confidence intervals are presented in Supplementary Table 3. Figure 4B shows the average cumulative emission reduction rate; the values for each GHG are presented in Supplementary Figure 3. GHG: Greenhouse gas; BAU: business as usual.


